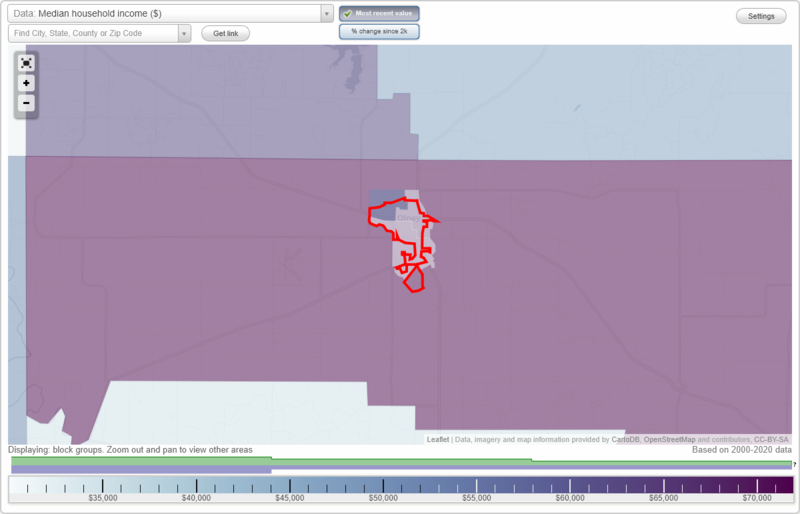
The median household income in Olney, TX in 2022 was $39,361, which was 83.6% less than the median annual income of $72,284 across the entire state of Texas. Compared to the median income of $21,991 in 2000 this represents an increase of 44.1%. The per capita income in 2022 was $31,016, which means an increase of 55.8% compared to 2000 when it was $13,723.
Whole page based on the data from 2000 / 2022 when the population of Olney, Texas was 3,396 / 3,097
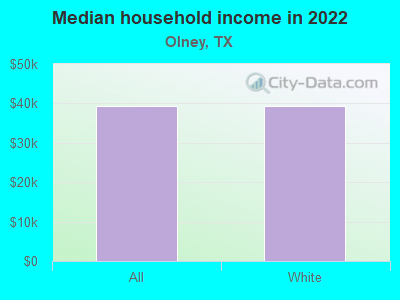
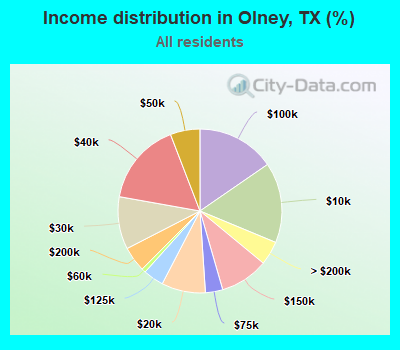
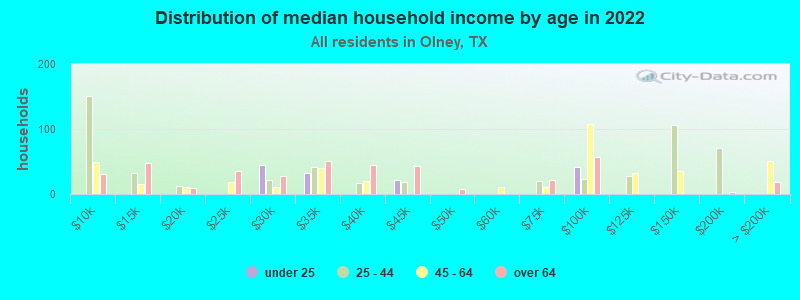
Income statistics for all residents
Median household income in Olney, TX in 2022:
Olney:
$39,361
State:
$72,284
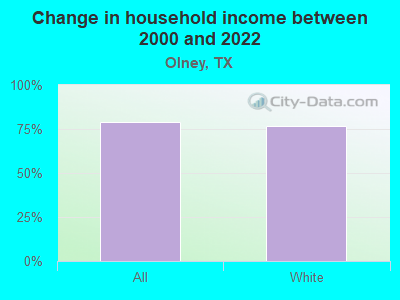
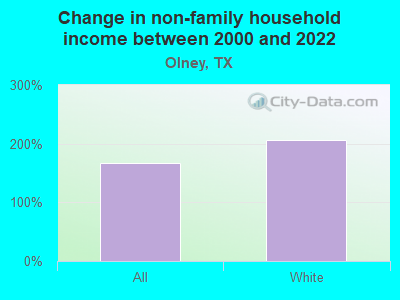
Change in median household income between 2000 and 2022:
Olney, Texas:
+79.0%
Texas:
+81.0%
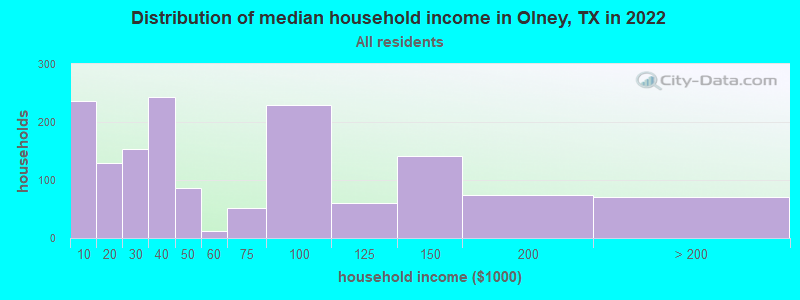
Number of households with income < $10k:
Olney:
15.9% (236)
State:
5.5% (611,011)
Number of households with income $10k - 20k:
Olney:
8.7% (129)
Texas:
6.7% (743,157)
Number of households with income $20k - 30k:
Olney:
10.4% (154)
State:
7.2% (803,381)
Number of households with income $30k - 40k:
Olney:
16.3% (243)
State:
7.8% (866,080)
Number of households with income $40k - 50k:
Olney:
5.9% (87)
State:
7.3% (810,440)
Number of households with income $50k - 60k:
Olney:
0.8% (12)
Texas:
7.2% (799,783)
Number of households with income $60k - 75k:
Olney:
3.4% (51)
State:
9.9% (1,095,384)
Number of households with income $75k - 100k:
Olney:
15.4% (229)
State:
12.8% (1,419,057)
Number of households with income $100k - 125k:
Olney:
4.0% (60)
Texas:
9.5% (1,054,577)
Number of households with income $125k - 150k:
Olney:
9.5% (142)
Texas:
6.7% (741,518)
Number of households with income $150k - 200k:
Olney:
5.0% (74)
State:
8.7% (961,776)
Number of households with income > $200k:
Olney:
4.7% (70)
Texas:
10.7% (1,181,544)
Aggregate household income in Olney in 2022: $99,349,587
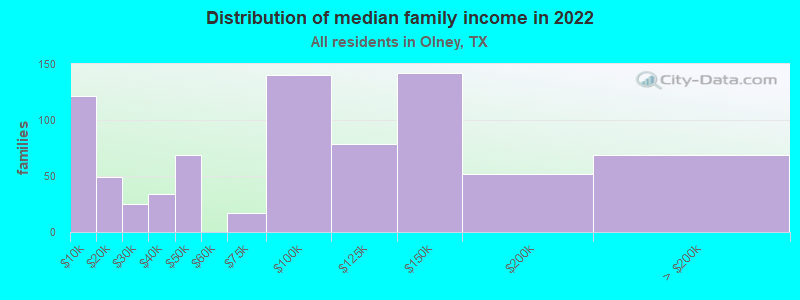
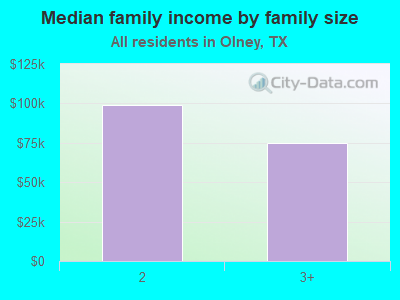
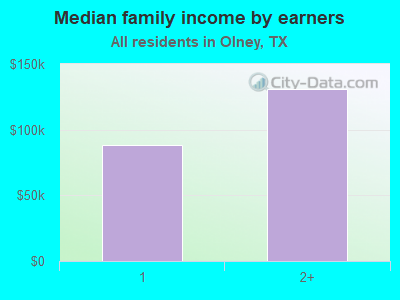
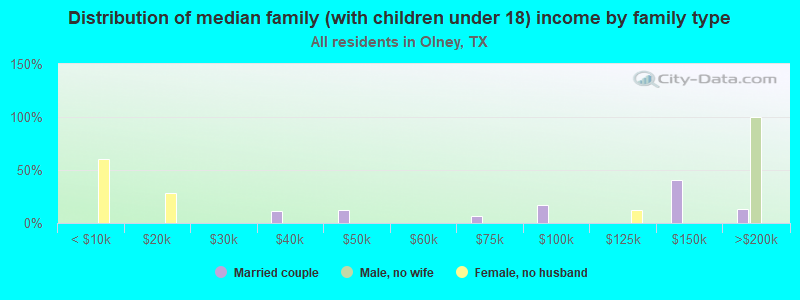
Median family income in Olney in 2022:
Olney:
$86,760
State:
$86,267
Number of families with income < $10k:
Olney:
15.2% (121)
State:
4.0% (297,884)
Number of families with income $10k - 20k:
Olney:
6.2% (49)
Texas:
4.3% (324,514)
Number of families with income $20k - 30k:
Olney:
3.1% (25)
State:
5.8% (430,949)
Number of families with income $30k - 40k:
Olney:
4.2% (34)
Texas:
6.6% (493,535)
Number of families with income $40k - 50k:
Olney:
8.6% (69)
State:
6.7% (499,663)
Number of families with income $60k - 75k:
Olney:
2.1% (17)
Texas:
9.5% (710,229)
Number of families with income $75k - 100k:
Olney:
17.6% (140)
State:
13.6% (1,015,480)
Number of families with income $100k - 125k:
Olney:
9.9% (79)
State:
10.7% (797,961)
Number of families with income $125k - 150k:
Olney:
17.7% (142)
State:
8.1% (602,985)
Number of families with income $150k - 200k:
Olney:
6.6% (52)
Texas:
10.7% (804,459)
Number of families with income > $200k:
Olney:
8.7% (69)
State:
13.5% (1,013,514)
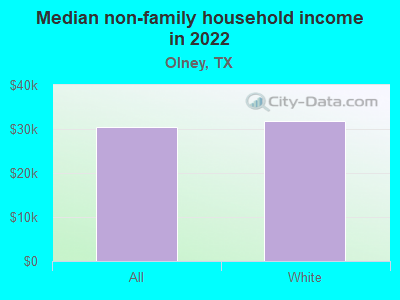
Median non-family income in Olney in 2022:
Olney:
$30,487
State:
$45,999
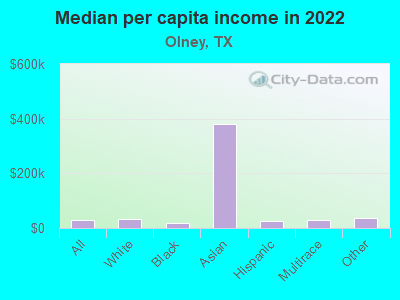
Median per capita income in Olney in 2022:
Olney:
$31,016
State:
$38,123
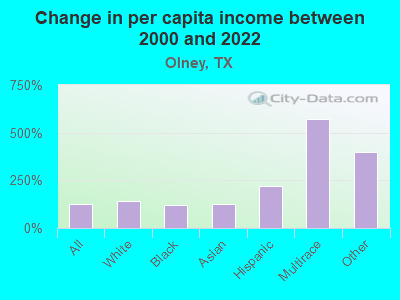
Change in median per capita income between 2000 and 2022:
Olney, Texas:
+126.0%
State:
+94.3%
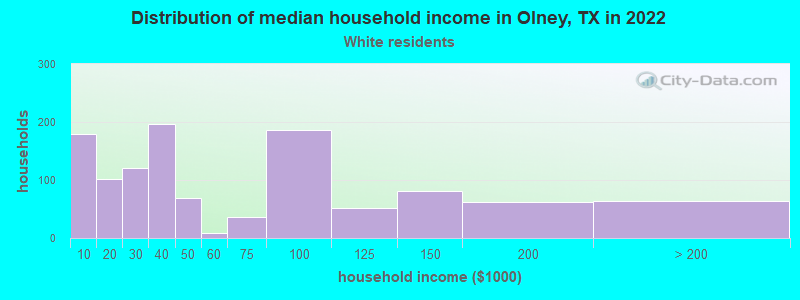
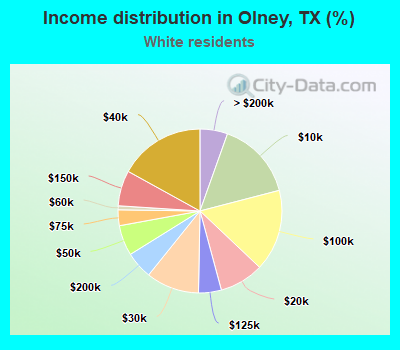
Income statistics for White residents
Median household income in Olney, TX in 2022:
Olney:
$39,459
Texas:
$82,032
Change in median household income between 2000 and 2022:
Olney, Texas:
+76.7%
State:
+91.0%
Number of households with income < $10k:
Olney:
15.5% (179)
State:
4.7% (273,716)
Number of households with income $10k - 20k:
Olney:
8.7% (101)
State:
5.5% (322,702)
Number of households with income $20k - 30k:
Olney:
10.5% (121)
Texas:
6.2% (363,947)
Number of households with income $30k - 40k:
Olney:
17.0% (196)
State:
6.8% (399,275)
Number of households with income $40k - 50k:
Olney:
6.0% (69)
Texas:
6.5% (383,417)
Number of households with income $50k - 60k:
Olney:
0.8% (9)
State:
6.6% (388,535)
Number of households with income $60k - 75k:
Olney:
3.1% (36)
State:
9.7% (566,295)
Number of households with income $75k - 100k:
Olney:
16.1% (186)
State:
13.0% (760,276)
Number of households with income $100k - 125k:
Olney:
4.5% (52)
State:
10.2% (597,596)
Number of households with income $125k - 150k:
Olney:
7.0% (81)
State:
7.4% (436,830)
Number of households with income $150k - 200k:
Olney:
5.4% (62)
Texas:
9.9% (583,067)
Number of households with income > $200k:
Olney:
5.5% (63)
State:
13.5% (792,647)
Aggregate household income in Olney in 2022: $79,560,632
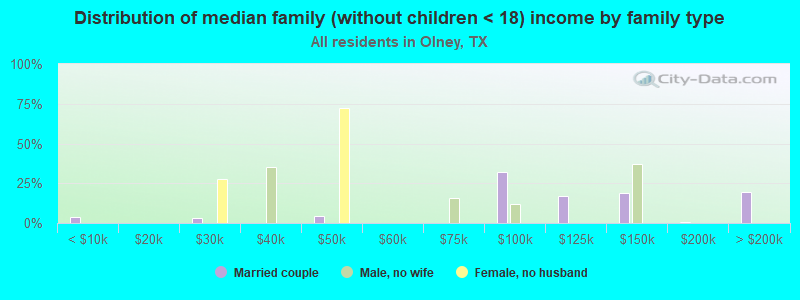
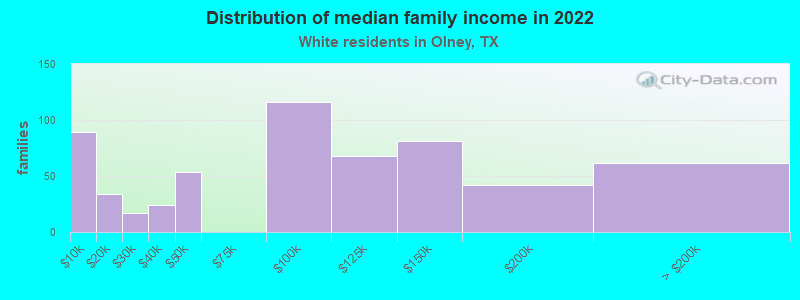
Median family income in Olney in 2022:
Olney:
$88,671
State:
$101,788
Number of families with income < $10k:
Olney:
15.2% (89)
State:
2.8% (108,142)
Number of families with income $10k - 20k:
Olney:
5.8% (34)
State:
2.9% (113,421)
Number of families with income $20k - 30k:
Olney:
2.9% (17)
State:
4.1% (157,688)
Number of families with income $30k - 40k:
Olney:
4.1% (24)
State:
5.2% (198,847)
Number of families with income $40k - 50k:
Olney:
9.1% (54)
State:
5.6% (216,490)
Number of families with income $75k - 100k:
Olney:
19.7% (116)
State:
13.7% (527,363)
Number of families with income $100k - 125k:
Olney:
11.5% (68)
State:
11.6% (448,411)
Number of families with income $125k - 150k:
Olney:
13.8% (81)
State:
9.2% (355,798)
Number of families with income $150k - 200k:
Olney:
7.2% (42)
Texas:
12.5% (480,185)
Number of families with income > $200k:
Olney:
10.6% (62)
State:
17.6% (677,490)
Median non-family income in Olney in 2022:
Olney:
$31,891
State:
$50,587
Median per capita income in Olney in 2022:
Olney:
$34,571
State:
$47,740
Change in median per capita income between 2000 and 2022:
Olney, Texas:
+143.1%
State:
+114.3%
Income statistics for Black or African American residents
Median per capita income in Olney in 2022:
Olney:
$17,197
Texas:
$30,490
Change in median per capita income between 2000 and 2022:
Olney, Texas:
+119.2%
State:
+113.9%
Income statistics for Asian residents
Number of households with income < $10k:
Olney:
0.0% (0)
Texas:
5.2% (29,885)
Number of households with income $10k - 20k:
Olney:
0.0% (0)
State:
4.7% (27,044)
Number of households with income $20k - 30k:
Olney:
0.0% (0)
State:
4.1% (23,363)
Number of households with income $30k - 40k:
Olney:
0.0% (0)
State:
4.1% (23,309)
Number of households with income $40k - 50k:
Olney:
0.0% (0)
State:
5.2% (29,826)
Number of households with income $50k - 60k:
Olney:
0.0% (0)
Texas:
4.7% (26,512)
Number of households with income $60k - 75k:
Olney:
0.0% (0)
State:
6.5% (36,905)
Number of households with income $75k - 100k:
Olney:
0.0% (0)
State:
11.3% (64,350)
Number of households with income $100k - 125k:
Olney:
0.0% (0)
Texas:
11.4% (64,714)
Number of households with income $125k - 150k:
Olney:
100.0% (36)
State:
9.3% (52,719)
Number of households with income $150k - 200k:
Olney:
0.0% (0)
State:
12.5% (70,953)
Number of households with income > $200k:
Olney:
0.0% (0)
State:
21.1% (120,260)
Aggregate household income in Olney in 2022: $32,807,161
Median per capita income in Olney in 2022:
Olney:
$381,824
Texas:
$48,626
Change in median per capita income between 2000 and 2022:
Olney, Texas:
+127.1%
State:
+132.0%
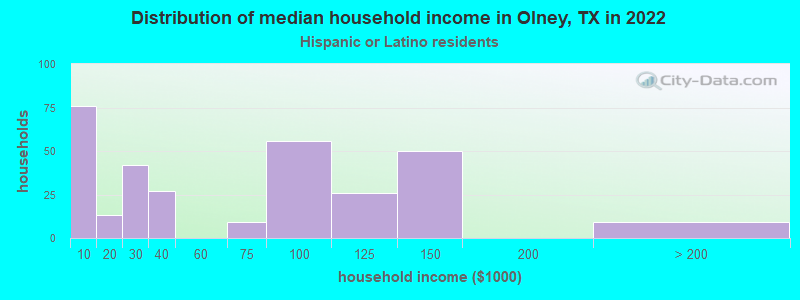
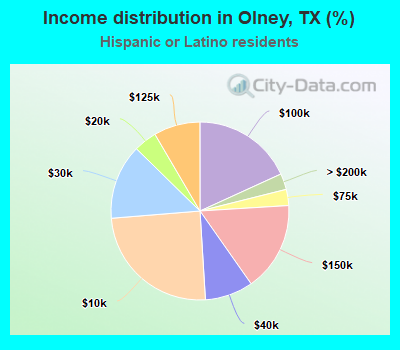
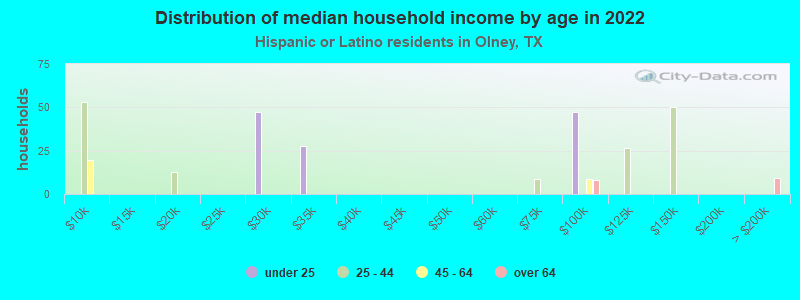
Income statistics for Hispanic or Latino residents
Number of households with income < $10k:
Olney:
24.7% (76)
Texas:
5.8% (213,953)
Number of households with income $10k - 20k:
Olney:
4.2% (13)
State:
8.0% (297,456)
Number of households with income $20k - 30k:
Olney:
13.6% (42)
State:
9.2% (340,166)
Number of households with income $30k - 40k:
Olney:
8.8% (27)
State:
9.5% (354,336)
Number of households with income $40k - 50k:
Olney:
0.0% (0)
State:
8.8% (327,013)
Number of households with income $50k - 60k:
Olney:
0.0% (0)
State:
8.3% (308,818)
Number of households with income $60k - 75k:
Olney:
2.9% (9)
State:
10.9% (405,109)
Number of households with income $75k - 100k:
Olney:
18.2% (56)
State:
13.8% (511,639)
Number of households with income $100k - 125k:
Olney:
8.4% (26)
Texas:
8.6% (319,728)
Number of households with income $125k - 150k:
Olney:
16.2% (50)
State:
5.7% (210,932)
Number of households with income $150k - 200k:
Olney:
0.0% (0)
State:
6.4% (236,055)
Number of households with income > $200k:
Olney:
2.9% (9)
State:
5.1% (189,259)
Aggregate household income in Olney in 2022: $20,218,261
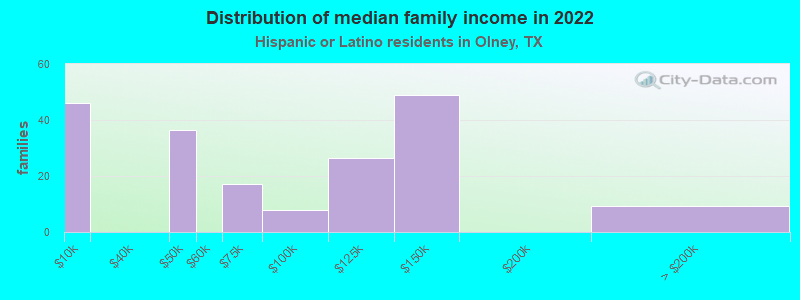
Median family income in Olney in 2022:
Olney:
$80,218
State:
$65,080
Number of families with income < $10k:
Olney:
24.0% (46)
State:
5.3% (147,493)
Number of families with income $40k - 50k:
Olney:
18.9% (36)
State:
8.6% (240,188)
Number of families with income $60k - 75k:
Olney:
9.0% (17)
Texas:
10.9% (302,688)
Number of families with income $75k - 100k:
Olney:
4.0% (8)
State:
14.3% (398,554)
Number of families with income $100k - 125k:
Olney:
13.8% (26)
Texas:
9.5% (264,007)
Number of families with income $125k - 150k:
Olney:
25.5% (49)
Texas:
6.2% (171,274)
Number of families with income > $200k:
Olney:
4.8% (9)
Texas:
5.9% (165,129)
Median per capita income in Olney in 2022:
Olney:
$25,428
Texas:
$24,862
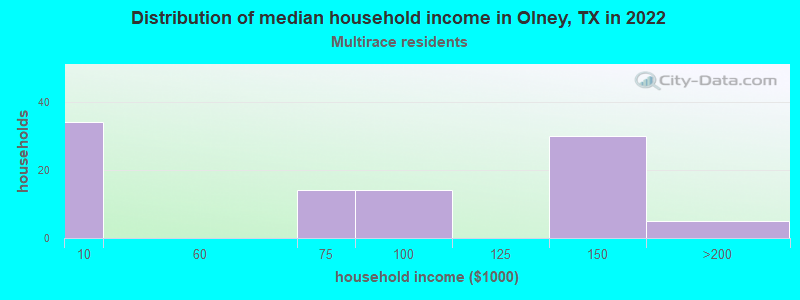
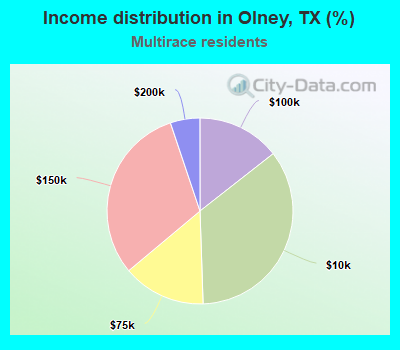
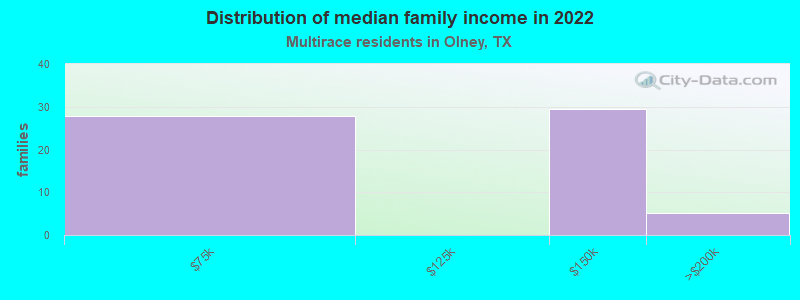
Income statistics for Multirace residents
Number of households with income < $10k:
Olney:
35.1% (34)
State:
5.5% (122,324)
Number of households with income $10k - 20k:
Olney:
0.0% (0)
State:
8.2% (182,232)
Number of households with income $20k - 30k:
Olney:
0.0% (0)
State:
8.5% (189,456)
Number of households with income $30k - 40k:
Olney:
0.0% (0)
State:
8.9% (197,499)
Number of households with income $40k - 50k:
Olney:
0.0% (0)
State:
8.7% (191,735)
Number of households with income $50k - 60k:
Olney:
0.0% (0)
State:
8.0% (177,535)
Number of households with income $60k - 75k:
Olney:
14.4% (14)
State:
10.5% (232,479)
Number of households with income $75k - 100k:
Olney:
14.4% (14)
Texas:
13.1% (290,448)
Number of households with income $100k - 125k:
Olney:
0.0% (0)
Texas:
8.6% (191,595)
Number of households with income $125k - 150k:
Olney:
30.9% (30)
Texas:
6.0% (133,361)
Number of households with income $150k - 200k:
Olney:
5.2% (5)
Texas:
7.2% (159,195)
Number of households with income > $200k:
Olney:
0.0% (0)
State:
6.7% (148,064)
Aggregate household income in Olney in 2022: $6,926,739
Median family income in Olney in 2022:
Olney:
$126,838
State:
$69,780
Number of families with income $60k - 75k:
Olney:
44.5% (28)
State:
10.5% (169,549)
Number of families with income $125k - 150k:
Olney:
47.2% (29)
State:
6.7% (107,900)
Number of families with income $150k - 200k:
Olney:
8.3% (5)
State:
8.5% (137,607)
Median per capita income in Olney in 2022:
Olney:
$29,438
Texas:
$26,785
Income statistics for other residents
Median per capita income in Olney in 2022:
Olney:
$35,543
State:
$23,899
Discuss Olney, Texas (TX) on our hugely popular Texas forum.