Orange, New Hampshire (NH) income map, earnings map, and wages data
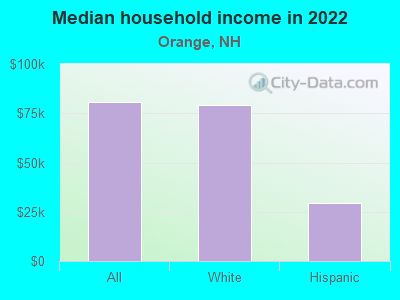
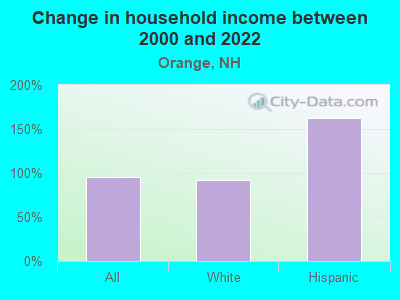
The median household income in Orange, NH in 2022 was $80,652, which was 11.6% less than the median annual income of $89,992 across the entire state of New Hampshire. Compared to the median income of $41,250 in 2000 this represents an increase of 48.9%. The per capita income in 2022 was $39,694, which means an increase of 56.0% compared to 2000 when it was $17,456.
Income statistics for all residents
Median household income in Orange, NH in 2022:| Orange: | $80,653 |
| State: | $89,992 |
Change in median household income between 2000 and 2022:| Orange, New Hampshire: | +95.5% |
| New Hampshire: | +81.9% |
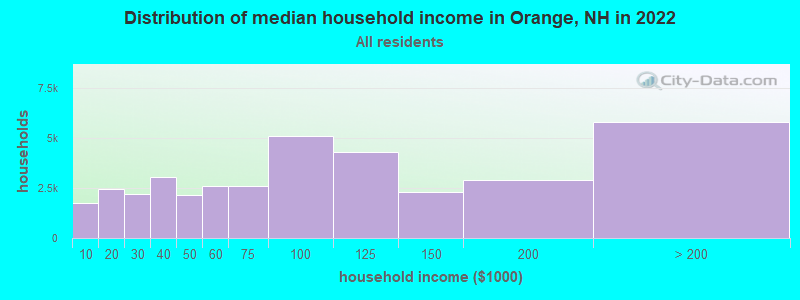
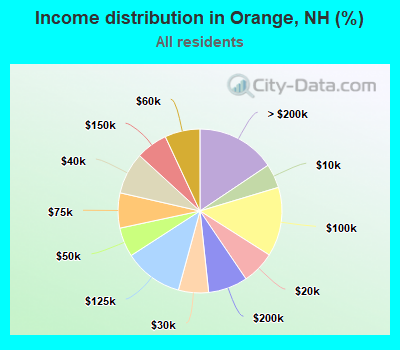
Number of households with income < $10k:| Orange: | 4.8% (1,772) |
| State: | 3.1% (17,541) |
Number of households with income $10k - 20k:| Orange: | 6.5% (2,432) |
| State: | 5.4% (29,916) |
Number of households with income $20k - 30k:| Orange: | 5.9% (2,210) |
| New Hampshire: | 5.5% (30,783) |
Number of households with income $30k - 40k:| Orange: | 8.3% (3,070) |
| New Hampshire: | 5.9% (32,868) |
Number of households with income $40k - 50k:| Orange: | 5.8% (2,147) |
| State: | 5.9% (32,728) |
Number of households with income $50k - 60k:| Orange: | 6.9% (2,582) |
| State: | 6.9% (38,422) |
Number of households with income $60k - 75k:| Orange: | 6.9% (2,576) |
| State: | 9.1% (50,552) |
Number of households with income $75k - 100k:| Orange: | 13.6% (5,077) |
| New Hampshire: | 13.1% (73,145) |
Number of households with income $100k - 125k:| Orange: | 11.6% (4,324) |
| State: | 10.5% (58,593) |
Number of households with income $125k - 150k:| Orange: | 6.2% (2,320) |
| State: | 8.1% (44,878) |
Number of households with income $150k - 200k:| Orange: | 7.8% (2,892) |
| State: | 11.5% (64,340) |
Number of households with income > $200k:| Orange: | 15.6% (5,801) |
| New Hampshire: | 15.0% (83,454) |
Aggregate household income in Orange in 2022: $14,609,804
Median family income in Orange in 2022:| Orange: | $82,081 |
| State: | $112,950 |
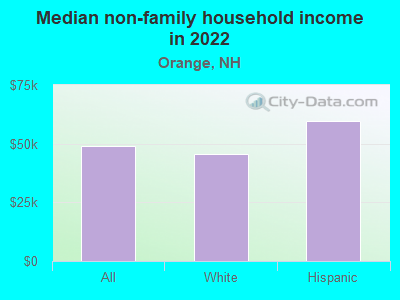
Median non-family income in Orange in 2022:| Orange: | $49,070 |
| State: | $52,292 |
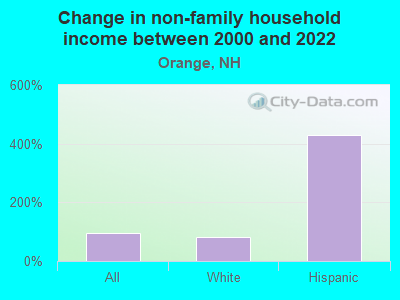
Change in median non-family income between 2000 and 2022:| Orange, New Hampshire: | +96.3% |
| New Hampshire: | +80.7% |
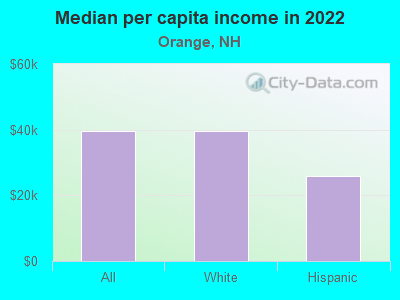
Median per capita income in Orange in 2022:| Orange: | $39,695 |
| State: | $49,281 |
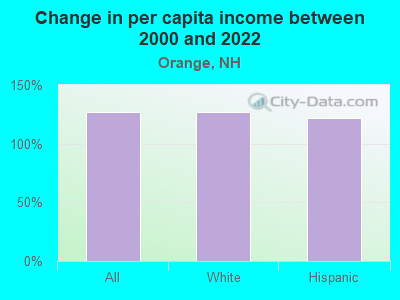
Change in median per capita income between 2000 and 2022:| Orange, New Hampshire: | +127.4% |
| State: | +106.7% |
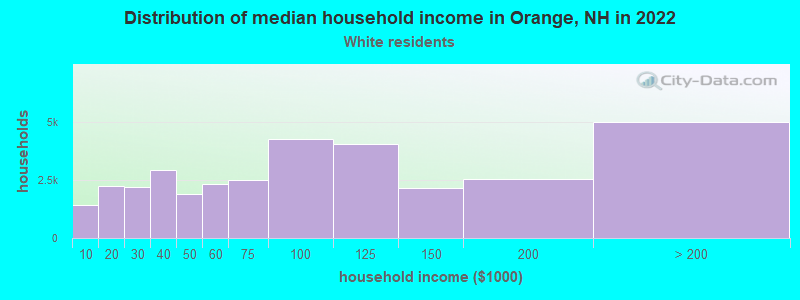
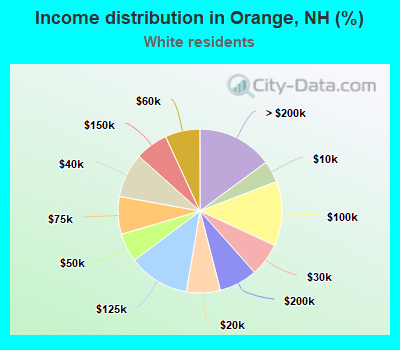
Income statistics for White residents
Median household income in Orange, NH in 2022:| Orange: | $79,024 |
| State: | $90,839 |
Change in median household income between 2000 and 2022:| Orange, New Hampshire: | +91.6% |
| State: | +82.8% |
Number of households with income < $10k:| Orange: | 4.3% (1,432) |
| New Hampshire: | 3.1% (15,499) |
Number of households with income $10k - 20k:| Orange: | 6.7% (2,231) |
| State: | 5.6% (27,915) |
Number of households with income $20k - 30k:| Orange: | 6.6% (2,202) |
| New Hampshire: | 5.4% (27,382) |
Number of households with income $30k - 40k:| Orange: | 8.8% (2,941) |
| State: | 5.9% (29,681) |
Number of households with income $40k - 50k:| Orange: | 5.7% (1,903) |
| State: | 5.7% (28,456) |
Number of households with income $50k - 60k:| Orange: | 6.9% (2,302) |
| New Hampshire: | 6.9% (34,641) |
Number of households with income $60k - 75k:| Orange: | 7.4% (2,481) |
| State: | 9.0% (45,144) |
Number of households with income $75k - 100k:| Orange: | 12.7% (4,248) |
| New Hampshire: | 13.0% (65,259) |
Number of households with income $100k - 125k:| Orange: | 12.1% (4,040) |
| State: | 10.7% (53,931) |
Number of households with income $125k - 150k:| Orange: | 6.5% (2,166) |
| New Hampshire: | 8.1% (40,466) |
Number of households with income $150k - 200k:| Orange: | 7.6% (2,528) |
| State: | 11.9% (59,781) |
Number of households with income > $200k:| Orange: | 14.9% (4,984) |
| New Hampshire: | 14.8% (74,387) |
Aggregate household income in Orange in 2022: $13,425,884
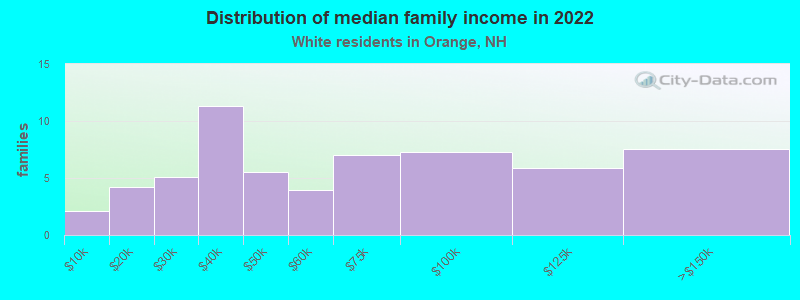
Median family income in Orange in 2022:| Orange: | $80,562 |
| State: | $115,125 |
Number of families with income < $10k:| Orange: | 3.6% (2) |
| State: | 1.5% (4,767) |
Number of families with income $10k - 20k:| Orange: | 7.0% (4) |
| State: | 2.1% (6,602) |
Number of families with income $20k - 30k:| Orange: | 8.5% (5) |
| State: | 2.7% (8,511) |
Number of families with income $30k - 40k:| Orange: | 18.9% (11) |
| New Hampshire: | 4.0% (12,696) |
Number of families with income $40k - 50k:| Orange: | 9.2% (5) |
| State: | 4.3% (13,626) |
Number of families with income $50k - 60k:| Orange: | 6.6% (4) |
| New Hampshire: | 5.6% (17,792) |
Number of families with income $60k - 75k:| Orange: | 11.7% (7) |
| State: | 8.4% (26,945) |
Number of families with income $75k - 100k:| Orange: | 12.2% (7) |
| New Hampshire: | 13.8% (44,284) |
Number of families with income $100k - 125k:| Orange: | 9.9% (6) |
| State: | 12.5% (39,959) |
Number of families with income $125k - 150k:| Orange: | 12.5% (8) |
| State: | 10.3% (33,038) |
Median non-family income in Orange in 2022:| Orange: | $45,653 |
| State: | $51,861 |
Change in median non-family income between 2000 and 2022:| Orange, New Hampshire: | +82.6% |
| State: | +79.2% |
Median per capita income in Orange in 2022:| Orange: | $39,708 |
| State: | $50,469 |
Change in median per capita income between 2000 and 2022:| Orange, New Hampshire: | +127.5% |
| State: | +109.2% |
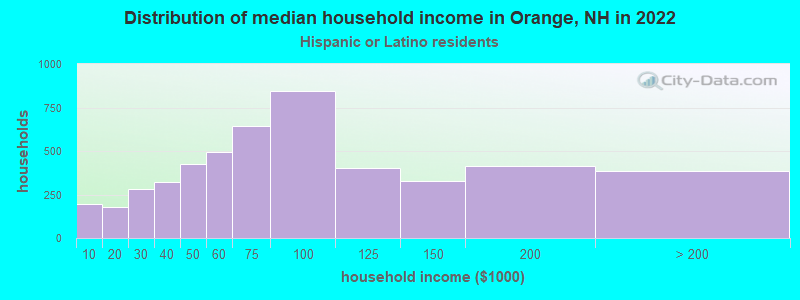
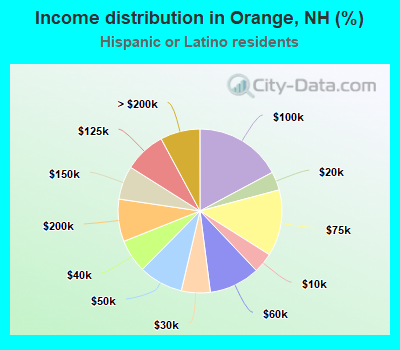
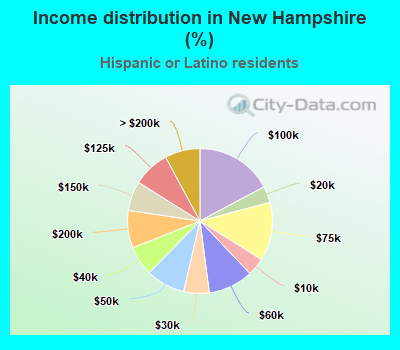
Income statistics for Hispanic or Latino residents
Median household income in Orange, NH in 2022:| Orange: | $29,597 |
| State: | $73,813 |
Number of households with income < $10k:| Orange: | 4.0% (196) |
| New Hampshire: | 4.0% (695) |
Number of households with income $10k - 20k:| Orange: | 3.7% (180) |
| State: | 3.7% (639) |
Number of households with income $20k - 30k:| Orange: | 5.7% (280) |
| State: | 5.7% (998) |
Number of households with income $30k - 40k:| Orange: | 6.6% (323) |
| State: | 6.6% (1,151) |
Number of households with income $40k - 50k:| Orange: | 8.7% (428) |
| State: | 8.7% (1,521) |
Number of households with income $50k - 60k:| Orange: | 10.0% (493) |
| State: | 10.0% (1,751) |
Number of households with income $60k - 75k:| Orange: | 13.1% (643) |
| New Hampshire: | 13.1% (2,284) |
Number of households with income $75k - 100k:| Orange: | 17.2% (845) |
| State: | 17.2% (3,004) |
Number of households with income $100k - 125k:| Orange: | 8.2% (402) |
| State: | 8.2% (1,430) |
Number of households with income $125k - 150k:| Orange: | 6.6% (325) |
| State: | 6.6% (1,154) |
Number of households with income $150k - 200k:| Orange: | 8.4% (411) |
| New Hampshire: | 8.4% (1,462) |
Number of households with income > $200k:| Orange: | 7.9% (386) |
| New Hampshire: | 7.9% (1,371) |
Aggregate household income in Orange in 2022: $221,433
Median non-family income in Orange in 2022:| Orange: | $59,603 |
| State: | $69,407 |
Median per capita income in Orange in 2022:| Orange: | $25,907 |
| State: | $32,911 |
Change in median per capita income between 2000 and 2022:| Orange, New Hampshire: | +122.1% |
| New Hampshire: | +127.3% |