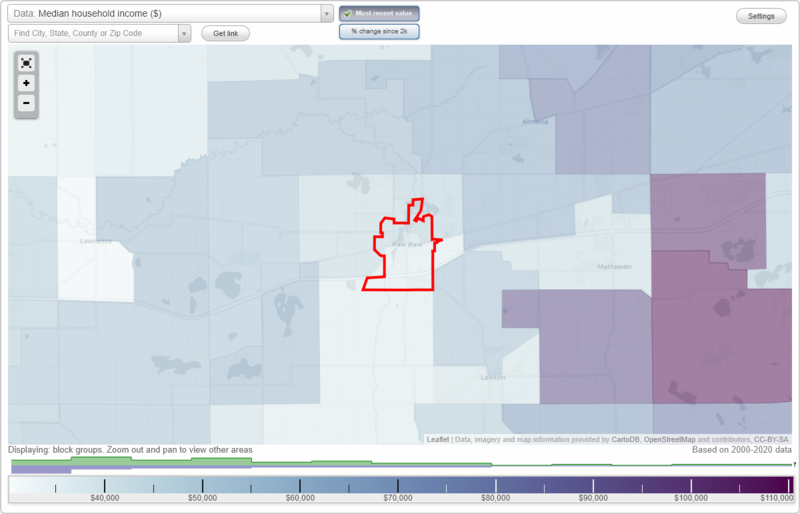
The median household income in Paw Paw, MI in 2022 was $42,719, which was 56.8% less than the median annual income of $66,986 across the entire state of Michigan. Compared to the median income of $38,750 in 2000 this represents an increase of 9.3%. The per capita income in 2022 was $24,720, which means an increase of 11.6% compared to 2000 when it was $21,859.
Whole page based on the data from 2000 / 2022 when the population of Paw Paw, Michigan was 3,363 / 3,320
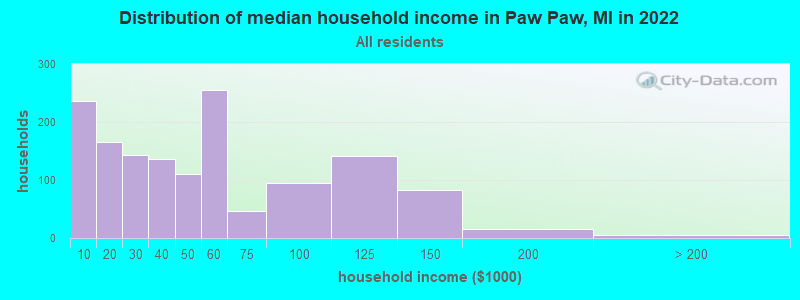
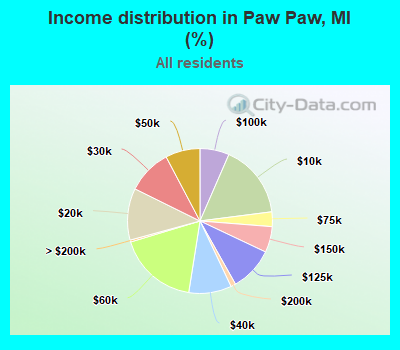
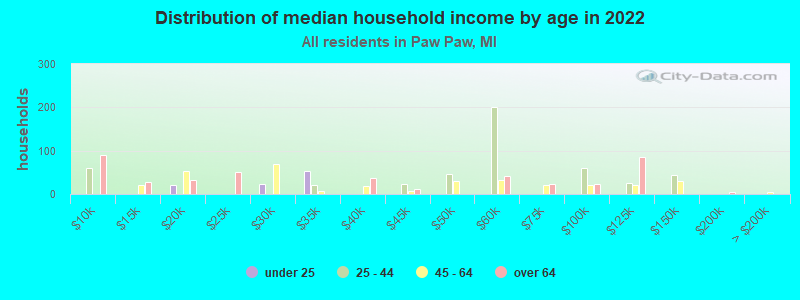
Income statistics for all residents
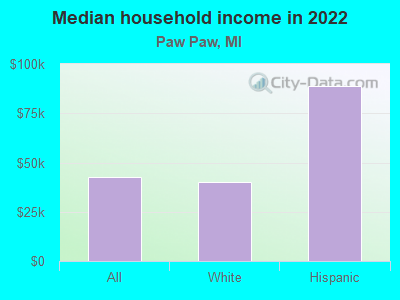
Median household income in Paw Paw, MI in 2022:
Paw Paw:
$42,719
State:
$66,986
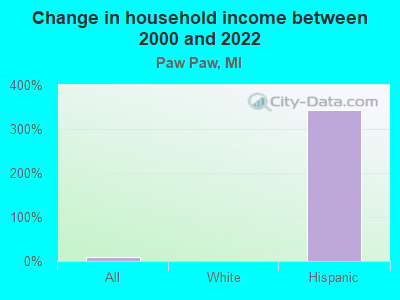
Change in median household income between 2000 and 2022:
Paw Paw, Michigan:
+10.2%
State:
+50.0%
Number of households with income < $10k:
Paw Paw:
16.4% (236)
State:
5.7% (231,223)
Number of households with income $10k - 20k:
Paw Paw:
11.6% (166)
State:
7.5% (306,955)
Number of households with income $20k - 30k:
Paw Paw:
10.0% (143)
Michigan:
7.9% (324,153)
Number of households with income $30k - 40k:
Paw Paw:
9.5% (137)
State:
8.3% (341,408)
Number of households with income $40k - 50k:
Paw Paw:
7.7% (111)
State:
7.9% (322,255)
Number of households with income $50k - 60k:
Paw Paw:
17.8% (256)
Michigan:
7.5% (305,914)
Number of households with income $60k - 75k:
Paw Paw:
3.3% (47)
State:
10.1% (414,440)
Number of households with income $75k - 100k:
Paw Paw:
6.5% (94)
Michigan:
13.2% (538,299)
Number of households with income $100k - 125k:
Paw Paw:
9.8% (141)
Michigan:
9.7% (396,282)
Number of households with income $125k - 150k:
Paw Paw:
5.8% (83)
Michigan:
6.7% (273,144)
Number of households with income $150k - 200k:
Paw Paw:
1.1% (16)
State:
7.5% (305,077)
Number of households with income > $200k:
Paw Paw:
0.4% (6)
State:
8.1% (330,644)
Aggregate household income in Paw Paw in 2022: $78,550,073
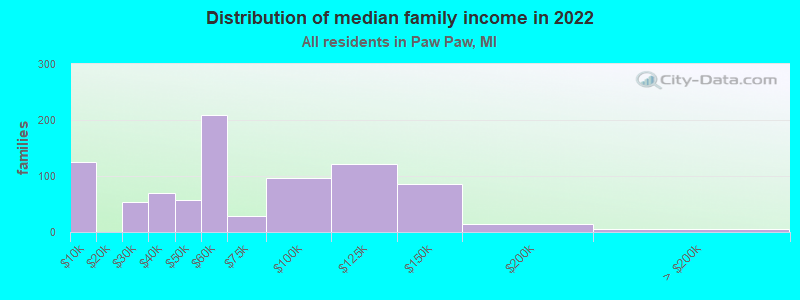
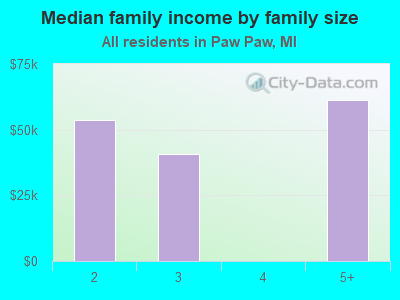
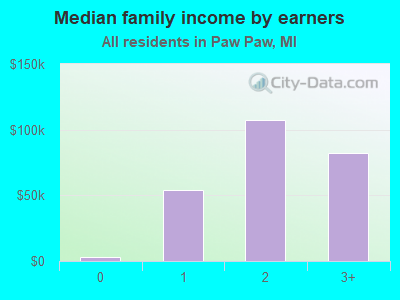
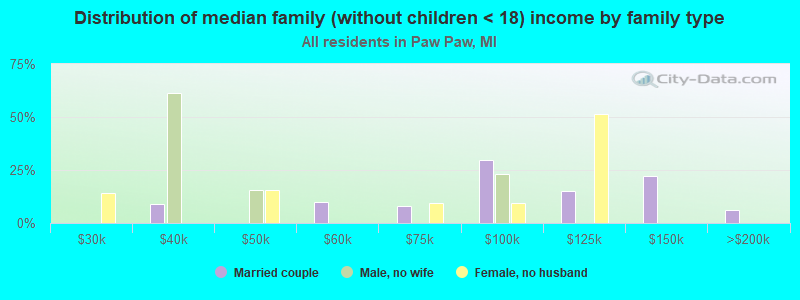
Median family income in Paw Paw in 2022:
Paw Paw:
$53,611
Michigan:
$85,865
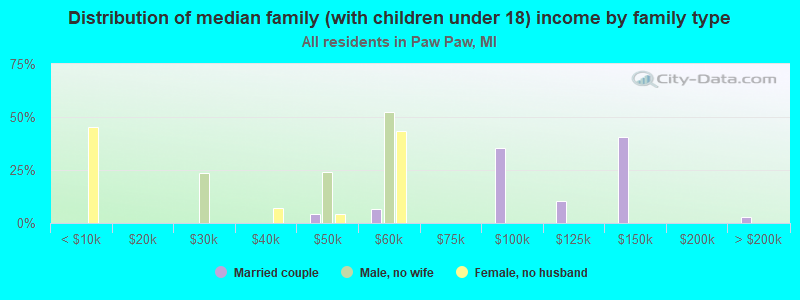
Number of families with income < $10k:
Paw Paw:
14.4% (125)
State:
3.5% (89,010)
Number of families with income $20k - 30k:
Paw Paw:
6.2% (54)
State:
5.0% (127,320)
Number of families with income $30k - 40k:
Paw Paw:
8.0% (70)
Michigan:
6.4% (163,565)
Number of families with income $40k - 50k:
Paw Paw:
6.6% (57)
State:
6.8% (172,384)
Number of families with income $50k - 60k:
Paw Paw:
24.1% (209)
State:
7.1% (179,870)
Number of families with income $60k - 75k:
Paw Paw:
3.2% (28)
State:
10.3% (263,723)
Number of families with income $75k - 100k:
Paw Paw:
11.2% (97)
State:
15.0% (383,364)
Number of families with income $100k - 125k:
Paw Paw:
14.0% (121)
State:
11.8% (301,751)
Number of families with income $125k - 150k:
Paw Paw:
9.8% (85)
State:
8.6% (220,338)
Number of families with income $150k - 200k:
Paw Paw:
1.7% (15)
State:
10.2% (259,462)
Number of families with income > $200k:
Paw Paw:
0.7% (6)
State:
11.3% (287,206)
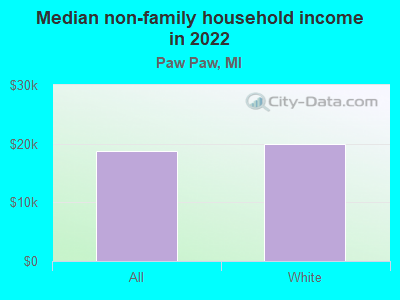
Median non-family income in Paw Paw in 2022:
Paw Paw:
$18,834
State:
$40,459
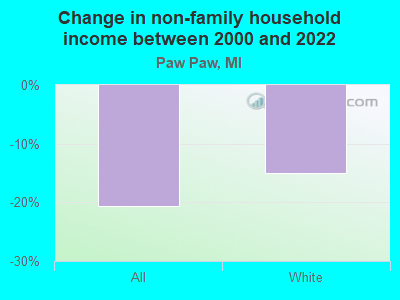
Change in median non-family income between 2000 and 2022:: -20.6%
Paw Paw, Michigan:
-20.6%
State:
+54.5%
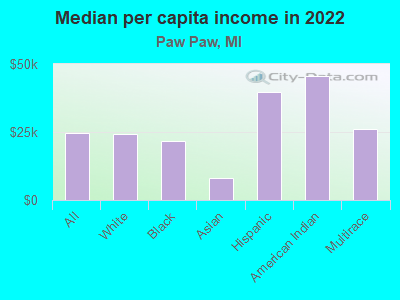
Median per capita income in Paw Paw in 2022:
Paw Paw:
$24,720
State:
$38,151
Change in median per capita income between 2000 and 2022:
Paw Paw, Michigan:
+13.1%
State:
+72.1%
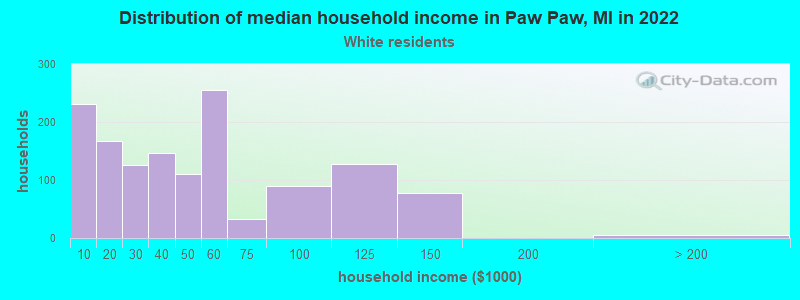
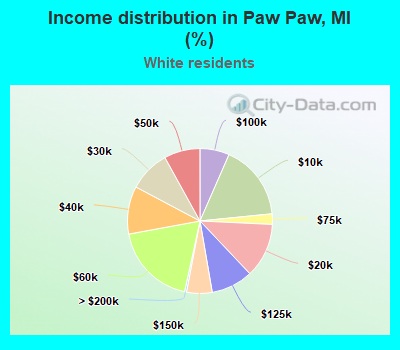
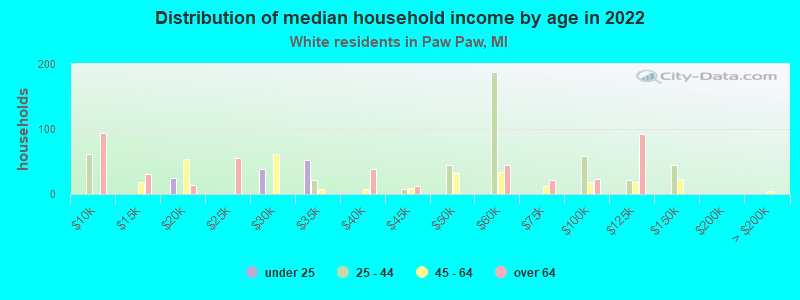
Income statistics for White residents
Median household income in Paw Paw, MI in 2022:
Paw Paw:
$40,322
State:
$71,609
Change in median household income between 2000 and 2022:: -0.0%
Paw Paw, Michigan:
-0.0%
State:
+52.9%
Number of households with income < $10k:
Paw Paw:
16.9% (231)
State:
4.4% (140,440)
Number of households with income $10k - 20k:
Paw Paw:
12.2% (167)
State:
6.5% (205,547)
Number of households with income $20k - 30k:
Paw Paw:
9.2% (126)
State:
7.6% (242,254)
Number of households with income $30k - 40k:
Paw Paw:
10.7% (146)
Michigan:
8.1% (257,175)
Number of households with income $40k - 50k:
Paw Paw:
8.0% (110)
State:
7.8% (246,839)
Number of households with income $50k - 60k:
Paw Paw:
18.7% (256)
State:
7.4% (233,723)
Number of households with income $60k - 75k:
Paw Paw:
2.3% (32)
State:
10.4% (328,664)
Number of households with income $75k - 100k:
Paw Paw:
6.6% (90)
Michigan:
13.6% (431,867)
Number of households with income $100k - 125k:
Paw Paw:
9.3% (128)
Michigan:
10.3% (325,164)
Number of households with income $125k - 150k:
Paw Paw:
5.7% (78)
State:
7.1% (226,232)
Number of households with income $150k - 200k:
Paw Paw:
0.0% (0)
Michigan:
8.1% (255,445)
Number of households with income > $200k:
Paw Paw:
0.4% (6)
State:
8.7% (276,727)
Aggregate household income in Paw Paw in 2022: $70,940,109
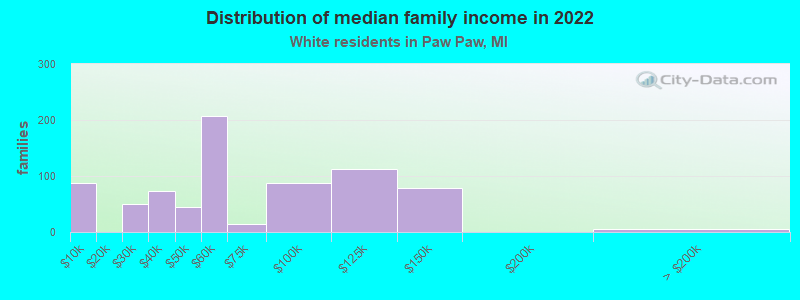
Median family income in Paw Paw in 2022:
Paw Paw:
$53,885
State:
$90,317
Number of families with income < $10k:
Paw Paw:
11.5% (87)
Michigan:
2.5% (49,508)
Number of families with income $20k - 30k:
Paw Paw:
6.6% (50)
Michigan:
4.6% (91,551)
Number of families with income $30k - 40k:
Paw Paw:
9.5% (73)
State:
5.9% (117,356)
Number of families with income $40k - 50k:
Paw Paw:
5.8% (44)
Michigan:
6.4% (127,491)
Number of families with income $50k - 60k:
Paw Paw:
27.2% (207)
Michigan:
6.8% (135,883)
Number of families with income $60k - 75k:
Paw Paw:
2.0% (15)
State:
10.5% (209,130)
Number of families with income $75k - 100k:
Paw Paw:
11.6% (88)
Michigan:
15.5% (309,815)
Number of families with income $100k - 125k:
Paw Paw:
14.7% (112)
State:
12.4% (248,235)
Number of families with income $125k - 150k:
Paw Paw:
10.4% (79)
Michigan:
9.2% (182,895)
Number of families with income > $200k:
Paw Paw:
0.7% (6)
Michigan:
12.0% (239,713)
Median non-family income in Paw Paw in 2022:
Paw Paw:
$19,876
Michigan:
$42,438
Change in median non-family income between 2000 and 2022:: -15.1%
Paw Paw, Michigan:
-15.1%
State:
+56.8%
Median per capita income in Paw Paw in 2022:
Paw Paw:
$24,131
State:
$41,514
Change in median per capita income between 2000 and 2022:
Paw Paw, Michigan:
+7.8%
Michigan:
+75.2%
Income statistics for Black or African American residents
Median per capita income in Paw Paw in 2022:
Paw Paw:
$21,571
Michigan:
$25,207
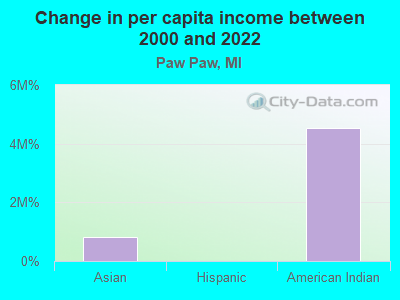
Change in median per capita income between 2000 and 2022:: -7.8%
Paw Paw, Michigan:
-7.8%
Michigan:
+60.4%
Income statistics for Asian residents
Median per capita income in Paw Paw in 2022:
Paw Paw:
$8,136
State:
$48,128
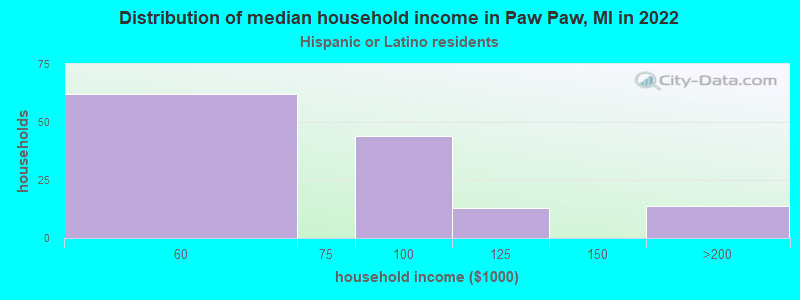
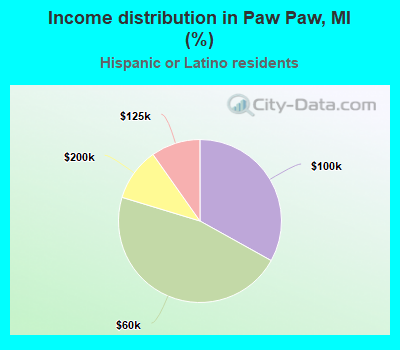
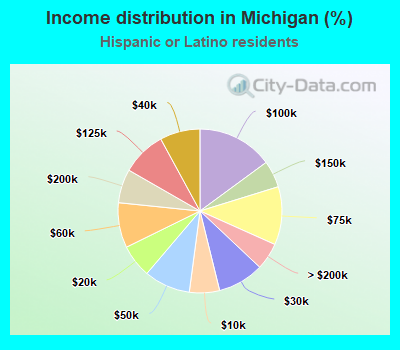
Income statistics for Hispanic or Latino residents
Median household income in Paw Paw, MI in 2022:
Paw Paw:
$88,678
Michigan:
$62,497
Number of households with income < $10k:
Paw Paw:
0.0% (0)
State:
6.0% (10,028)
Number of households with income $10k - 20k:
Paw Paw:
0.0% (0)
Michigan:
6.5% (10,959)
Number of households with income $20k - 30k:
Paw Paw:
0.0% (0)
State:
9.1% (15,369)
Number of households with income $30k - 40k:
Paw Paw:
0.0% (0)
State:
7.9% (13,373)
Number of households with income $40k - 50k:
Paw Paw:
0.0% (0)
State:
9.1% (15,369)
Number of households with income $50k - 60k:
Paw Paw:
46.6% (62)
State:
8.9% (14,990)
Number of households with income $60k - 75k:
Paw Paw:
0.0% (0)
State:
11.5% (19,325)
Number of households with income $75k - 100k:
Paw Paw:
33.1% (44)
Michigan:
14.9% (25,158)
Number of households with income $100k - 125k:
Paw Paw:
9.8% (13)
State:
8.8% (14,758)
Number of households with income $125k - 150k:
Paw Paw:
0.0% (0)
State:
5.3% (8,915)
Number of households with income $150k - 200k:
Paw Paw:
10.5% (14)
Michigan:
6.7% (11,249)
Number of households with income > $200k:
Paw Paw:
0.0% (0)
Michigan:
5.3% (8,978)
Aggregate household income in Paw Paw in 2022: $10,583,174
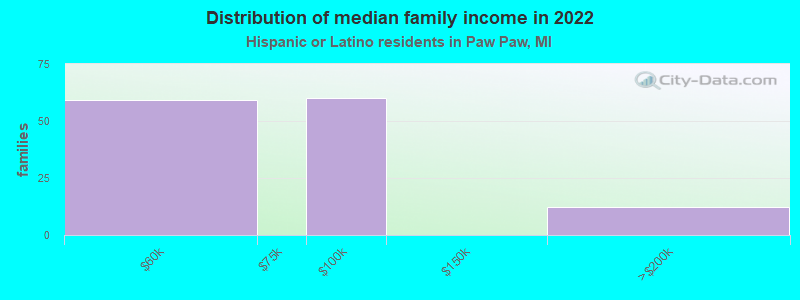
Median family income in Paw Paw in 2022:
Paw Paw:
$75,230
State:
$69,994
Number of families with income $50k - 60k:
Paw Paw:
44.9% (59)
Michigan:
9.1% (10,009)
Number of families with income $75k - 100k:
Paw Paw:
45.7% (60)
State:
16.4% (18,094)
Number of families with income $150k - 200k:
Paw Paw:
9.4% (12)
Michigan:
7.4% (8,182)
Median per capita income in Paw Paw in 2022:
Paw Paw:
$39,806
State:
$25,462
Income statistics for American Indian and Alaska Native residents
Aggregate household income in Paw Paw in 2022: $1,377,730
Median per capita income in Paw Paw in 2022:
Paw Paw:
$45,503
State:
$27,661
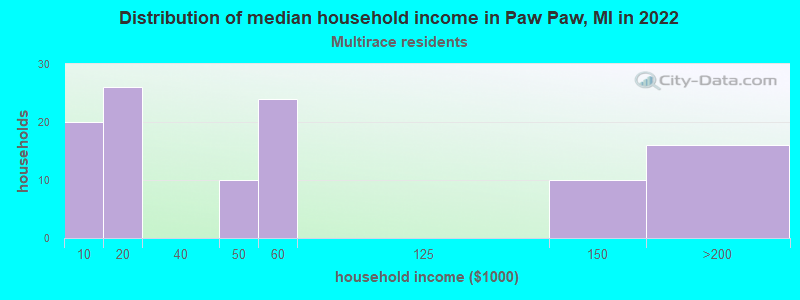
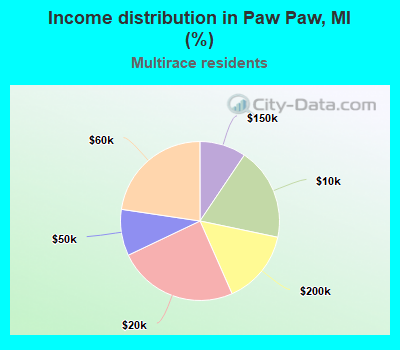
Income statistics for Multirace residents
Number of households with income < $10k:
Paw Paw:
18.9% (20)
State:
6.1% (12,463)
Number of households with income $10k - 20k:
Paw Paw:
24.5% (26)
Michigan:
8.7% (17,830)
Number of households with income $20k - 30k:
Paw Paw:
0.0% (0)
State:
7.6% (15,686)
Number of households with income $30k - 40k:
Paw Paw:
0.0% (0)
Michigan:
9.5% (19,444)
Number of households with income $40k - 50k:
Paw Paw:
9.4% (10)
State:
7.5% (15,476)
Number of households with income $50k - 60k:
Paw Paw:
22.6% (24)
Michigan:
8.1% (16,622)
Number of households with income $60k - 75k:
Paw Paw:
0.0% (0)
State:
10.6% (21,725)
Number of households with income $75k - 100k:
Paw Paw:
0.0% (0)
Michigan:
14.4% (29,501)
Number of households with income $100k - 125k:
Paw Paw:
0.0% (0)
State:
8.9% (18,231)
Number of households with income $125k - 150k:
Paw Paw:
9.4% (10)
Michigan:
5.8% (11,923)
Number of households with income $150k - 200k:
Paw Paw:
15.1% (16)
Michigan:
6.8% (13,956)
Number of households with income > $200k:
Paw Paw:
0.0% (0)
Michigan:
6.2% (12,672)
Aggregate household income in Paw Paw in 2022: $5,564,424
Median per capita income in Paw Paw in 2022:
Paw Paw:
$25,964
Michigan:
$26,098
Change in median per capita income between 2000 and 2022:
Paw Paw, Michigan:
+89.3%
Michigan:
+106.5%
Discuss Paw Paw, Michigan (MI) on our hugely popular Michigan forum.