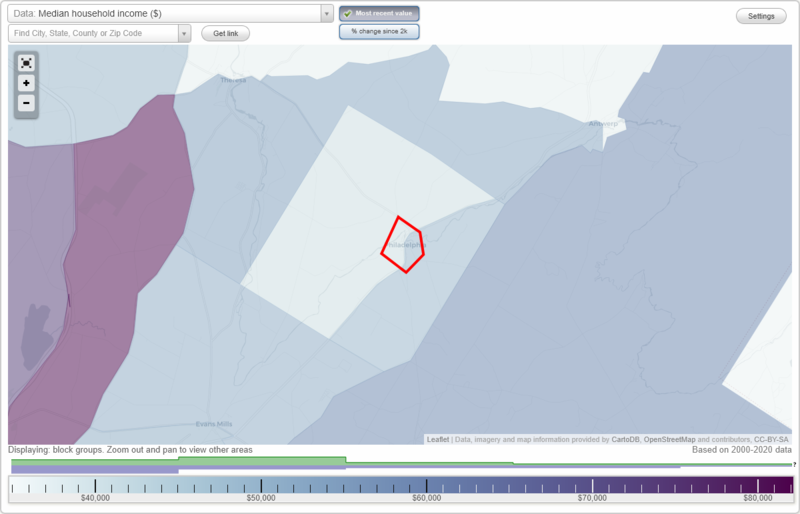
The median household income in Philadelphia, NY in 2022 was $35,049, which was 127.0% less than the median annual income of $79,557 across the entire state of New York. Compared to the median income of $27,083 in 2000 this represents an increase of 22.7%. The per capita income in 2022 was $21,788, which means an increase of 44.0% compared to 2000 when it was $12,210.
Whole page based on the data from 2000 / 2022 when the population of Philadelphia, New York was 1,519 / 909
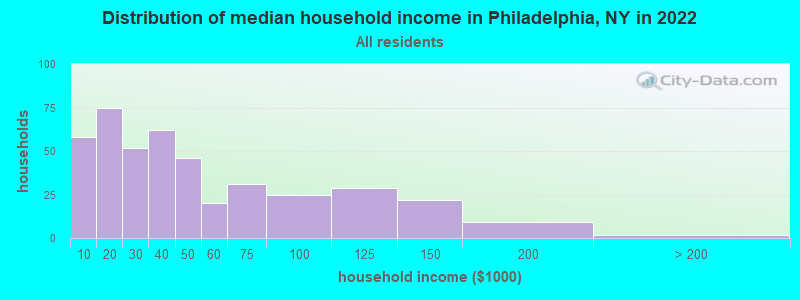
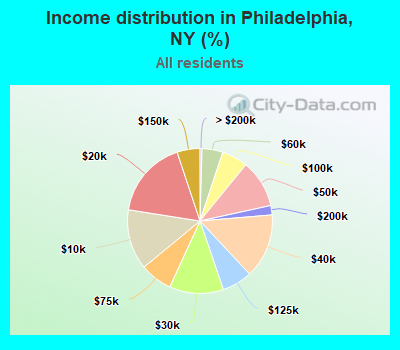
Income statistics for all residents
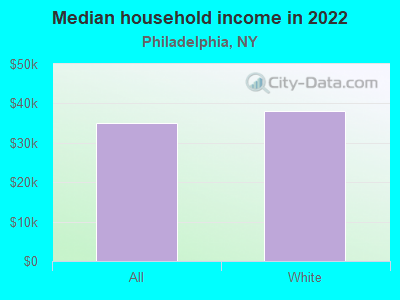
Median household income in Philadelphia, NY in 2022:
Philadelphia:
$35,050
State:
$79,557
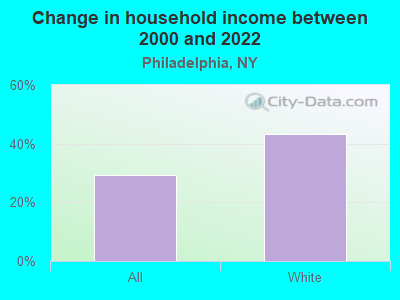
Change in median household income between 2000 and 2022:
Philadelphia, New York:
+29.4%
State:
+83.3%
Number of households with income < $10k:
Philadelphia:
13.5% (58)
State:
6.8% (527,598)
Number of households with income $10k - 20k:
Philadelphia:
17.4% (75)
State:
7.4% (574,940)
Number of households with income $20k - 30k:
Philadelphia:
12.1% (52)
State:
6.7% (517,718)
Number of households with income $30k - 40k:
Philadelphia:
14.4% (62)
State:
6.5% (506,674)
Number of households with income $40k - 50k:
Philadelphia:
10.7% (46)
State:
6.1% (470,439)
Number of households with income $50k - 60k:
Philadelphia:
4.6% (20)
State:
5.8% (454,042)
Number of households with income $60k - 75k:
Philadelphia:
7.2% (31)
State:
8.5% (657,508)
Number of households with income $75k - 100k:
Philadelphia:
5.8% (25)
New York:
11.6% (899,824)
Number of households with income $100k - 125k:
Philadelphia:
6.7% (29)
State:
9.3% (723,825)
Number of households with income $125k - 150k:
Philadelphia:
5.1% (22)
State:
7.1% (552,420)
Number of households with income $150k - 200k:
Philadelphia:
2.1% (9)
State:
9.4% (727,051)
Number of households with income > $200k:
Philadelphia:
0.5% (2)
New York:
15.0% (1,162,269)
Aggregate household income in Philadelphia in 2022: $19,814,885
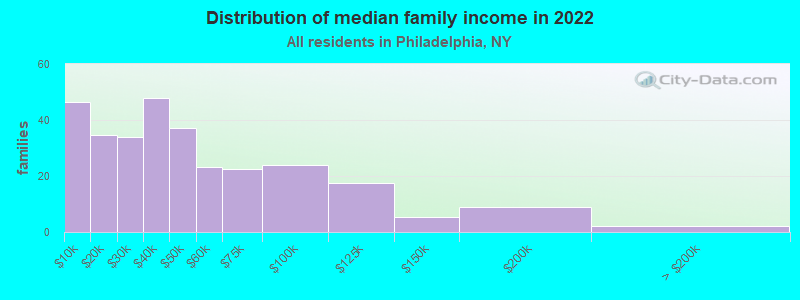
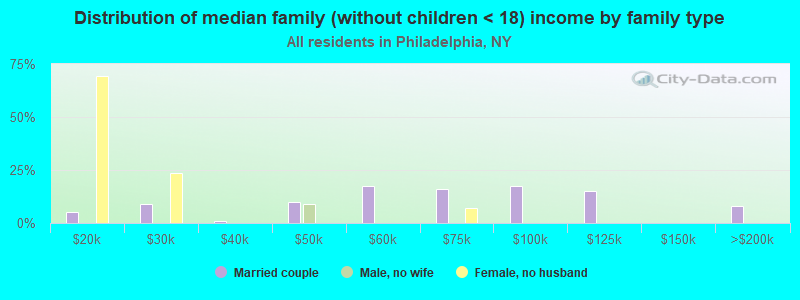
Median family income in Philadelphia in 2022:
Philadelphia:
$39,840
State:
$99,066
Number of families with income < $10k:
Philadelphia:
15.3% (46)
State:
4.2% (197,409)
Number of families with income $10k - 20k:
Philadelphia:
11.4% (35)
State:
4.3% (205,373)
Number of families with income $20k - 30k:
Philadelphia:
11.1% (34)
State:
5.1% (241,229)
Number of families with income $30k - 40k:
Philadelphia:
15.8% (48)
State:
5.5% (259,233)
Number of families with income $40k - 50k:
Philadelphia:
12.2% (37)
State:
5.5% (259,113)
Number of families with income $50k - 60k:
Philadelphia:
7.7% (23)
State:
5.4% (255,320)
Number of families with income $60k - 75k:
Philadelphia:
7.4% (23)
State:
8.2% (388,624)
Number of families with income $75k - 100k:
Philadelphia:
7.9% (24)
New York:
12.3% (583,110)
Number of families with income $100k - 125k:
Philadelphia:
5.8% (18)
New York:
10.6% (500,579)
Number of families with income $125k - 150k:
Philadelphia:
1.7% (5)
State:
8.5% (400,594)
Number of families with income $150k - 200k:
Philadelphia:
2.9% (9)
New York:
11.6% (551,650)
Number of families with income > $200k:
Philadelphia:
0.8% (2)
State:
18.9% (895,998)
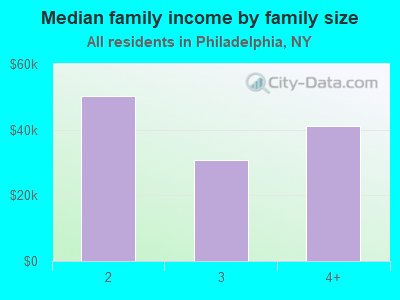
Median income for families with 0 earners:
Philadelphia:
$0
New York:
$44,019
Median income for families with 1 earner:
Philadelphia:
$0
State:
$66,402
Median income for families with 2 earners:
Philadelphia:
$50,013
State:
$128,561
Median income for families with 3+ earners:
Philadelphia:
$0
State:
$161,553
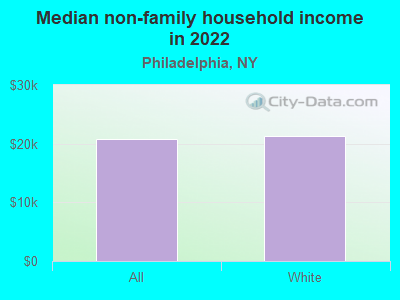
Median non-family income in Philadelphia in 2022:
Philadelphia:
$20,748
State:
$50,181
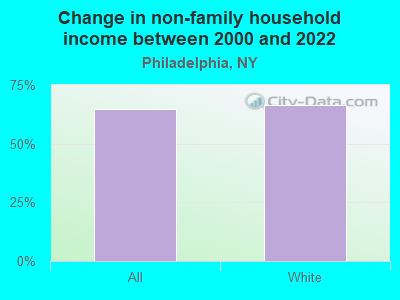
Change in median non-family income between 2000 and 2022:
Philadelphia, New York:
+64.7%
New York:
+85.4%
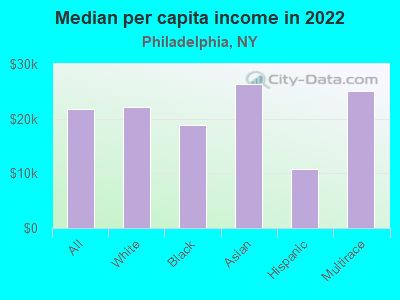
Median per capita income in Philadelphia in 2022:
Philadelphia:
$21,789
State:
$47,421
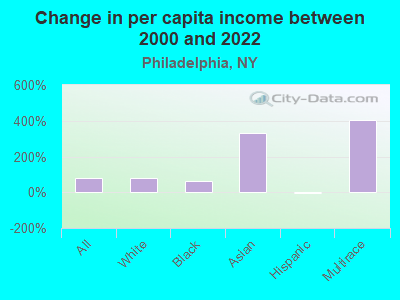
Change in median per capita income between 2000 and 2022:
Philadelphia, New York:
+78.5%
State:
+102.7%
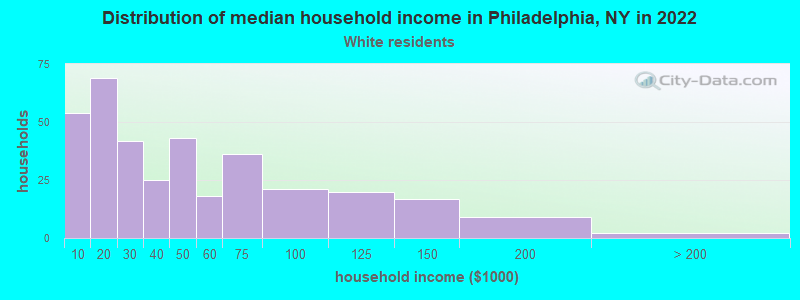
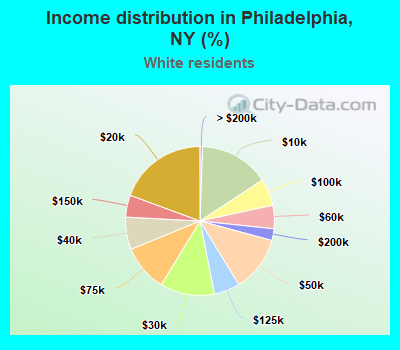
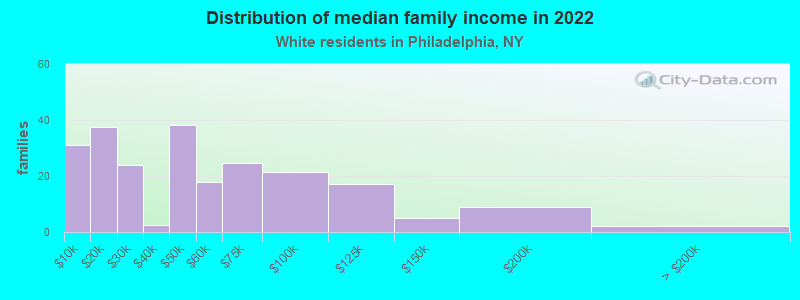
Income statistics for White residents
Median household income in Philadelphia, NY in 2022:
Philadelphia:
$38,165
New York:
$89,408
Change in median household income between 2000 and 2022:
Philadelphia, New York:
+43.2%
State:
+85.5%
Number of households with income < $10k:
Philadelphia:
15.2% (54)
New York:
4.8% (225,550)
Number of households with income $10k - 20k:
Philadelphia:
19.4% (69)
State:
6.1% (289,425)
Number of households with income $20k - 30k:
Philadelphia:
11.8% (42)
State:
5.9% (280,254)
Number of households with income $30k - 40k:
Philadelphia:
7.0% (25)
New York:
6.1% (288,263)
Number of households with income $40k - 50k:
Philadelphia:
12.1% (43)
State:
5.9% (278,079)
Number of households with income $50k - 60k:
Philadelphia:
5.1% (18)
New York:
5.7% (267,554)
Number of households with income $60k - 75k:
Philadelphia:
10.1% (36)
State:
8.4% (398,344)
Number of households with income $75k - 100k:
Philadelphia:
5.9% (21)
State:
11.8% (554,841)
Number of households with income $100k - 125k:
Philadelphia:
5.6% (20)
State:
10.0% (469,794)
Number of households with income $125k - 150k:
Philadelphia:
4.8% (17)
State:
7.6% (360,467)
Number of households with income $150k - 200k:
Philadelphia:
2.5% (9)
State:
10.1% (477,078)
Number of households with income > $200k:
Philadelphia:
0.6% (2)
State:
17.6% (829,233)
Aggregate household income in Philadelphia in 2022: $16,474,921
Median family income in Philadelphia in 2022:
Philadelphia:
$41,202
New York:
$115,170
Number of families with income < $10k:
Philadelphia:
13.5% (31)
New York:
2.5% (68,851)
Number of families with income $10k - 20k:
Philadelphia:
16.2% (37)
State:
3.0% (83,127)
Number of families with income $20k - 30k:
Philadelphia:
10.4% (24)
State:
3.5% (97,578)
Number of families with income $30k - 40k:
Philadelphia:
1.1% (3)
New York:
4.1% (114,108)
Number of families with income $40k - 50k:
Philadelphia:
16.5% (38)
New York:
4.7% (130,902)
Number of families with income $50k - 60k:
Philadelphia:
7.8% (18)
New York:
4.9% (135,118)
Number of families with income $60k - 75k:
Philadelphia:
10.7% (25)
State:
7.8% (216,254)
Number of families with income $75k - 100k:
Philadelphia:
9.3% (22)
New York:
12.4% (342,382)
Number of families with income $100k - 125k:
Philadelphia:
7.4% (17)
New York:
11.4% (314,917)
Number of families with income $125k - 150k:
Philadelphia:
2.2% (5)
State:
9.4% (260,489)
Number of families with income $150k - 200k:
Philadelphia:
3.9% (9)
State:
13.2% (365,586)
Number of families with income > $200k:
Philadelphia:
0.9% (2)
State:
23.2% (642,319)
Median non-family income in Philadelphia in 2022:
Philadelphia:
$21,286
New York:
$54,783
Change in median non-family income between 2000 and 2022:
Philadelphia, New York:
+66.5%
State:
+87.9%
Median per capita income in Philadelphia in 2022:
Philadelphia:
$22,104
State:
$57,640
Change in median per capita income between 2000 and 2022:
Philadelphia, New York:
+77.0%
State:
+111.6%
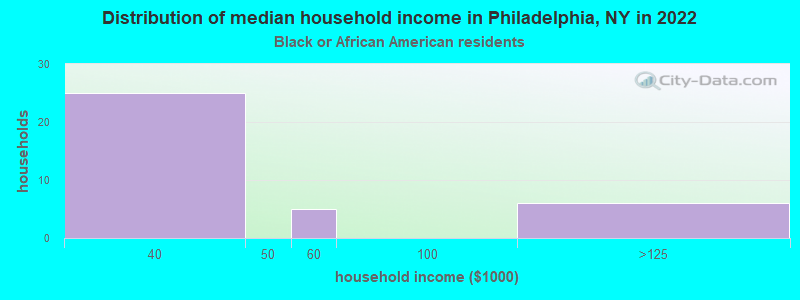
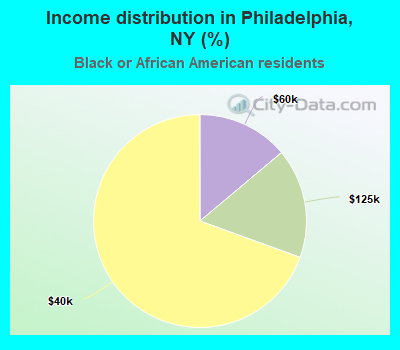
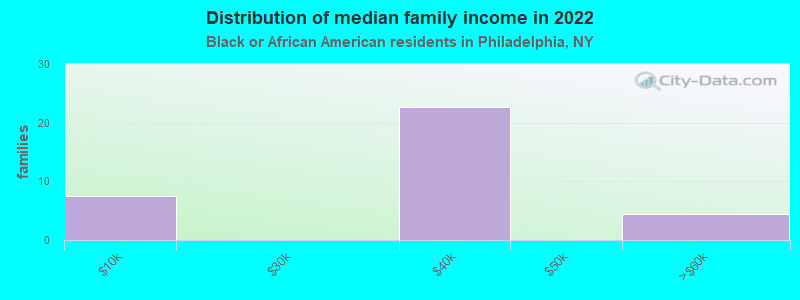
Income statistics for Black or African American residents
Number of households with income < $10k:
Philadelphia:
0.0% (0)
State:
12.0% (128,500)
Number of households with income $10k - 20k:
Philadelphia:
0.0% (0)
State:
10.0% (107,541)
Number of households with income $20k - 30k:
Philadelphia:
0.0% (0)
State:
8.4% (90,192)
Number of households with income $30k - 40k:
Philadelphia:
69.4% (25)
State:
7.4% (79,579)
Number of households with income $40k - 50k:
Philadelphia:
0.0% (0)
State:
6.8% (72,491)
Number of households with income $50k - 60k:
Philadelphia:
13.9% (5)
New York:
6.7% (71,309)
Number of households with income $60k - 75k:
Philadelphia:
0.0% (0)
New York:
8.9% (95,050)
Number of households with income $75k - 100k:
Philadelphia:
0.0% (0)
New York:
11.5% (123,569)
Number of households with income $100k - 125k:
Philadelphia:
16.7% (6)
New York:
8.1% (86,632)
Number of households with income $125k - 150k:
Philadelphia:
0.0% (0)
State:
6.0% (64,788)
Number of households with income $150k - 200k:
Philadelphia:
0.0% (0)
State:
7.2% (76,644)
Number of households with income > $200k:
Philadelphia:
0.0% (0)
State:
7.0% (75,062)
Aggregate household income in Philadelphia in 2022: $1,483,659
Median family income in Philadelphia in 2022:
Philadelphia:
$35,240
State:
$72,528
Number of families with income < $10k:
Philadelphia:
21.6% (7)
New York:
8.6% (54,100)
Number of families with income $30k - 40k:
Philadelphia:
65.4% (23)
State:
6.9% (43,353)
Number of families with income $50k - 60k:
Philadelphia:
13.0% (4)
New York:
6.3% (39,748)
Median per capita income in Philadelphia in 2022:
Philadelphia:
$18,838
New York:
$31,947
Change in median per capita income between 2000 and 2022:
Philadelphia, New York:
+65.0%
State:
+106.1%
Income statistics for Asian residents
Median per capita income in Philadelphia in 2022:
Philadelphia:
$26,400
New York:
$46,726
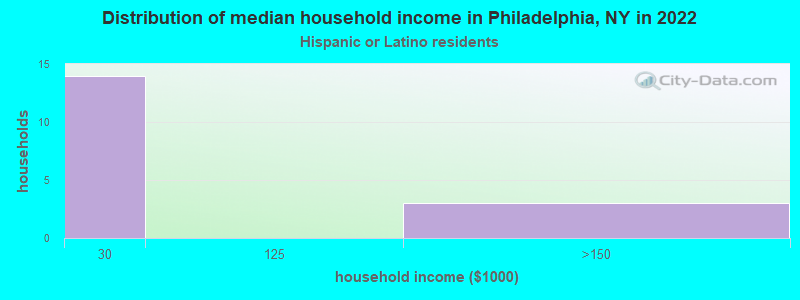
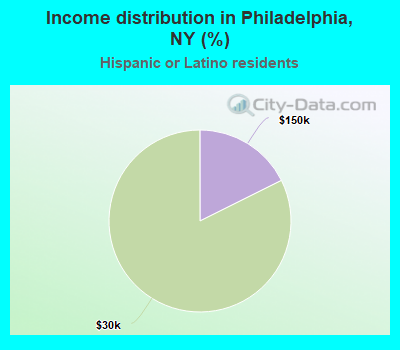
Income statistics for Hispanic or Latino residents
Number of households with income < $10k:
Philadelphia:
0.0% (0)
State:
9.9% (127,185)
Number of households with income $10k - 20k:
Philadelphia:
0.0% (0)
State:
10.7% (136,699)
Number of households with income $20k - 30k:
Philadelphia:
82.4% (14)
New York:
8.1% (102,991)
Number of households with income $30k - 40k:
Philadelphia:
0.0% (0)
State:
7.8% (100,149)
Number of households with income $40k - 50k:
Philadelphia:
0.0% (0)
State:
6.9% (87,760)
Number of households with income $50k - 60k:
Philadelphia:
0.0% (0)
New York:
6.3% (80,968)
Number of households with income $60k - 75k:
Philadelphia:
0.0% (0)
State:
8.7% (110,631)
Number of households with income $75k - 100k:
Philadelphia:
0.0% (0)
New York:
11.2% (142,787)
Number of households with income $100k - 125k:
Philadelphia:
0.0% (0)
State:
8.2% (104,850)
Number of households with income $125k - 150k:
Philadelphia:
17.6% (3)
State:
6.3% (80,274)
Number of households with income $150k - 200k:
Philadelphia:
0.0% (0)
State:
7.4% (95,117)
Number of households with income > $200k:
Philadelphia:
0.0% (0)
State:
8.6% (109,514)
Aggregate household income in Philadelphia in 2022: $1,693,645
Median per capita income in Philadelphia in 2022:
Philadelphia:
$10,883
State:
$29,761
Change in median per capita income between 2000 and 2022:: -3.2%
Philadelphia, New York:
-3.2%
State:
+132.7%
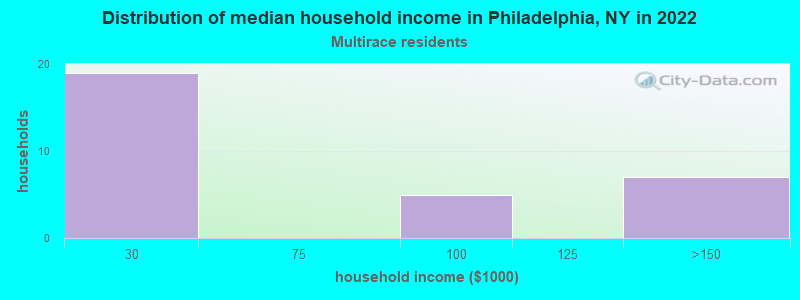
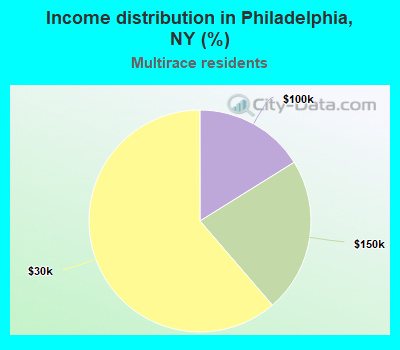
Income statistics for Multirace residents
Number of households with income < $10k:
Philadelphia:
0.0% (0)
State:
8.9% (57,924)
Number of households with income $10k - 20k:
Philadelphia:
0.0% (0)
New York:
8.7% (56,590)
Number of households with income $20k - 30k:
Philadelphia:
61.3% (19)
New York:
7.1% (46,287)
Number of households with income $30k - 40k:
Philadelphia:
0.0% (0)
New York:
6.9% (45,132)
Number of households with income $40k - 50k:
Philadelphia:
0.0% (0)
New York:
5.8% (37,946)
Number of households with income $50k - 60k:
Philadelphia:
0.0% (0)
New York:
5.6% (36,410)
Number of households with income $60k - 75k:
Philadelphia:
0.0% (0)
State:
7.8% (50,819)
Number of households with income $75k - 100k:
Philadelphia:
16.1% (5)
New York:
11.7% (76,024)
Number of households with income $100k - 125k:
Philadelphia:
0.0% (0)
New York:
9.3% (60,635)
Number of households with income $125k - 150k:
Philadelphia:
22.6% (7)
State:
6.2% (40,533)
Number of households with income $150k - 200k:
Philadelphia:
0.0% (0)
New York:
8.6% (56,409)
Number of households with income > $200k:
Philadelphia:
0.0% (0)
State:
13.4% (87,442)
Aggregate household income in Philadelphia in 2022: $1,493,659
Median per capita income in Philadelphia in 2022:
Philadelphia:
$25,006
State:
$36,931
Discuss Philadelphia, New York (NY) on our hugely popular New York forum.