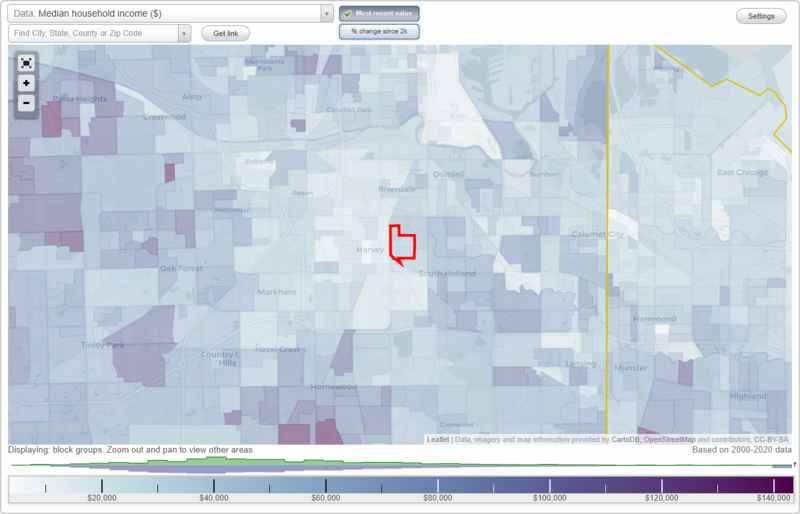
The median household income in Phoenix, IL in 2022 was $23,968, which was 220.0% less than the median annual income of $76,708 across the entire state of Illinois. Compared to the median income of $29,643 in 2000 this represents a decrease of 23.7%. The per capita income in 2022 was $23,971, which means an increase of 40.3% compared to 2000 when it was $14,321.
Whole page based on the data from 2000 / 2022 when the population of Phoenix, Illinois was 2,157 / 1,250
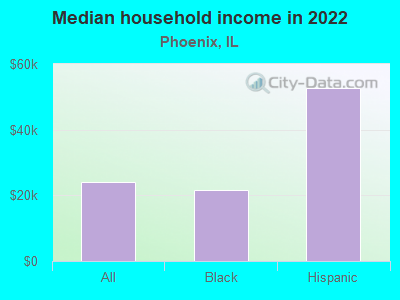
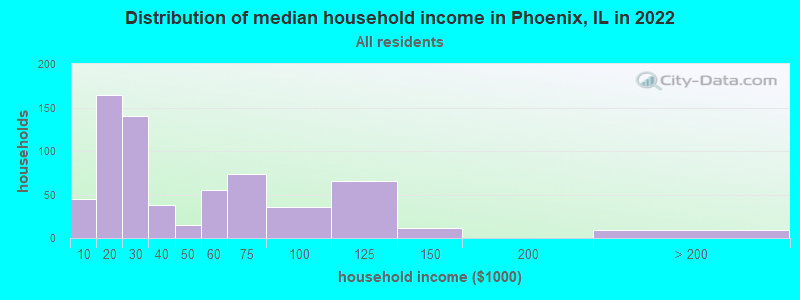
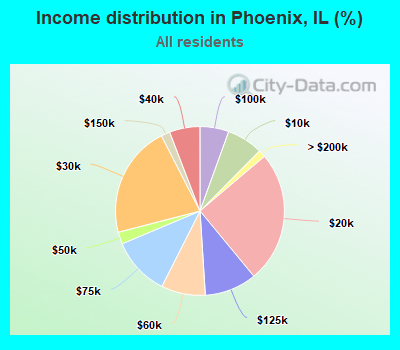
Income statistics for all residents
Median household income in Phoenix, IL in 2022:
Phoenix:
$23,968
State:
$76,708
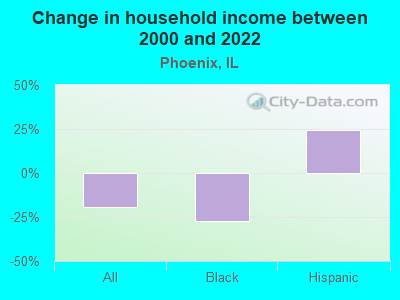
Change in median household income between 2000 and 2022:: -19.1%
Phoenix, Illinois:
-19.1%
State:
+64.6%
Number of households with income < $10k:
Phoenix:
6.9% (45)
State:
5.9% (296,090)
Number of households with income $10k - 20k:
Phoenix:
25.2% (164)
State:
6.6% (333,259)
Number of households with income $20k - 30k:
Phoenix:
21.5% (140)
State:
6.8% (342,921)
Number of households with income $30k - 40k:
Phoenix:
5.8% (38)
State:
7.0% (355,254)
Number of households with income $40k - 50k:
Phoenix:
2.3% (15)
Illinois:
6.7% (340,678)
Number of households with income $50k - 60k:
Phoenix:
8.4% (55)
State:
6.7% (339,405)
Number of households with income $60k - 75k:
Phoenix:
11.2% (73)
State:
9.2% (465,709)
Number of households with income $75k - 100k:
Phoenix:
5.5% (36)
Illinois:
12.9% (651,353)
Number of households with income $100k - 125k:
Phoenix:
10.0% (65)
Illinois:
10.3% (522,359)
Number of households with income $125k - 150k:
Phoenix:
1.7% (11)
State:
7.3% (367,136)
Number of households with income $150k - 200k:
Phoenix:
0.0% (0)
State:
9.0% (455,249)
Number of households with income > $200k:
Phoenix:
1.4% (9)
State:
11.6% (586,947)
Aggregate household income in Phoenix in 2022: $28,880,491
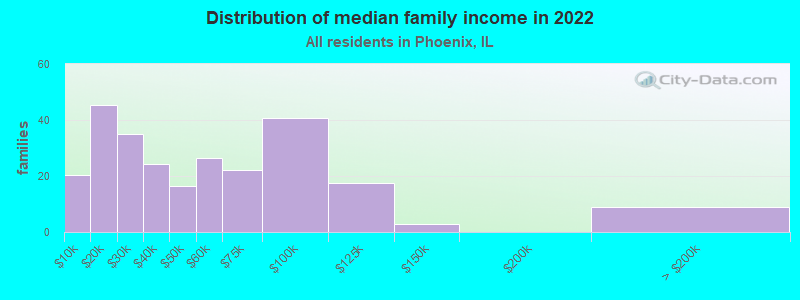
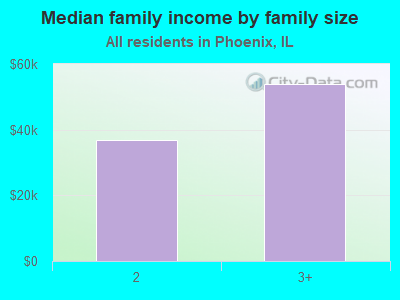
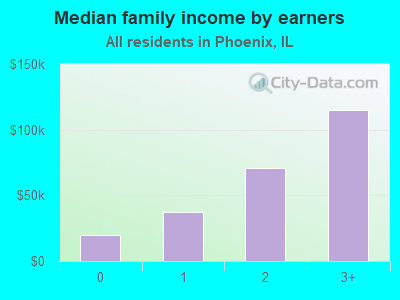
Median family income in Phoenix in 2022:
Phoenix:
$39,179
Illinois:
$96,948
Number of families with income < $10k:
Phoenix:
7.8% (20)
State:
3.4% (105,875)
Number of families with income $10k - 20k:
Phoenix:
17.4% (45)
Illinois:
3.3% (105,017)
Number of families with income $20k - 30k:
Phoenix:
13.5% (35)
State:
4.7% (146,403)
Number of families with income $30k - 40k:
Phoenix:
9.4% (24)
Illinois:
5.3% (167,069)
Number of families with income $40k - 50k:
Phoenix:
6.3% (16)
State:
5.8% (181,164)
Number of families with income $50k - 60k:
Phoenix:
10.2% (27)
State:
6.1% (191,561)
Number of families with income $60k - 75k:
Phoenix:
8.6% (22)
State:
9.0% (282,985)
Number of families with income $75k - 100k:
Phoenix:
15.7% (41)
Illinois:
13.8% (432,725)
Number of families with income $100k - 125k:
Phoenix:
6.7% (17)
State:
11.9% (373,296)
Number of families with income $125k - 150k:
Phoenix:
1.1% (3)
State:
8.9% (279,791)
Number of families with income > $200k:
Phoenix:
3.4% (9)
Illinois:
15.9% (500,033)
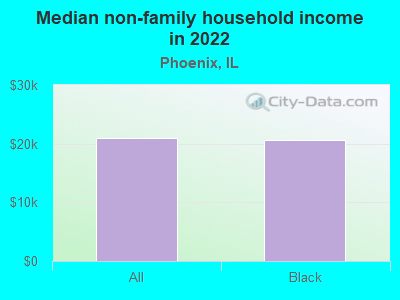
Median non-family income in Phoenix in 2022:
Phoenix:
$20,916
State:
$46,533
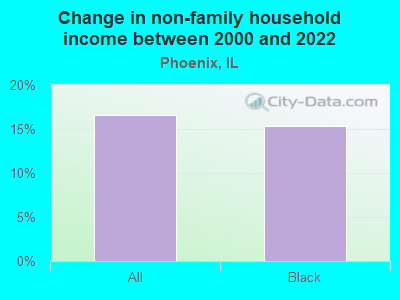
Change in median non-family income between 2000 and 2022:
Phoenix, Illinois:
+16.5%
Illinois:
+64.0%
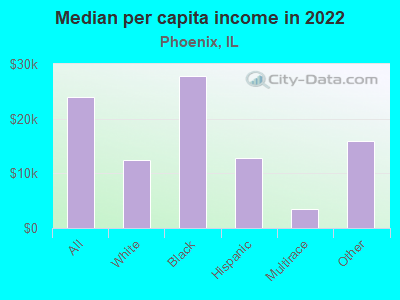
Median per capita income in Phoenix in 2022:
Phoenix:
$23,971
State:
$43,317
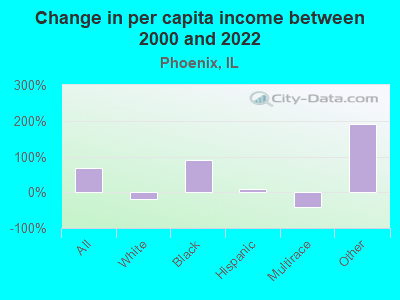
Change in median per capita income between 2000 and 2022:
Phoenix, Illinois:
+67.4%
State:
+87.5%
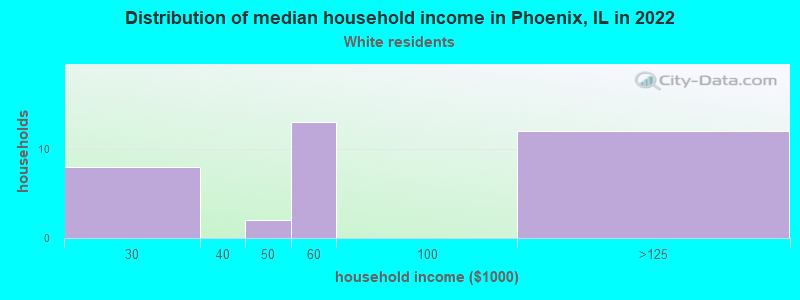
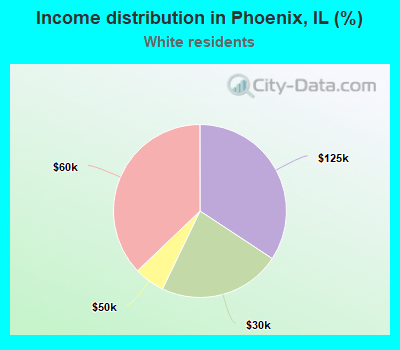
Income statistics for White residents
Number of households with income < $10k:
Phoenix:
0.0% (0)
Illinois:
4.5% (149,895)
Number of households with income $10k - 20k:
Phoenix:
0.0% (0)
State:
5.5% (184,529)
Number of households with income $20k - 30k:
Phoenix:
22.9% (8)
Illinois:
6.1% (205,767)
Number of households with income $30k - 40k:
Phoenix:
0.0% (0)
Illinois:
6.7% (225,572)
Number of households with income $40k - 50k:
Phoenix:
5.7% (2)
Illinois:
6.5% (216,965)
Number of households with income $50k - 60k:
Phoenix:
37.1% (13)
Illinois:
6.6% (222,841)
Number of households with income $60k - 75k:
Phoenix:
0.0% (0)
State:
9.3% (312,758)
Number of households with income $75k - 100k:
Phoenix:
0.0% (0)
Illinois:
12.9% (433,180)
Number of households with income $100k - 125k:
Phoenix:
34.3% (12)
Illinois:
10.7% (360,753)
Number of households with income $125k - 150k:
Phoenix:
0.0% (0)
State:
7.9% (266,532)
Number of households with income $150k - 200k:
Phoenix:
0.0% (0)
State:
10.0% (337,357)
Number of households with income > $200k:
Phoenix:
0.0% (0)
State:
13.3% (446,069)
Aggregate household income in Phoenix in 2022: $2,229,879
Median per capita income in Phoenix in 2022:
Phoenix:
$12,522
State:
$50,738
Change in median per capita income between 2000 and 2022:: -20.1%
Phoenix, Illinois:
-20.1%
Illinois:
+95.5%
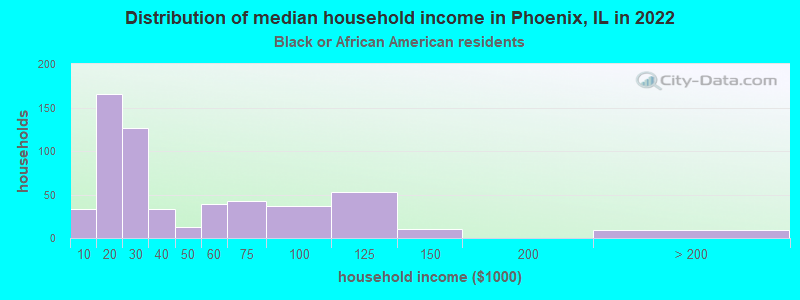
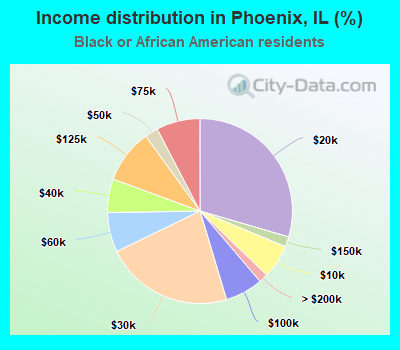
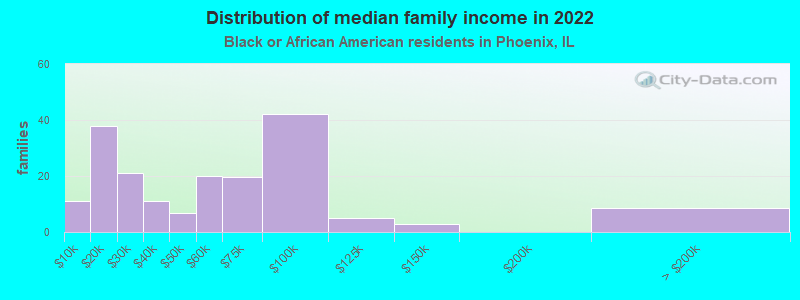
Income statistics for Black or African American residents
Median household income in Phoenix, IL in 2022:
Phoenix:
$21,723
State:
$45,019
Change in median household income between 2000 and 2022:: -27.0%
Phoenix, Illinois:
-27.0%
State:
+42.0%
Number of households with income < $10k:
Phoenix:
5.9% (33)
State:
13.3% (92,224)
Number of households with income $10k - 20k:
Phoenix:
29.5% (166)
State:
13.5% (93,732)
Number of households with income $20k - 30k:
Phoenix:
22.4% (126)
State:
9.9% (68,453)
Number of households with income $30k - 40k:
Phoenix:
5.9% (33)
State:
8.5% (59,072)
Number of households with income $40k - 50k:
Phoenix:
2.3% (13)
Illinois:
7.9% (55,033)
Number of households with income $50k - 60k:
Phoenix:
6.9% (39)
Illinois:
7.2% (49,556)
Number of households with income $60k - 75k:
Phoenix:
7.7% (43)
Illinois:
7.8% (53,726)
Number of households with income $75k - 100k:
Phoenix:
6.6% (37)
State:
11.6% (80,439)
Number of households with income $100k - 125k:
Phoenix:
9.4% (53)
State:
7.5% (52,244)
Number of households with income $125k - 150k:
Phoenix:
1.8% (10)
State:
3.9% (27,058)
Number of households with income $150k - 200k:
Phoenix:
0.0% (0)
Illinois:
4.6% (32,057)
Number of households with income > $200k:
Phoenix:
1.6% (9)
Illinois:
4.1% (28,731)
Aggregate household income in Phoenix in 2022: $24,090,474
Median family income in Phoenix in 2022:
Phoenix:
$50,065
State:
$60,661
Number of families with income < $10k:
Phoenix:
5.9% (11)
State:
9.5% (35,136)
Number of families with income $10k - 20k:
Phoenix:
20.4% (38)
State:
7.9% (29,324)
Number of families with income $20k - 30k:
Phoenix:
11.3% (21)
State:
8.8% (32,666)
Number of families with income $30k - 40k:
Phoenix:
6.0% (11)
State:
7.8% (28,775)
Number of families with income $40k - 50k:
Phoenix:
3.6% (7)
Illinois:
8.5% (31,429)
Number of families with income $50k - 60k:
Phoenix:
10.8% (20)
Illinois:
7.1% (26,341)
Number of families with income $60k - 75k:
Phoenix:
10.5% (20)
State:
8.3% (30,626)
Number of families with income $75k - 100k:
Phoenix:
22.7% (42)
Illinois:
14.0% (51,750)
Number of families with income $100k - 125k:
Phoenix:
2.7% (5)
State:
9.3% (34,471)
Number of families with income $125k - 150k:
Phoenix:
1.5% (3)
State:
5.7% (21,103)
Number of families with income > $200k:
Phoenix:
4.7% (9)
State:
6.3% (23,371)
Median non-family income in Phoenix in 2022:
Phoenix:
$20,707
Illinois:
$29,966
Change in median non-family income between 2000 and 2022:
Phoenix, Illinois:
+15.4%
State:
+44.4%
Median per capita income in Phoenix in 2022:
Phoenix:
$27,867
Illinois:
$28,045
Change in median per capita income between 2000 and 2022:
Phoenix, Illinois:
+90.0%
Illinois:
+90.2%
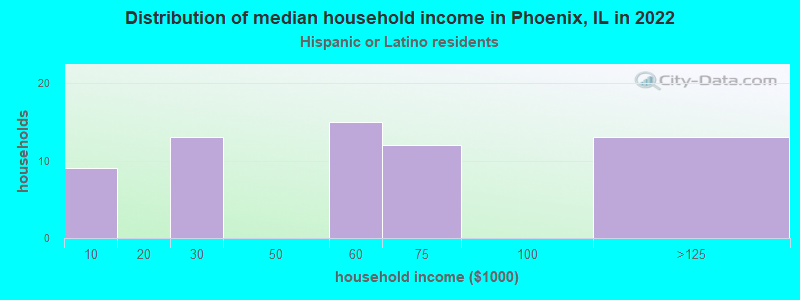
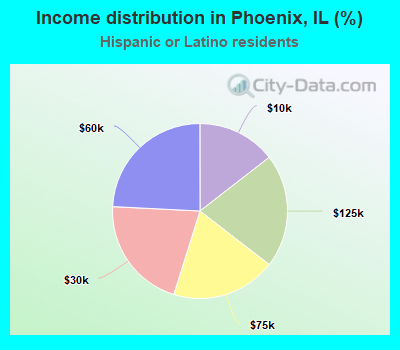
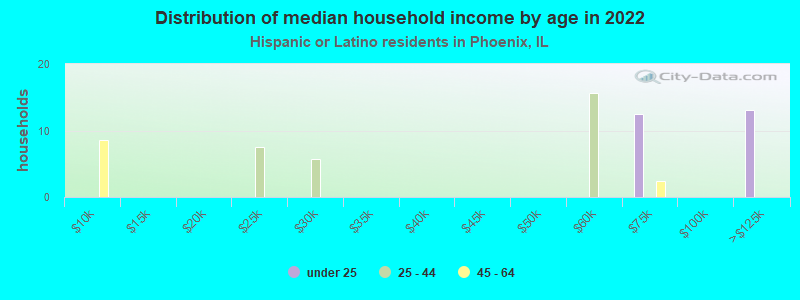
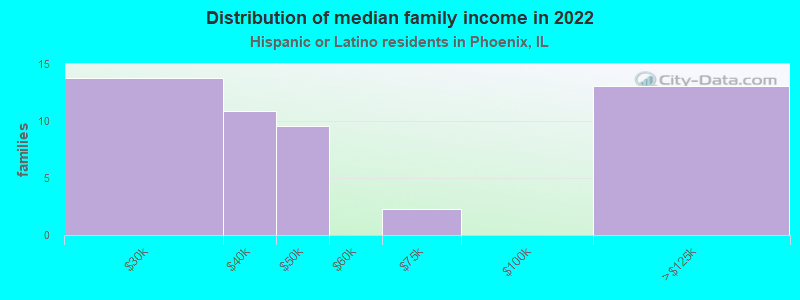
Income statistics for Hispanic or Latino residents
Median household income in Phoenix, IL in 2022:
Phoenix:
$52,802
Illinois:
$72,139
Change in median household income between 2000 and 2022:
Phoenix, Illinois:
+24.2%
State:
+75.7%
Number of households with income < $10k:
Phoenix:
14.5% (9)
State:
4.9% (33,145)
Number of households with income $10k - 20k:
Phoenix:
0.0% (0)
State:
5.4% (36,345)
Number of households with income $20k - 30k:
Phoenix:
21.0% (13)
State:
7.5% (50,677)
Number of households with income $30k - 40k:
Phoenix:
0.0% (0)
State:
7.7% (52,008)
Number of households with income $40k - 50k:
Phoenix:
0.0% (0)
State:
8.1% (54,702)
Number of households with income $50k - 60k:
Phoenix:
24.2% (15)
State:
7.5% (51,062)
Number of households with income $60k - 75k:
Phoenix:
19.4% (12)
State:
11.3% (76,576)
Number of households with income $75k - 100k:
Phoenix:
0.0% (0)
Illinois:
15.5% (105,152)
Number of households with income $100k - 125k:
Phoenix:
21.0% (13)
Illinois:
11.5% (77,760)
Number of households with income $125k - 150k:
Phoenix:
0.0% (0)
Illinois:
7.3% (49,310)
Number of households with income $150k - 200k:
Phoenix:
0.0% (0)
State:
7.6% (51,233)
Number of households with income > $200k:
Phoenix:
0.0% (0)
State:
5.9% (40,028)
Aggregate household income in Phoenix in 2022: $3,518,831
Median family income in Phoenix in 2022:
Phoenix:
$40,723
State:
$76,467
Number of families with income $20k - 30k:
Phoenix:
27.7% (14)
State:
6.8% (34,467)
Number of families with income $30k - 40k:
Phoenix:
22.0% (11)
Illinois:
7.5% (37,976)
Number of families with income $40k - 50k:
Phoenix:
19.3% (10)
State:
7.7% (38,858)
Number of families with income $60k - 75k:
Phoenix:
4.5% (2)
State:
11.5% (58,164)
Number of families with income $100k - 125k:
Phoenix:
26.4% (13)
Illinois:
12.1% (61,491)
Median per capita income in Phoenix in 2022:
Phoenix:
$12,859
State:
$26,551
Change in median per capita income between 2000 and 2022:
Phoenix, Illinois:
+8.8%
State:
+111.0%
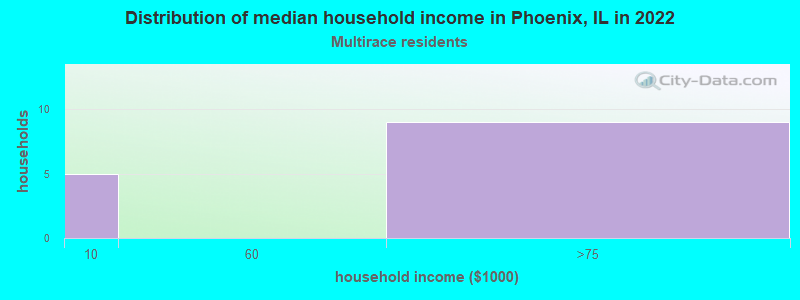
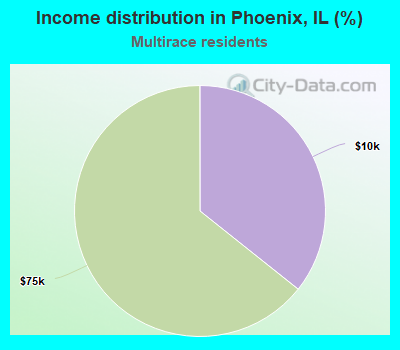
Income statistics for Multirace residents
Number of households with income < $10k:
Phoenix:
35.7% (5)
Illinois:
5.3% (21,595)
Number of households with income $10k - 20k:
Phoenix:
0.0% (0)
Illinois:
6.5% (26,720)
Number of households with income $20k - 30k:
Phoenix:
0.0% (0)
State:
8.0% (32,573)
Number of households with income $30k - 40k:
Phoenix:
0.0% (0)
Illinois:
8.4% (34,383)
Number of households with income $40k - 50k:
Phoenix:
0.0% (0)
State:
7.4% (30,234)
Number of households with income $50k - 60k:
Phoenix:
0.0% (0)
Illinois:
6.9% (28,432)
Number of households with income $60k - 75k:
Phoenix:
64.3% (9)
Illinois:
10.2% (41,780)
Number of households with income $75k - 100k:
Phoenix:
0.0% (0)
Illinois:
13.0% (53,426)
Number of households with income $100k - 125k:
Phoenix:
0.0% (0)
State:
10.5% (43,126)
Number of households with income $125k - 150k:
Phoenix:
0.0% (0)
State:
7.6% (31,153)
Number of households with income $150k - 200k:
Phoenix:
0.0% (0)
State:
7.6% (30,946)
Number of households with income > $200k:
Phoenix:
0.0% (0)
Illinois:
8.6% (35,208)
Aggregate household income in Phoenix in 2022: $2,727,735
Median per capita income in Phoenix in 2022:
Phoenix:
$3,394
State:
$29,285
Change in median per capita income between 2000 and 2022:: -40.5%
Phoenix, Illinois:
-40.5%
Illinois:
+112.9%
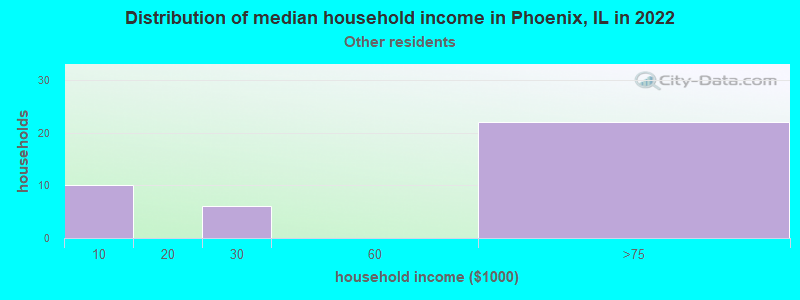
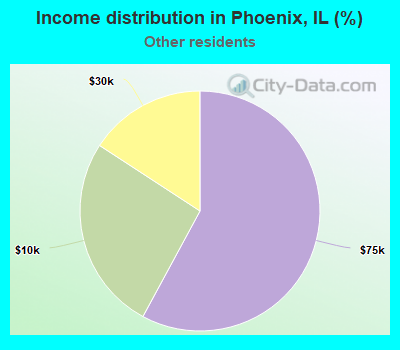
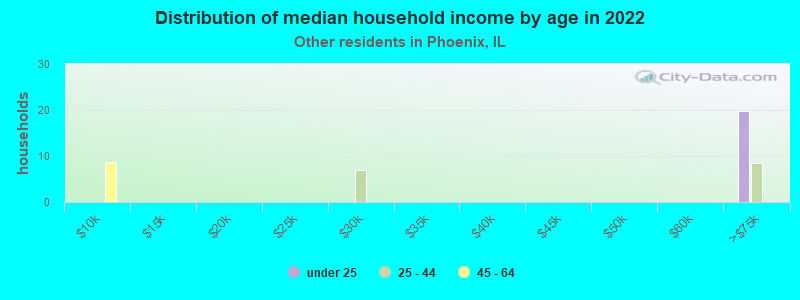
Income statistics for other residents
Number of households with income < $10k:
Phoenix:
26.3% (10)
State:
5.7% (16,383)
Number of households with income $10k - 20k:
Phoenix:
0.0% (0)
Illinois:
4.8% (13,886)
Number of households with income $20k - 30k:
Phoenix:
15.8% (6)
Illinois:
7.0% (20,054)
Number of households with income $30k - 40k:
Phoenix:
0.0% (0)
State:
7.0% (20,038)
Number of households with income $40k - 50k:
Phoenix:
0.0% (0)
State:
8.3% (23,759)
Number of households with income $50k - 60k:
Phoenix:
0.0% (0)
Illinois:
7.8% (22,410)
Number of households with income $60k - 75k:
Phoenix:
57.9% (22)
Illinois:
12.0% (34,448)
Number of households with income $75k - 100k:
Phoenix:
0.0% (0)
Illinois:
16.2% (46,508)
Number of households with income $100k - 125k:
Phoenix:
0.0% (0)
State:
12.5% (35,952)
Number of households with income $125k - 150k:
Phoenix:
0.0% (0)
State:
6.9% (19,732)
Number of households with income $150k - 200k:
Phoenix:
0.0% (0)
State:
7.5% (21,422)
Number of households with income > $200k:
Phoenix:
0.0% (0)
State:
4.3% (12,194)
Aggregate household income in Phoenix in 2022: $1,690,193
Median per capita income in Phoenix in 2022:
Phoenix:
$15,877
Illinois:
$25,392
Discuss Phoenix, Illinois (IL) on our hugely popular Illinois forum.