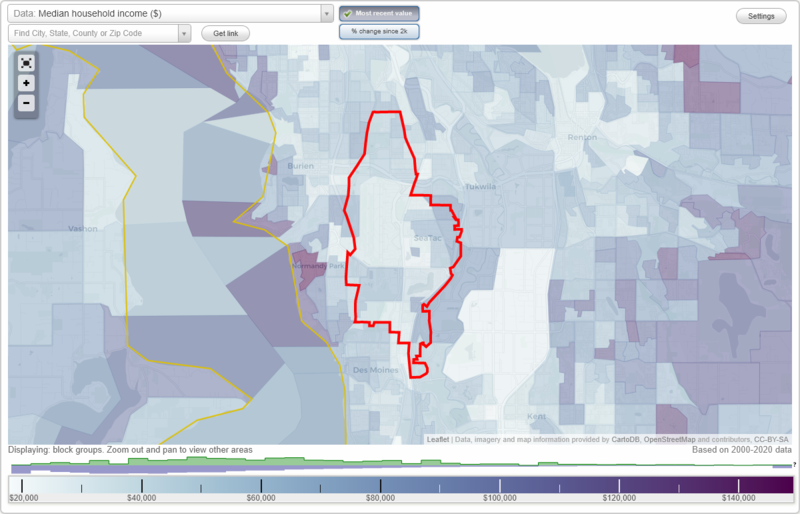
The median household income in SeaTac, WA in 2022 was $79,374, which was 15.0% less than the median annual income of $91,306 across the entire state of Washington. Compared to the median income of $41,202 in 2000 this represents an increase of 48.1%. The per capita income in 2022 was $37,806, which means an increase of 47.8% compared to 2000 when it was $19,717.
Whole page based on the data from 2000 / 2022 when the population of SeaTac, Washington was 25,496 / 31,097
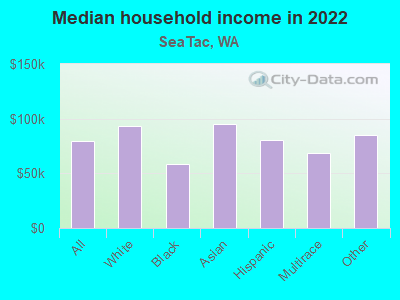
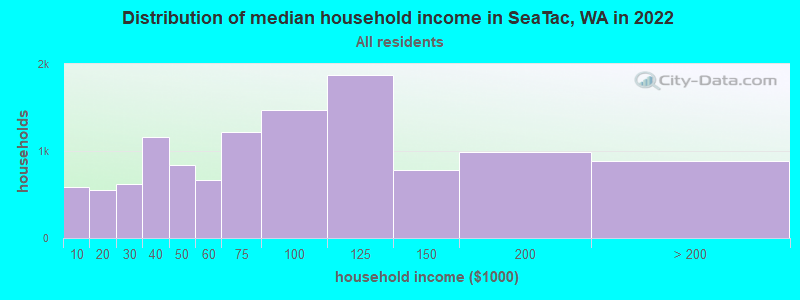
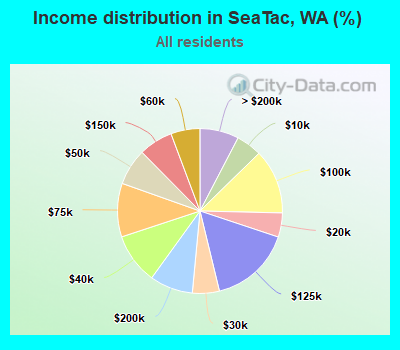
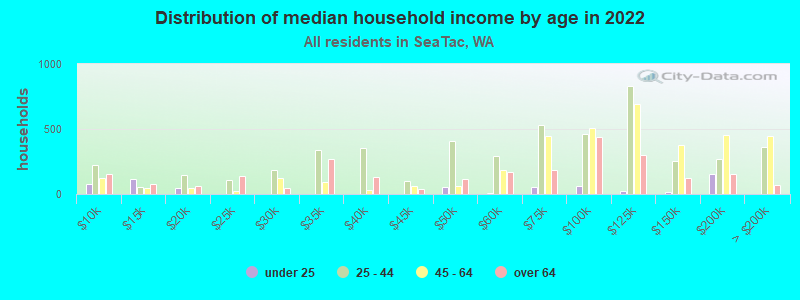
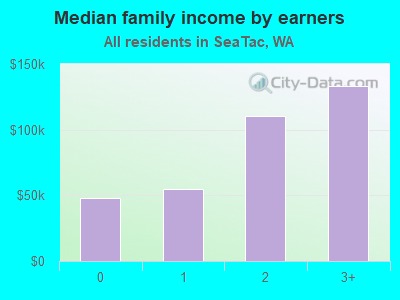
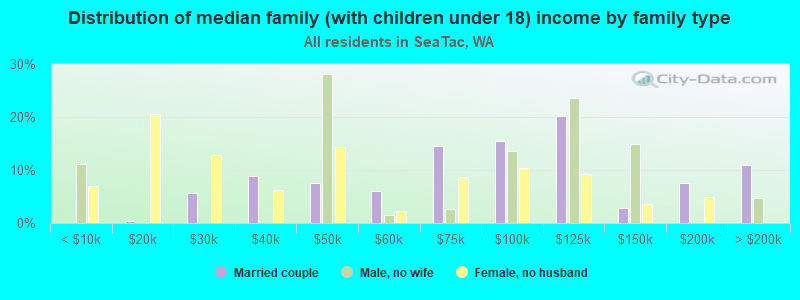
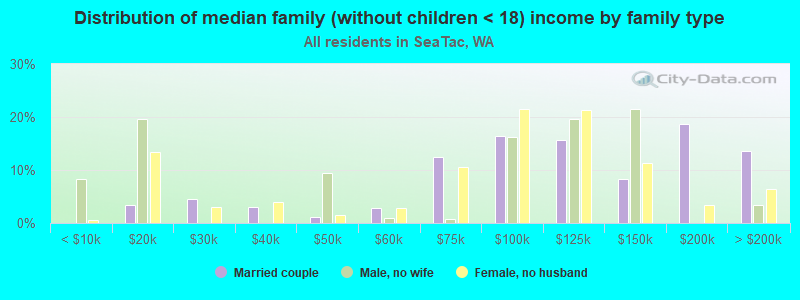
Income statistics for all residents
Median household income in SeaTac, WA in 2022:
SeaTac:
$79,375
State:
$91,306
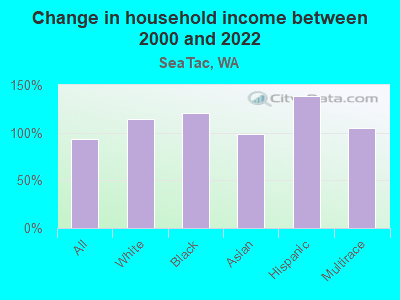
Change in median household income between 2000 and 2022:
SeaTac, Washington:
+92.6%
Washington:
+99.5%
Number of households with income < $10k:
SeaTac:
5.0% (586)
State:
4.5% (139,331)
Number of households with income $10k - 20k:
SeaTac:
4.8% (553)
Washington:
5.0% (154,508)
Number of households with income $20k - 30k:
SeaTac:
5.3% (615)
Washington:
5.4% (166,555)
Number of households with income $30k - 40k:
SeaTac:
10.0% (1,160)
State:
5.5% (170,324)
Number of households with income $40k - 50k:
SeaTac:
7.2% (834)
State:
6.0% (183,941)
Number of households with income $50k - 60k:
SeaTac:
5.7% (663)
State:
6.1% (187,395)
Number of households with income $60k - 75k:
SeaTac:
10.5% (1,223)
State:
8.7% (266,771)
Number of households with income $75k - 100k:
SeaTac:
12.7% (1,477)
State:
13.1% (404,672)
Number of households with income $100k - 125k:
SeaTac:
16.1% (1,871)
State:
11.0% (337,911)
Number of households with income $125k - 150k:
SeaTac:
6.7% (779)
State:
8.0% (244,934)
Number of households with income $150k - 200k:
SeaTac:
8.5% (985)
Washington:
10.5% (323,812)
Number of households with income > $200k:
SeaTac:
7.6% (890)
State:
16.2% (499,799)
Aggregate household income in SeaTac in 2022: $1,139,612,924
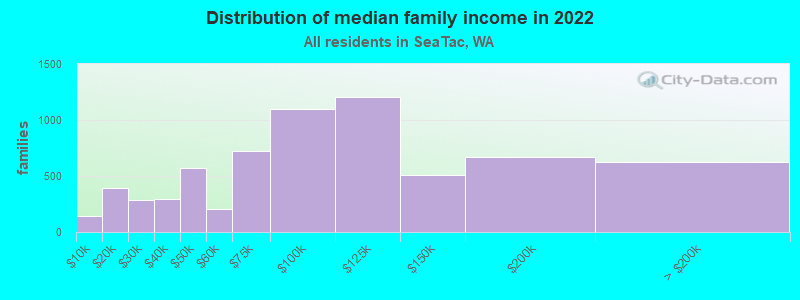
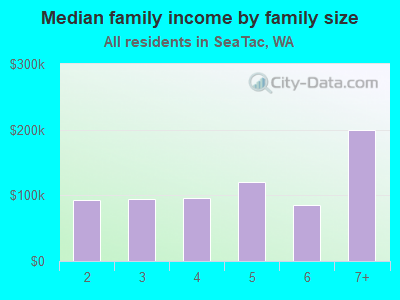
Median family income in SeaTac in 2022:
SeaTac:
$95,145
State:
$109,192
Number of families with income < $10k:
SeaTac:
2.1% (142)
State:
2.9% (55,953)
Number of families with income $10k - 20k:
SeaTac:
5.9% (394)
Washington:
2.6% (50,138)
Number of families with income $20k - 30k:
SeaTac:
4.3% (289)
State:
3.2% (61,974)
Number of families with income $30k - 40k:
SeaTac:
4.4% (297)
State:
4.1% (80,240)
Number of families with income $40k - 50k:
SeaTac:
8.5% (571)
Washington:
4.9% (94,310)
Number of families with income $50k - 60k:
SeaTac:
3.0% (205)
State:
5.3% (101,674)
Number of families with income $60k - 75k:
SeaTac:
10.7% (722)
State:
8.2% (158,348)
Number of families with income $75k - 100k:
SeaTac:
16.4% (1,100)
State:
13.8% (267,812)
Number of families with income $100k - 125k:
SeaTac:
18.0% (1,208)
Washington:
12.4% (240,213)
Number of families with income $125k - 150k:
SeaTac:
7.6% (511)
Washington:
9.3% (180,011)
Number of families with income $150k - 200k:
SeaTac:
9.9% (666)
State:
13.0% (250,874)
Number of families with income > $200k:
SeaTac:
9.3% (623)
State:
20.4% (393,898)
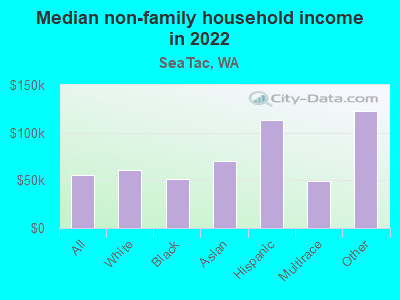
Median non-family income in SeaTac in 2022:
SeaTac:
$55,835
Washington:
$57,299
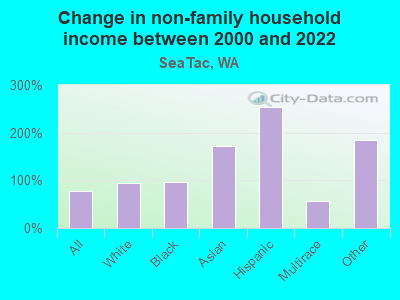
Change in median non-family income between 2000 and 2022:
SeaTac, Washington:
+77.6%
Washington:
+94.9%
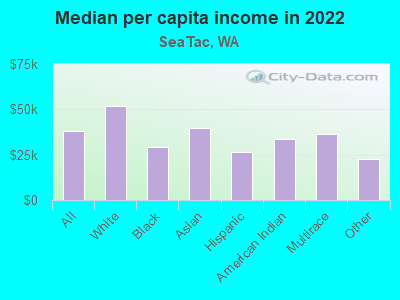
Median per capita income in SeaTac in 2022:
SeaTac:
$37,807
State:
$50,764
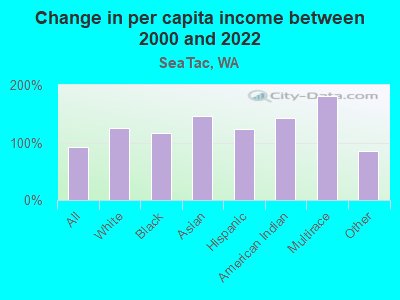
Change in median per capita income between 2000 and 2022:
SeaTac, Washington:
+91.7%
State:
+121.0%
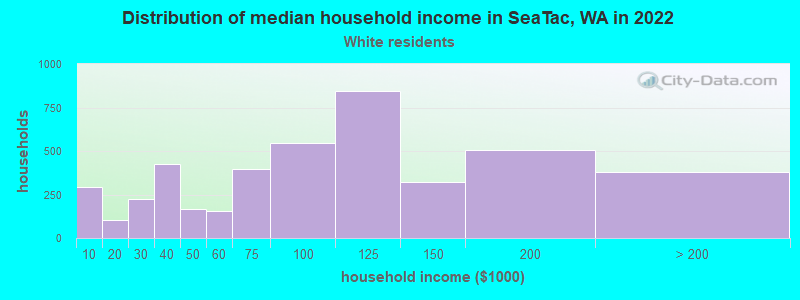
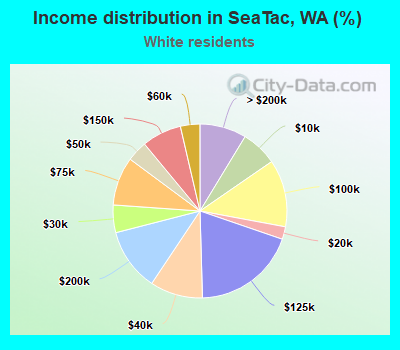
Income statistics for White residents
Median household income in SeaTac, WA in 2022:
SeaTac:
$93,447
Washington:
$91,916
Change in median household income between 2000 and 2022:
SeaTac, Washington:
+114.1%
State:
+95.4%
Number of households with income < $10k:
SeaTac:
6.7% (293)
State:
4.3% (95,850)
Number of households with income $10k - 20k:
SeaTac:
2.3% (102)
State:
4.8% (106,421)
Number of households with income $20k - 30k:
SeaTac:
5.1% (224)
State:
5.5% (122,860)
Number of households with income $30k - 40k:
SeaTac:
9.8% (428)
Washington:
5.4% (119,627)
Number of households with income $40k - 50k:
SeaTac:
3.8% (168)
State:
5.9% (132,276)
Number of households with income $50k - 60k:
SeaTac:
3.6% (158)
State:
6.1% (136,212)
Number of households with income $60k - 75k:
SeaTac:
9.0% (394)
Washington:
8.8% (196,086)
Number of households with income $75k - 100k:
SeaTac:
12.5% (547)
State:
13.4% (299,192)
Number of households with income $100k - 125k:
SeaTac:
19.3% (842)
State:
11.3% (252,209)
Number of households with income $125k - 150k:
SeaTac:
7.4% (322)
State:
7.9% (175,962)
Number of households with income $150k - 200k:
SeaTac:
11.6% (508)
State:
10.7% (239,156)
Number of households with income > $200k:
SeaTac:
8.7% (379)
Washington:
16.1% (359,917)
Aggregate household income in SeaTac in 2022: $483,196,452
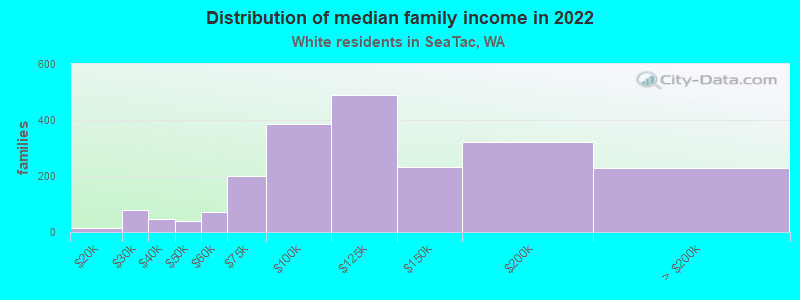
Median family income in SeaTac in 2022:
SeaTac:
$116,056
Washington:
$112,511
Number of families with income < $10k:
SeaTac:
0.1% (3)
State:
2.4% (33,676)
Number of families with income $10k - 20k:
SeaTac:
0.7% (15)
Washington:
2.0% (28,228)
Number of families with income $20k - 30k:
SeaTac:
3.7% (77)
State:
2.9% (39,288)
Number of families with income $30k - 40k:
SeaTac:
2.2% (46)
State:
3.6% (50,190)
Number of families with income $40k - 50k:
SeaTac:
2.0% (41)
State:
4.6% (63,009)
Number of families with income $50k - 60k:
SeaTac:
3.4% (71)
State:
5.0% (69,270)
Number of families with income $60k - 75k:
SeaTac:
9.4% (199)
State:
8.2% (112,369)
Number of families with income $75k - 100k:
SeaTac:
18.2% (385)
State:
14.1% (194,214)
Number of families with income $100k - 125k:
SeaTac:
23.2% (490)
Washington:
13.2% (182,184)
Number of families with income $125k - 150k:
SeaTac:
11.0% (232)
State:
9.5% (130,928)
Number of families with income $150k - 200k:
SeaTac:
15.3% (322)
Washington:
13.7% (188,621)
Number of families with income > $200k:
SeaTac:
10.8% (228)
Washington:
20.8% (285,982)
Median non-family income in SeaTac in 2022:
SeaTac:
$61,362
Washington:
$56,103
Change in median non-family income between 2000 and 2022:
SeaTac, Washington:
+93.6%
Washington:
+87.7%
Median per capita income in SeaTac in 2022:
SeaTac:
$51,840
Washington:
$55,212
Change in median per capita income between 2000 and 2022:
SeaTac, Washington:
+126.3%
Washington:
+123.8%
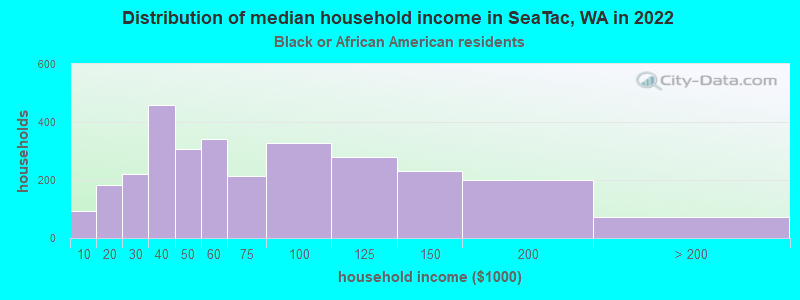
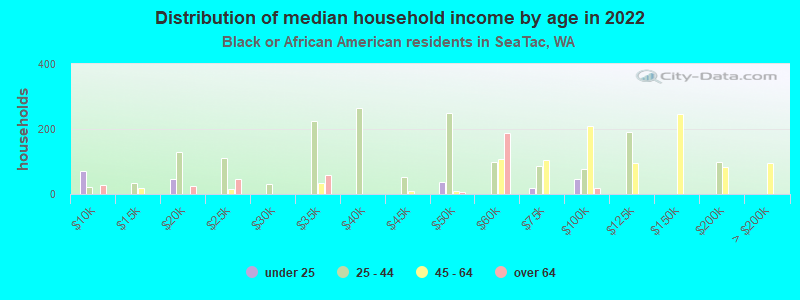
Income statistics for Black or African American residents
Median household income in SeaTac, WA in 2022:
SeaTac:
$58,750
Washington:
$68,202
Change in median household income between 2000 and 2022:
SeaTac, Washington:
+121.5%
State:
+89.9%
Number of households with income < $10k:
SeaTac:
3.2% (94)
State:
7.2% (8,014)
Number of households with income $10k - 20k:
SeaTac:
6.2% (183)
State:
8.0% (8,904)
Number of households with income $20k - 30k:
SeaTac:
7.6% (222)
Washington:
7.4% (8,207)
Number of households with income $30k - 40k:
SeaTac:
15.7% (460)
State:
5.6% (6,220)
Number of households with income $40k - 50k:
SeaTac:
10.5% (308)
State:
9.5% (10,585)
Number of households with income $50k - 60k:
SeaTac:
11.7% (342)
State:
7.3% (8,078)
Number of households with income $60k - 75k:
SeaTac:
7.3% (213)
State:
8.7% (9,704)
Number of households with income $75k - 100k:
SeaTac:
11.2% (328)
State:
12.9% (14,315)
Number of households with income $100k - 125k:
SeaTac:
9.5% (280)
Washington:
7.7% (8,592)
Number of households with income $125k - 150k:
SeaTac:
7.9% (232)
State:
8.9% (9,840)
Number of households with income $150k - 200k:
SeaTac:
6.8% (200)
Washington:
7.6% (8,434)
Number of households with income > $200k:
SeaTac:
2.4% (71)
State:
9.1% (10,075)
Aggregate household income in SeaTac in 2022: $221,571,358
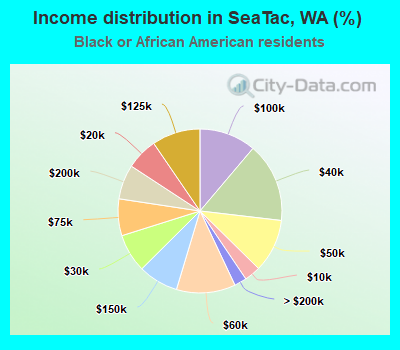
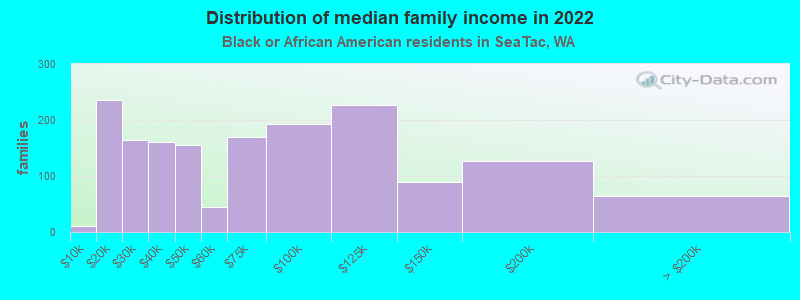
Median family income in SeaTac in 2022:
SeaTac:
$70,170
State:
$82,165
Number of families with income < $10k:
SeaTac:
0.7% (11)
State:
5.5% (3,709)
Number of families with income $10k - 20k:
SeaTac:
14.4% (236)
Washington:
7.4% (4,951)
Number of families with income $20k - 30k:
SeaTac:
10.0% (164)
State:
4.7% (3,151)
Number of families with income $30k - 40k:
SeaTac:
9.8% (160)
State:
5.3% (3,525)
Number of families with income $40k - 50k:
SeaTac:
9.5% (156)
State:
6.8% (4,558)
Number of families with income $50k - 60k:
SeaTac:
2.7% (45)
Washington:
7.0% (4,687)
Number of families with income $60k - 75k:
SeaTac:
10.4% (170)
State:
9.3% (6,231)
Number of families with income $75k - 100k:
SeaTac:
11.7% (192)
State:
14.8% (9,876)
Number of families with income $100k - 125k:
SeaTac:
13.8% (226)
Washington:
9.0% (6,018)
Number of families with income $125k - 150k:
SeaTac:
5.5% (90)
State:
9.5% (6,348)
Number of families with income $150k - 200k:
SeaTac:
7.7% (126)
State:
8.6% (5,737)
Number of families with income > $200k:
SeaTac:
3.9% (64)
State:
12.0% (8,041)
Median non-family income in SeaTac in 2022:
SeaTac:
$51,775
State:
$49,169
Change in median non-family income between 2000 and 2022:
SeaTac, Washington:
+96.2%
Washington:
+87.7%
Median per capita income in SeaTac in 2022:
SeaTac:
$29,193
State:
$38,209
Change in median per capita income between 2000 and 2022:
SeaTac, Washington:
+115.6%
Washington:
+115.3%
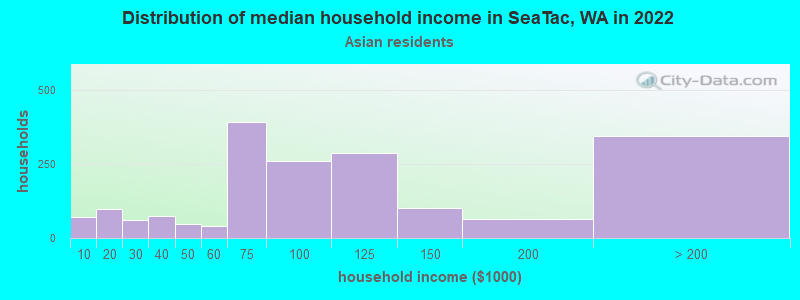
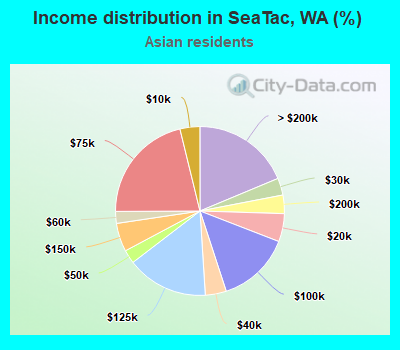
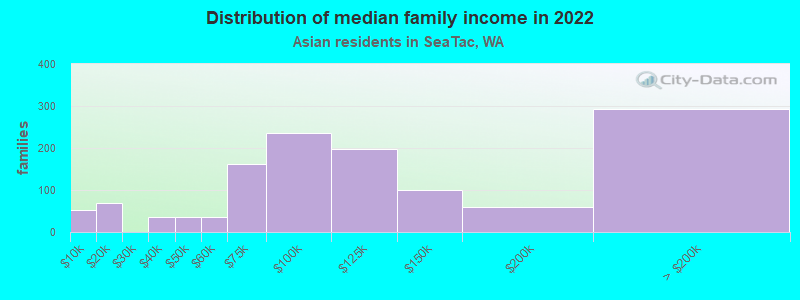
Income statistics for Asian residents
Median household income in SeaTac, WA in 2022:
SeaTac:
$95,573
State:
$125,692
Change in median household income between 2000 and 2022:
SeaTac, Washington:
+98.7%
State:
+164.5%
Number of households with income < $10k:
SeaTac:
3.8% (70)
Washington:
4.9% (14,099)
Number of households with income $10k - 20k:
SeaTac:
5.4% (99)
Washington:
3.5% (9,873)
Number of households with income $20k - 30k:
SeaTac:
3.3% (60)
State:
2.9% (8,352)
Number of households with income $30k - 40k:
SeaTac:
4.0% (74)
Washington:
4.0% (11,415)
Number of households with income $40k - 50k:
SeaTac:
2.6% (48)
State:
4.0% (11,421)
Number of households with income $50k - 60k:
SeaTac:
2.3% (42)
State:
4.2% (12,100)
Number of households with income $60k - 75k:
SeaTac:
21.3% (391)
State:
6.3% (17,903)
Number of households with income $75k - 100k:
SeaTac:
14.1% (259)
State:
10.4% (29,663)
Number of households with income $100k - 125k:
SeaTac:
15.6% (287)
State:
9.4% (26,839)
Number of households with income $125k - 150k:
SeaTac:
5.4% (100)
State:
8.5% (24,200)
Number of households with income $150k - 200k:
SeaTac:
3.5% (65)
State:
12.6% (35,976)
Number of households with income > $200k:
SeaTac:
18.7% (344)
State:
29.2% (83,109)
Aggregate household income in SeaTac in 2022: $207,859,833
Median family income in SeaTac in 2022:
SeaTac:
$106,301
Washington:
$143,595
Number of families with income < $10k:
SeaTac:
4.1% (53)
State:
2.9% (5,479)
Number of families with income $10k - 20k:
SeaTac:
5.4% (69)
Washington:
2.2% (4,150)
Number of families with income $30k - 40k:
SeaTac:
2.7% (35)
State:
3.1% (5,734)
Number of families with income $40k - 50k:
SeaTac:
2.7% (35)
Washington:
3.6% (6,707)
Number of families with income $50k - 60k:
SeaTac:
2.9% (36)
Washington:
4.1% (7,663)
Number of families with income $60k - 75k:
SeaTac:
12.6% (161)
State:
5.1% (9,490)
Number of families with income $75k - 100k:
SeaTac:
18.4% (235)
State:
11.7% (21,919)
Number of families with income $100k - 125k:
SeaTac:
15.5% (197)
State:
9.3% (17,280)
Number of families with income $125k - 150k:
SeaTac:
7.9% (101)
State:
8.4% (15,602)
Number of families with income $150k - 200k:
SeaTac:
4.7% (60)
State:
13.3% (24,789)
Number of families with income > $200k:
SeaTac:
23.0% (294)
State:
34.4% (64,250)
Median non-family income in SeaTac in 2022:
SeaTac:
$70,303
Washington:
$84,971
Median per capita income in SeaTac in 2022:
SeaTac:
$39,442
State:
$67,666
Change in median per capita income between 2000 and 2022:
SeaTac, Washington:
+145.6%
State:
+236.0%
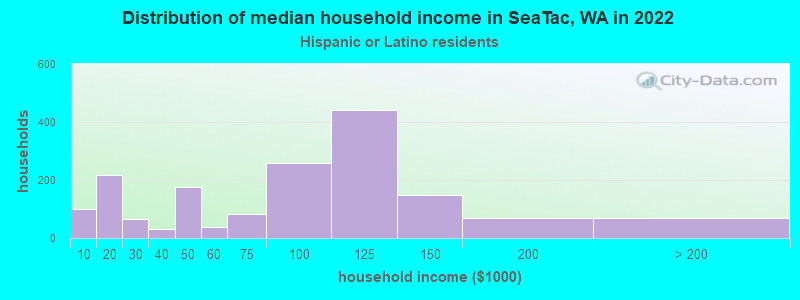
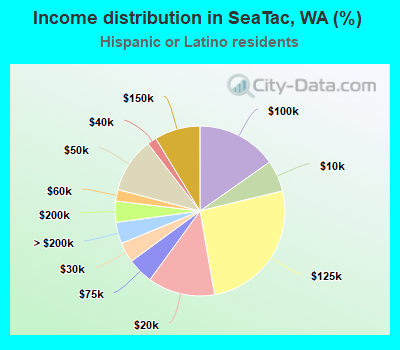
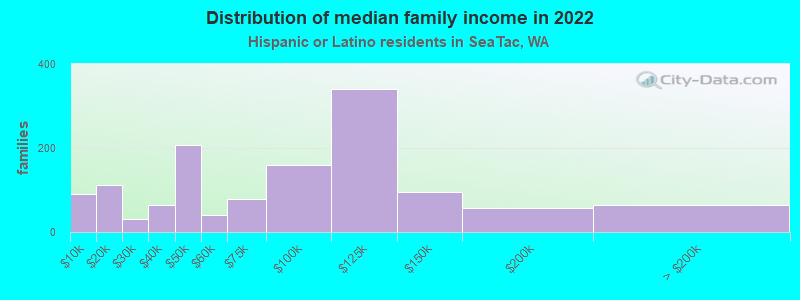
Income statistics for Hispanic or Latino residents
Median household income in SeaTac, WA in 2022:
SeaTac:
$80,445
State:
$74,770
Change in median household income between 2000 and 2022:
SeaTac, Washington:
+138.0%
State:
+128.3%
Number of households with income < $10k:
SeaTac:
6.0% (101)
Washington:
4.9% (14,456)
Number of households with income $10k - 20k:
SeaTac:
12.8% (216)
Washington:
5.3% (15,449)
Number of households with income $20k - 30k:
SeaTac:
3.8% (65)
State:
6.8% (20,016)
Number of households with income $30k - 40k:
SeaTac:
1.8% (30)
State:
7.7% (22,548)
Number of households with income $40k - 50k:
SeaTac:
10.5% (177)
Washington:
7.3% (21,450)
Number of households with income $50k - 60k:
SeaTac:
2.2% (37)
State:
7.7% (22,744)
Number of households with income $60k - 75k:
SeaTac:
4.9% (83)
State:
10.5% (30,737)
Number of households with income $75k - 100k:
SeaTac:
15.3% (258)
State:
14.9% (43,843)
Number of households with income $100k - 125k:
SeaTac:
26.0% (440)
Washington:
11.1% (32,554)
Number of households with income $125k - 150k:
SeaTac:
8.7% (147)
State:
7.4% (21,624)
Number of households with income $150k - 200k:
SeaTac:
4.0% (68)
State:
7.3% (21,360)
Number of households with income > $200k:
SeaTac:
4.1% (69)
Washington:
9.2% (27,055)
Aggregate household income in SeaTac in 2022: $144,493,255
Median family income in SeaTac in 2022:
SeaTac:
$79,379
State:
$76,866
Number of families with income < $10k:
SeaTac:
6.7% (90)
State:
4.4% (9,443)
Number of families with income $10k - 20k:
SeaTac:
8.3% (111)
Washington:
3.5% (7,524)
Number of families with income $20k - 30k:
SeaTac:
2.3% (30)
State:
5.6% (12,052)
Number of families with income $30k - 40k:
SeaTac:
4.8% (64)
State:
8.3% (17,803)
Number of families with income $40k - 50k:
SeaTac:
15.5% (207)
Washington:
7.7% (16,361)
Number of families with income $50k - 60k:
SeaTac:
3.1% (41)
State:
7.9% (16,852)
Number of families with income $60k - 75k:
SeaTac:
5.9% (79)
Washington:
11.4% (24,342)
Number of families with income $75k - 100k:
SeaTac:
12.0% (160)
State:
14.4% (30,698)
Number of families with income $100k - 125k:
SeaTac:
25.5% (341)
State:
11.4% (24,331)
Number of families with income $125k - 150k:
SeaTac:
7.1% (95)
State:
7.5% (16,099)
Number of families with income $150k - 200k:
SeaTac:
4.2% (56)
Washington:
8.2% (17,551)
Number of families with income > $200k:
SeaTac:
4.8% (64)
Washington:
9.7% (20,653)
Median non-family income in SeaTac in 2022:
SeaTac:
$113,007
State:
$54,173
Median per capita income in SeaTac in 2022:
SeaTac:
$26,344
State:
$28,252
Change in median per capita income between 2000 and 2022:
SeaTac, Washington:
+123.1%
Washington:
+150.2%
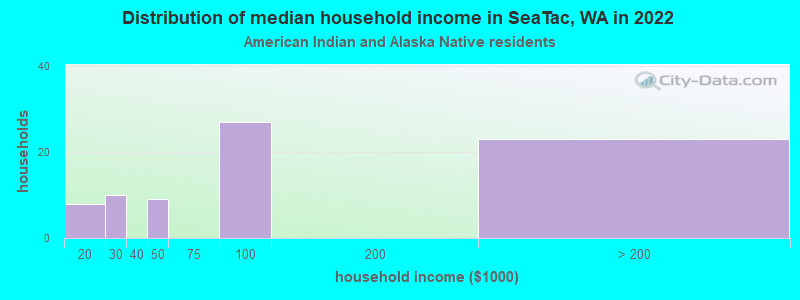
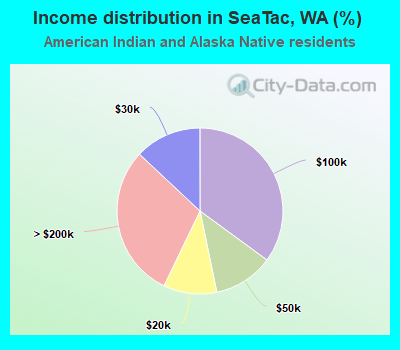
Income statistics for American Indian and Alaska Native residents
Number of households with income < $10k:
SeaTac:
0.0% (0)
Washington:
5.9% (1,768)
Number of households with income $10k - 20k:
SeaTac:
10.4% (8)
State:
8.9% (2,694)
Number of households with income $20k - 30k:
SeaTac:
13.0% (10)
Washington:
8.0% (2,412)
Number of households with income $30k - 40k:
SeaTac:
0.0% (0)
Washington:
7.7% (2,327)
Number of households with income $40k - 50k:
SeaTac:
11.7% (9)
State:
5.8% (1,755)
Number of households with income $50k - 60k:
SeaTac:
0.0% (0)
State:
7.5% (2,259)
Number of households with income $60k - 75k:
SeaTac:
0.0% (0)
Washington:
8.8% (2,669)
Number of households with income $75k - 100k:
SeaTac:
35.1% (27)
State:
12.8% (3,861)
Number of households with income $100k - 125k:
SeaTac:
0.0% (0)
State:
12.0% (3,618)
Number of households with income $125k - 150k:
SeaTac:
0.0% (0)
State:
8.6% (2,580)
Number of households with income $150k - 200k:
SeaTac:
0.0% (0)
Washington:
5.9% (1,774)
Number of households with income > $200k:
SeaTac:
29.9% (23)
State:
8.1% (2,447)
Aggregate household income in SeaTac in 2022: $8,940,009
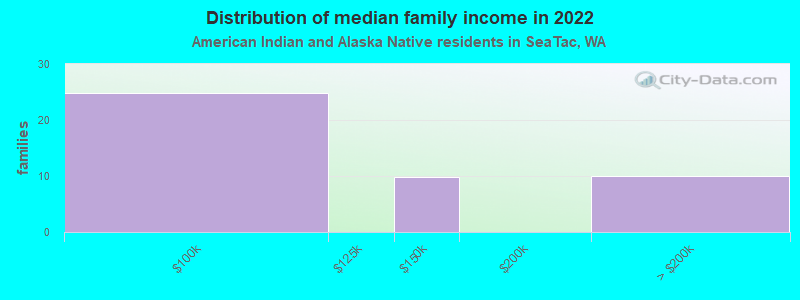
Median family income in SeaTac in 2022:
SeaTac:
$117,061
State:
$79,010
Number of families with income $75k - 100k:
SeaTac:
55.6% (25)
State:
13.1% (2,669)
Number of families with income $125k - 150k:
SeaTac:
21.9% (10)
State:
9.8% (2,000)
Number of families with income > $200k:
SeaTac:
22.4% (10)
State:
8.4% (1,698)
Median per capita income in SeaTac in 2022:
SeaTac:
$33,789
State:
$27,053
Change in median per capita income between 2000 and 2022:
SeaTac, Washington:
+142.7%
Washington:
+98.6%
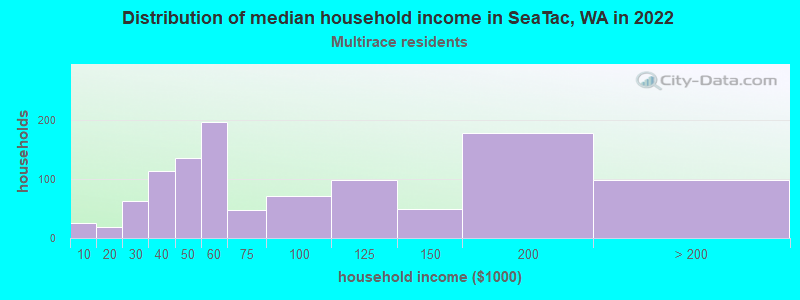
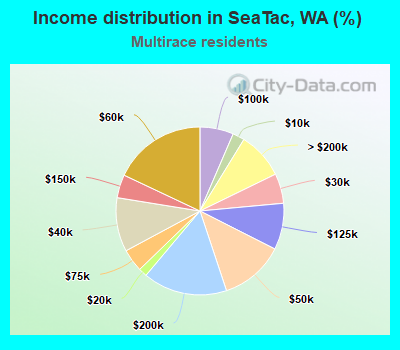
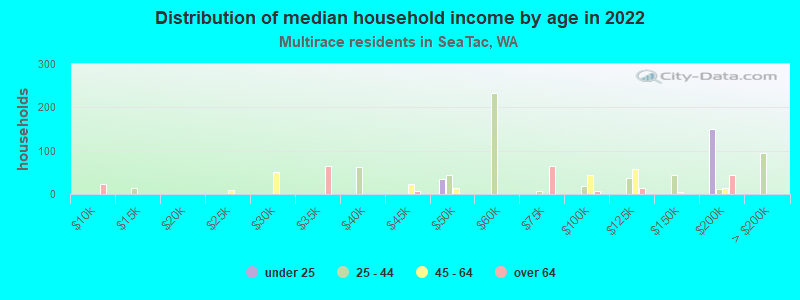
Income statistics for Multirace residents
Median household income in SeaTac, WA in 2022:
SeaTac:
$68,747
State:
$84,303
Change in median household income between 2000 and 2022:
SeaTac, Washington:
+104.7%
Washington:
+125.7%
Number of households with income < $10k:
SeaTac:
2.3% (25)
Washington:
4.3% (12,040)
Number of households with income $10k - 20k:
SeaTac:
1.6% (18)
State:
6.6% (18,437)
Number of households with income $20k - 30k:
SeaTac:
5.7% (63)
State:
5.2% (14,559)
Number of households with income $30k - 40k:
SeaTac:
10.4% (114)
Washington:
6.7% (18,491)
Number of households with income $40k - 50k:
SeaTac:
12.4% (136)
State:
6.3% (17,459)
Number of households with income $50k - 60k:
SeaTac:
18.0% (197)
State:
6.9% (19,086)
Number of households with income $60k - 75k:
SeaTac:
4.4% (48)
State:
9.1% (25,310)
Number of households with income $75k - 100k:
SeaTac:
6.5% (71)
State:
13.5% (37,493)
Number of households with income $100k - 125k:
SeaTac:
8.9% (98)
State:
10.7% (29,626)
Number of households with income $125k - 150k:
SeaTac:
4.5% (49)
State:
8.6% (23,899)
Number of households with income $150k - 200k:
SeaTac:
16.2% (178)
State:
10.2% (28,214)
Number of households with income > $200k:
SeaTac:
9.0% (99)
State:
11.9% (32,947)
Aggregate household income in SeaTac in 2022: $112,920,993
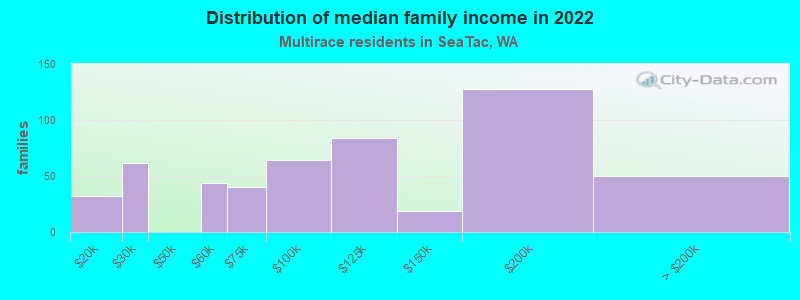
Median family income in SeaTac in 2022:
SeaTac:
$110,062
Washington:
$95,629
Number of families with income $10k - 20k:
SeaTac:
6.2% (32)
State:
4.3% (7,519)
Number of families with income $20k - 30k:
SeaTac:
11.9% (62)
State:
4.4% (7,775)
Number of families with income $50k - 60k:
SeaTac:
8.4% (44)
State:
5.6% (9,922)
Number of families with income $60k - 75k:
SeaTac:
7.6% (40)
State:
9.7% (17,113)
Number of families with income $75k - 100k:
SeaTac:
12.2% (64)
State:
13.6% (23,984)
Number of families with income $100k - 125k:
SeaTac:
16.0% (84)
Washington:
10.4% (18,288)
Number of families with income $125k - 150k:
SeaTac:
3.6% (19)
Washington:
10.5% (18,481)
Number of families with income $150k - 200k:
SeaTac:
24.5% (128)
State:
11.9% (20,852)
Number of families with income > $200k:
SeaTac:
9.6% (50)
State:
14.4% (25,289)
Median non-family income in SeaTac in 2022:
SeaTac:
$49,002
State:
$56,573
Change in median non-family income between 2000 and 2022:
SeaTac, Washington:
+56.8%
State:
+115.0%
Median per capita income in SeaTac in 2022:
SeaTac:
$36,262
State:
$32,496
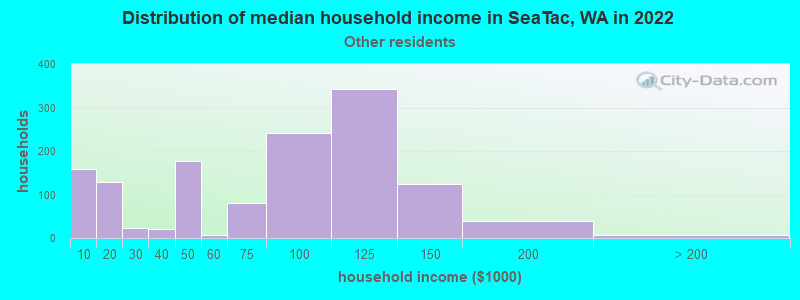
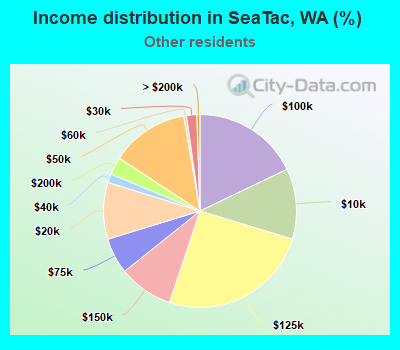
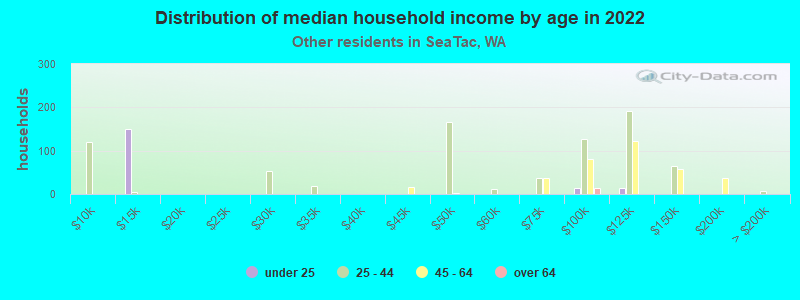
Income statistics for other residents
Median household income in SeaTac, WA in 2022:
SeaTac:
$85,414
State:
$69,545
Number of households with income < $10k:
SeaTac:
11.8% (159)
State:
5.3% (6,540)
Number of households with income $10k - 20k:
SeaTac:
9.5% (128)
Washington:
6.0% (7,385)
Number of households with income $20k - 30k:
SeaTac:
1.7% (23)
State:
7.5% (9,289)
Number of households with income $30k - 40k:
SeaTac:
1.5% (20)
Washington:
8.9% (11,015)
Number of households with income $40k - 50k:
SeaTac:
13.1% (176)
State:
7.6% (9,399)
Number of households with income $50k - 60k:
SeaTac:
0.4% (6)
State:
7.2% (8,867)
Number of households with income $60k - 75k:
SeaTac:
6.0% (81)
Washington:
10.5% (13,032)
Number of households with income $75k - 100k:
SeaTac:
17.9% (241)
State:
14.6% (18,007)
Number of households with income $100k - 125k:
SeaTac:
25.4% (342)
State:
12.2% (15,128)
Number of households with income $125k - 150k:
SeaTac:
9.1% (123)
State:
5.6% (6,950)
Number of households with income $150k - 200k:
SeaTac:
3.0% (40)
Washington:
7.1% (8,749)
Number of households with income > $200k:
SeaTac:
0.5% (7)
State:
7.5% (9,208)
Aggregate household income in SeaTac in 2022: $106,535,127
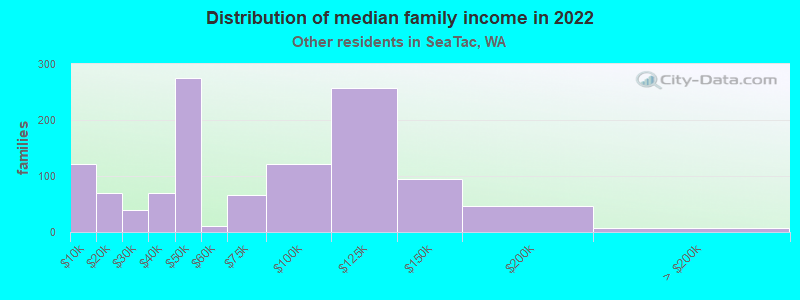
Median family income in SeaTac in 2022:
SeaTac:
$51,991
State:
$72,588
Number of families with income < $10k:
SeaTac:
10.3% (121)
State:
5.5% (5,287)
Number of families with income $10k - 20k:
SeaTac:
5.8% (69)
State:
4.0% (3,814)
Number of families with income $20k - 30k:
SeaTac:
3.3% (39)
State:
6.6% (6,293)
Number of families with income $30k - 40k:
SeaTac:
5.9% (70)
State:
9.2% (8,827)
Number of families with income $40k - 50k:
SeaTac:
23.4% (275)
State:
8.0% (7,634)
Number of families with income $50k - 60k:
SeaTac:
0.9% (11)
State:
7.7% (7,357)
Number of families with income $60k - 75k:
SeaTac:
5.6% (66)
State:
10.3% (9,864)
Number of families with income $75k - 100k:
SeaTac:
10.4% (122)
State:
14.5% (13,800)
Number of families with income $100k - 125k:
SeaTac:
21.9% (257)
State:
12.9% (12,298)
Number of families with income $125k - 150k:
SeaTac:
8.0% (94)
State:
6.0% (5,679)
Number of families with income $150k - 200k:
SeaTac:
4.0% (47)
State:
8.2% (7,822)
Number of families with income > $200k:
SeaTac:
0.6% (7)
Washington:
7.1% (6,764)
Median non-family income in SeaTac in 2022:
SeaTac:
$122,607
State:
$44,777
Median per capita income in SeaTac in 2022:
SeaTac:
$22,676
Washington:
$27,542
Change in median per capita income between 2000 and 2022:
SeaTac, Washington:
+85.7%
State:
+167.8%
Discuss SeaTac, Washington (WA) on our hugely popular Washington forum.