Sherborn, Massachusetts (MA) income map, earnings map, and wages data
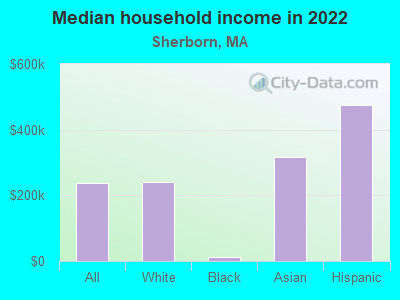
The median household income in Sherborn, MA in 2022 was $237,699, which was 60.2% greater than the median annual income of $94,488 across the entire state of Massachusetts. Compared to the median income of $121,693 in 2000 this represents an increase of 48.8%. The per capita income in 2022 was $120,533, which means an increase of 51.8% compared to 2000 when it was $58,055.
Income statistics for all residents
Median household income in Sherborn, MA in 2022:| Sherborn: | $237,700 |
| State: | $94,488 |
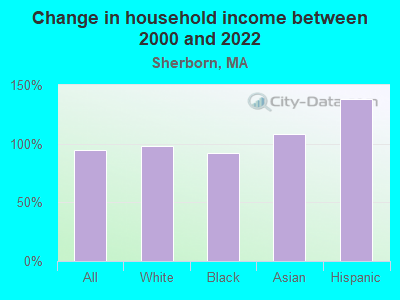
Change in median household income between 2000 and 2022:| Sherborn, Massachusetts: | +95.3% |
| State: | +87.1% |
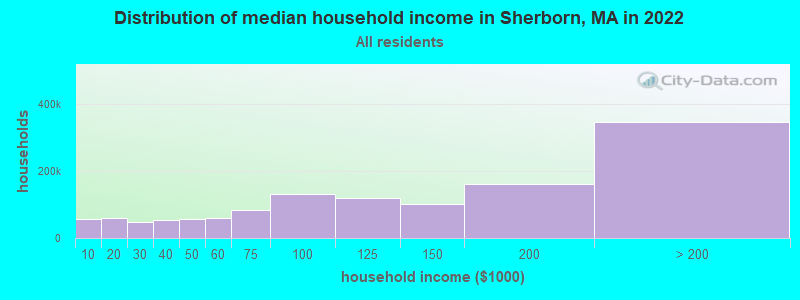
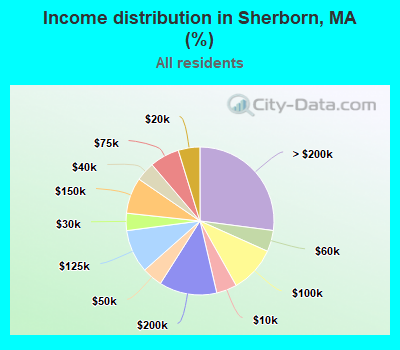
Number of households with income < $10k:| Sherborn: | 4.5% (57,126) |
| State: | 5.2% (146,170) |
Number of households with income $10k - 20k:| Sherborn: | 4.7% (60,428) |
| State: | 6.4% (180,001) |
Number of households with income $20k - 30k:| Sherborn: | 3.8% (48,374) |
| State: | 5.6% (156,667) |
Number of households with income $30k - 40k:| Sherborn: | 4.2% (53,624) |
| Massachusetts: | 5.6% (157,168) |
Number of households with income $40k - 50k:| Sherborn: | 4.5% (57,130) |
| Massachusetts: | 5.4% (151,455) |
Number of households with income $50k - 60k:| Sherborn: | 4.6% (59,341) |
| State: | 5.1% (142,726) |
Number of households with income $60k - 75k:| Sherborn: | 6.5% (83,031) |
| State: | 7.6% (212,203) |
Number of households with income $75k - 100k:| Sherborn: | 10.2% (129,972) |
| State: | 11.3% (317,064) |
Number of households with income $100k - 125k:| Sherborn: | 9.4% (120,565) |
| Massachusetts: | 9.7% (270,603) |
Number of households with income $125k - 150k:| Sherborn: | 7.9% (100,424) |
| Massachusetts: | 8.0% (223,140) |
Number of households with income $150k - 200k:| Sherborn: | 12.6% (161,318) |
| State: | 11.0% (308,695) |
Number of households with income > $200k:| Sherborn: | 27.1% (345,637) |
| State: | 19.0% (531,884) |
Aggregate household income in Sherborn in 2022: $11,667,918,986
Median family income in Sherborn in 2022:| Sherborn: | $277,094 |
| State: | $120,263 |
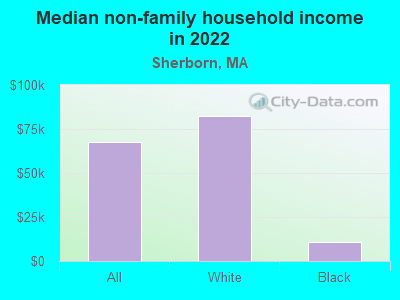
Median non-family income in Sherborn in 2022:| Sherborn: | $67,628 |
| State: | $55,979 |
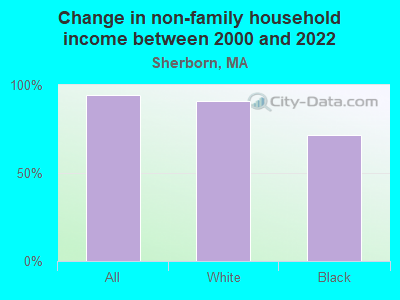
Change in median non-family income between 2000 and 2022:| Sherborn, Massachusetts: | +94.2% |
| State: | +88.0% |
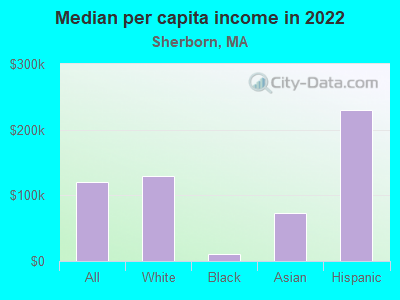
Median per capita income in Sherborn in 2022:| Sherborn: | $120,533 |
| State: | $54,025 |
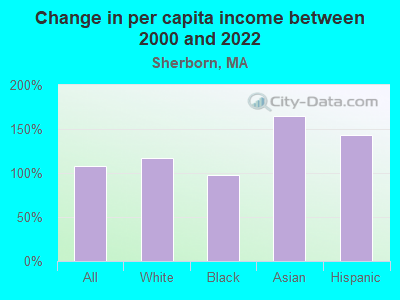
Change in median per capita income between 2000 and 2022:| Sherborn, Massachusetts: | +107.6% |
| State: | +108.2% |
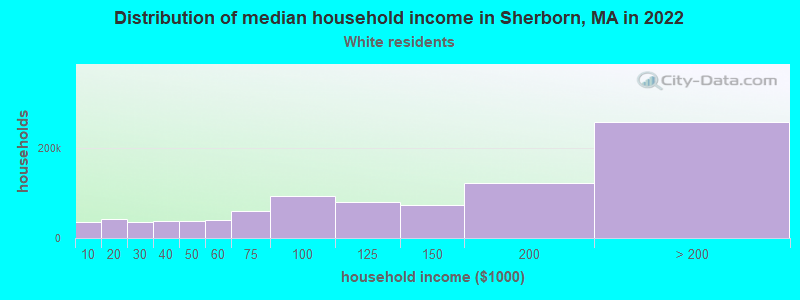
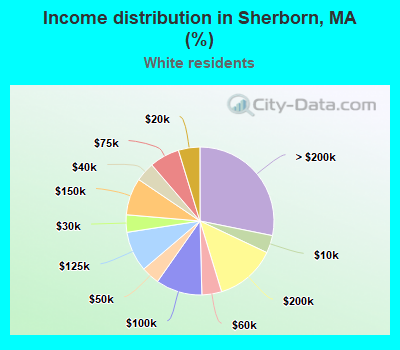
Income statistics for White residents
Median household income in Sherborn, MA in 2022:| Sherborn: | $240,798 |
| Massachusetts: | $101,391 |
Change in median household income between 2000 and 2022:| Sherborn, Massachusetts: | +98.2% |
| State: | +93.3% |
Number of households with income < $10k:| Sherborn: | 3.9% (35,154) |
| State: | 4.4% (91,120) |
Number of households with income $10k - 20k:| Sherborn: | 4.7% (42,853) |
| Massachusetts: | 5.9% (122,055) |
Number of households with income $20k - 30k:| Sherborn: | 3.8% (34,583) |
| State: | 5.1% (105,311) |
Number of households with income $30k - 40k:| Sherborn: | 4.2% (38,554) |
| Massachusetts: | 5.3% (110,239) |
Number of households with income $40k - 50k:| Sherborn: | 4.0% (36,619) |
| Massachusetts: | 5.0% (104,636) |
Number of households with income $50k - 60k:| Sherborn: | 4.3% (39,341) |
| Massachusetts: | 4.8% (99,486) |
Number of households with income $60k - 75k:| Sherborn: | 6.6% (59,955) |
| Massachusetts: | 7.5% (155,124) |
Number of households with income $75k - 100k:| Sherborn: | 10.1% (92,277) |
| State: | 11.4% (236,252) |
Number of households with income $100k - 125k:| Sherborn: | 8.8% (80,125) |
| State: | 9.9% (204,731) |
Number of households with income $125k - 150k:| Sherborn: | 8.1% (74,004) |
| State: | 8.5% (175,324) |
Number of households with income $150k - 200k:| Sherborn: | 13.2% (120,638) |
| State: | 11.7% (242,980) |
Number of households with income > $200k:| Sherborn: | 28.2% (256,658) |
| Massachusetts: | 20.5% (425,966) |
Aggregate household income in Sherborn in 2022: $8,696,884,019
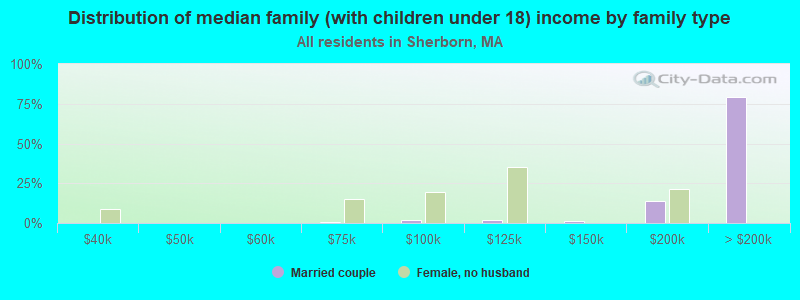
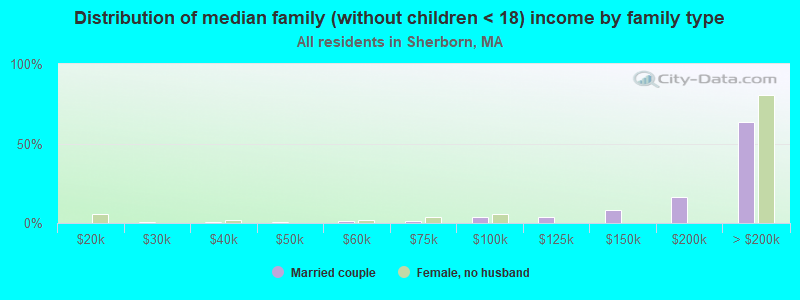
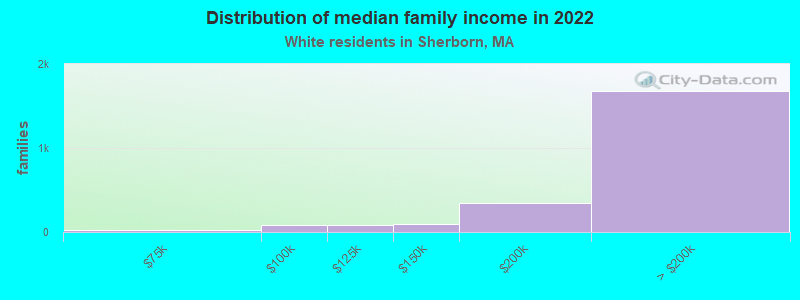
Median family income in Sherborn in 2022:| Sherborn: | $284,162 |
| Massachusetts: | $133,153 |
Number of families with income $10k - 20k:| Sherborn: | 0.3% (6) |
| Massachusetts: | 2.1% (26,403) |
Number of families with income $20k - 30k:| Sherborn: | 0.5% (12) |
| State: | 2.6% (32,525) |
Number of families with income $30k - 40k:| Sherborn: | 0.7% (15) |
| State: | 3.9% (48,079) |
Number of families with income $40k - 50k:| Sherborn: | 0.4% (9) |
| State: | 3.8% (46,908) |
Number of families with income $50k - 60k:| Sherborn: | 0.5% (11) |
| State: | 3.8% (46,476) |
Number of families with income $60k - 75k:| Sherborn: | 1.1% (26) |
| Massachusetts: | 6.4% (79,040) |
Number of families with income $75k - 100k:| Sherborn: | 3.7% (87) |
| Massachusetts: | 11.1% (137,395) |
Number of families with income $100k - 125k:| Sherborn: | 3.4% (80) |
| State: | 11.1% (136,771) |
Number of families with income $125k - 150k:| Sherborn: | 4.0% (96) |
| State: | 10.0% (123,709) |
Number of families with income $150k - 200k:| Sherborn: | 14.8% (351) |
| Massachusetts: | 14.7% (181,602) |
Number of families with income > $200k:| Sherborn: | 70.7% (1,676) |
| State: | 28.5% (351,887) |
Median non-family income in Sherborn in 2022:| Sherborn: | $82,454 |
| Massachusetts: | $59,323 |
Change in median non-family income between 2000 and 2022:| Sherborn, Massachusetts: | +90.7% |
| Massachusetts: | +94.3% |
Median per capita income in Sherborn in 2022:| Sherborn: | $129,095 |
| Massachusetts: | $60,804 |
Change in median per capita income between 2000 and 2022:| Sherborn, Massachusetts: | +117.3% |
| Massachusetts: | +118.7% |
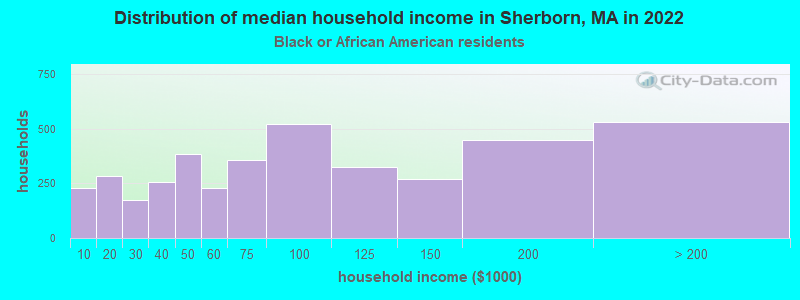
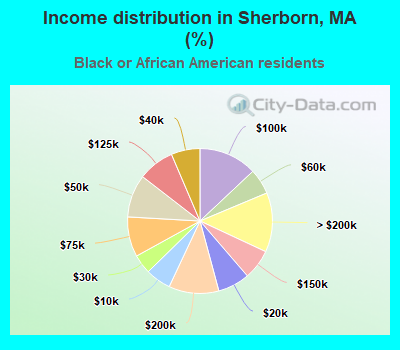
Income statistics for Black or African American residents
Median household income in Sherborn, MA in 2022:| Sherborn: | $12,000 |
| State: | $63,189 |
Change in median household income between 2000 and 2022:| Sherborn, Massachusetts: | +92.0% |
| State: | +87.4% |
Number of households with income < $10k:| Sherborn: | 5.7% (227) |
| Massachusetts: | 9.1% (15,797) |
Number of households with income $10k - 20k:| Sherborn: | 7.1% (285) |
| State: | 9.4% (16,267) |
Number of households with income $20k - 30k:| Sherborn: | 4.3% (173) |
| State: | 7.8% (13,520) |
Number of households with income $30k - 40k:| Sherborn: | 6.4% (257) |
| Massachusetts: | 8.3% (14,412) |
Number of households with income $40k - 50k:| Sherborn: | 9.6% (382) |
| State: | 7.9% (13,790) |
Number of households with income $50k - 60k:| Sherborn: | 5.7% (228) |
| Massachusetts: | 5.8% (10,041) |
Number of households with income $60k - 75k:| Sherborn: | 8.9% (357) |
| State: | 8.5% (14,822) |
Number of households with income $75k - 100k:| Sherborn: | 13.0% (520) |
| State: | 11.0% (19,122) |
Number of households with income $100k - 125k:| Sherborn: | 8.1% (324) |
| State: | 8.4% (14,575) |
Number of households with income $125k - 150k:| Sherborn: | 6.7% (269) |
| State: | 6.0% (10,429) |
Number of households with income $150k - 200k:| Sherborn: | 11.2% (447) |
| Massachusetts: | 7.2% (12,539) |
Number of households with income > $200k:| Sherborn: | 13.3% (530) |
| State: | 10.5% (18,185) |
Aggregate household income in Sherborn in 2022: $259,205
Median non-family income in Sherborn in 2022:| Sherborn: | $10,717 |
| State: | $38,934 |
Change in median non-family income between 2000 and 2022:| Sherborn, Massachusetts: | +71.5% |
| Massachusetts: | +69.2% |
Median per capita income in Sherborn in 2022:| Sherborn: | $10,459 |
| State: | $33,524 |
Change in median per capita income between 2000 and 2022:| Sherborn, Massachusetts: | +98.1% |
| Massachusetts: | +109.4% |
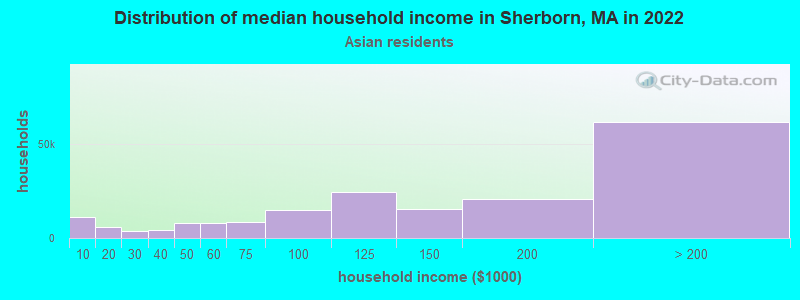
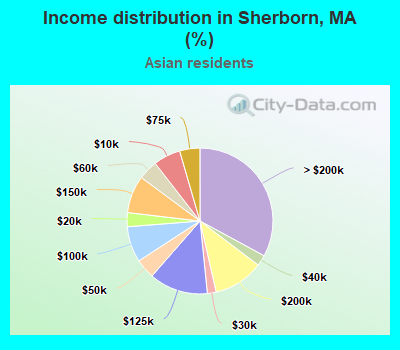
Income statistics for Asian residents
Median household income in Sherborn, MA in 2022:| Sherborn: | $316,968 |
| Massachusetts: | $117,855 |
Change in median household income between 2000 and 2022:| Sherborn, Massachusetts: | +108.1% |
| Massachusetts: | +129.9% |
Number of households with income < $10k:| Sherborn: | 6.0% (11,252) |
| State: | 6.8% (11,982) |
Number of households with income $10k - 20k:| Sherborn: | 3.1% (5,808) |
| State: | 4.8% (8,376) |
Number of households with income $20k - 30k:| Sherborn: | 1.9% (3,641) |
| Massachusetts: | 3.7% (6,558) |
Number of households with income $30k - 40k:| Sherborn: | 2.4% (4,479) |
| State: | 3.3% (5,748) |
Number of households with income $40k - 50k:| Sherborn: | 4.4% (8,181) |
| State: | 4.1% (7,192) |
Number of households with income $50k - 60k:| Sherborn: | 4.3% (8,076) |
| Massachusetts: | 5.0% (8,734) |
Number of households with income $60k - 75k:| Sherborn: | 4.5% (8,406) |
| State: | 5.8% (10,203) |
Number of households with income $75k - 100k:| Sherborn: | 7.9% (14,854) |
| Massachusetts: | 8.6% (15,154) |
Number of households with income $100k - 125k:| Sherborn: | 13.0% (24,357) |
| Massachusetts: | 10.8% (18,942) |
Number of households with income $125k - 150k:| Sherborn: | 8.3% (15,545) |
| Massachusetts: | 8.0% (14,037) |
Number of households with income $150k - 200k:| Sherborn: | 11.1% (20,801) |
| State: | 12.5% (21,856) |
Number of households with income > $200k:| Sherborn: | 32.9% (61,579) |
| State: | 26.6% (46,694) |
Aggregate household income in Sherborn in 2022: $17,022,886
Median family income in Sherborn in 2022:| Sherborn: | $337,809 |
| State: | $140,113 |
Number of families with income $150k - 200k:| Sherborn: | 100.0% (64) |
| State: | 13.2% (15,478) |
Median per capita income in Sherborn in 2022:| Sherborn: | $73,470 |
| State: | $58,900 |
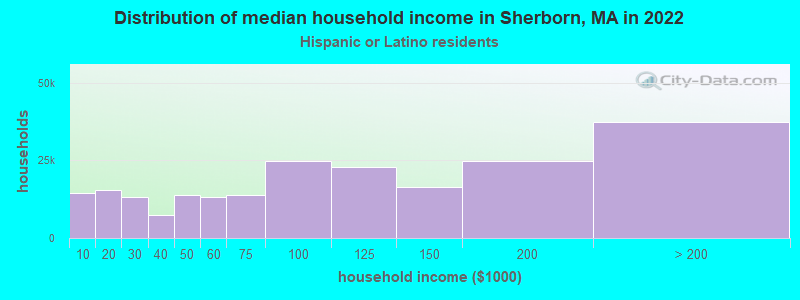
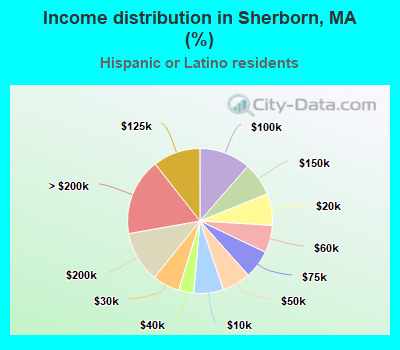
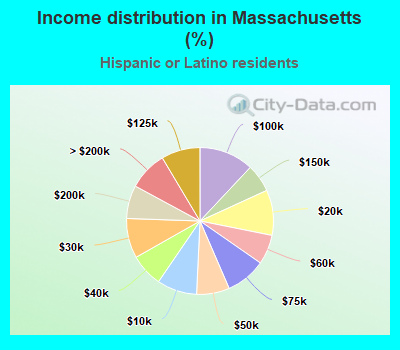
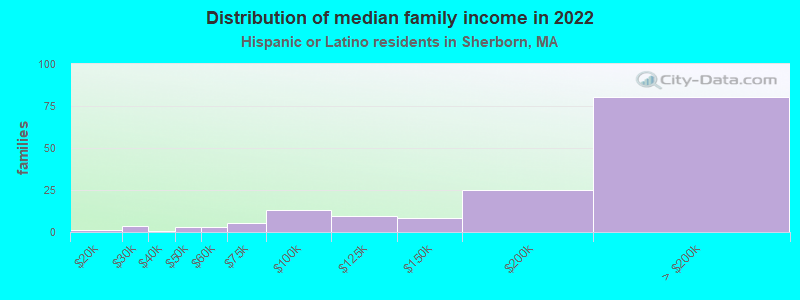
Income statistics for Hispanic or Latino residents
Median household income in Sherborn, MA in 2022:| Sherborn: | $476,178 |
| Massachusetts: | $61,523 |
Change in median household income between 2000 and 2022:| Sherborn, Massachusetts: | +138.1% |
| Massachusetts: | +125.4% |
Number of households with income < $10k:| Sherborn: | 6.6% (14,324) |
| State: | 8.8% (25,307) |
Number of households with income $10k - 20k:| Sherborn: | 7.1% (15,313) |
| State: | 10.0% (28,653) |
Number of households with income $20k - 30k:| Sherborn: | 6.0% (13,101) |
| Massachusetts: | 8.8% (25,189) |
Number of households with income $30k - 40k:| Sherborn: | 3.4% (7,346) |
| Massachusetts: | 7.2% (20,822) |
Number of households with income $40k - 50k:| Sherborn: | 6.4% (13,852) |
| State: | 7.2% (20,817) |
Number of households with income $50k - 60k:| Sherborn: | 6.1% (13,329) |
| State: | 6.5% (18,748) |
Number of households with income $60k - 75k:| Sherborn: | 6.3% (13,676) |
| State: | 8.8% (25,390) |
Number of households with income $75k - 100k:| Sherborn: | 11.4% (24,803) |
| Massachusetts: | 12.0% (34,488) |
Number of households with income $100k - 125k:| Sherborn: | 10.6% (22,975) |
| State: | 8.6% (24,599) |
Number of households with income $125k - 150k:| Sherborn: | 7.5% (16,266) |
| State: | 6.2% (17,743) |
Number of households with income $150k - 200k:| Sherborn: | 11.4% (24,731) |
| State: | 7.3% (21,017) |
Number of households with income > $200k:| Sherborn: | 17.2% (37,309) |
| State: | 8.6% (24,606) |
Aggregate household income in Sherborn in 2022: $23,554,282
Median family income in Sherborn in 2022:| Sherborn: | $462,965 |
| Massachusetts: | $66,072 |
Number of families with income $10k - 20k:| Sherborn: | 0.7% (1) |
| State: | 6.0% (12,071) |
Number of families with income $20k - 30k:| Sherborn: | 2.2% (3) |
| State: | 10.1% (20,376) |
Number of families with income $30k - 40k:| Sherborn: | 0.6% (1) |
| Massachusetts: | 8.2% (16,470) |
Number of families with income $40k - 50k:| Sherborn: | 1.9% (3) |
| State: | 7.4% (14,829) |
Number of families with income $50k - 60k:| Sherborn: | 2.0% (3) |
| State: | 7.3% (14,643) |
Number of families with income $60k - 75k:| Sherborn: | 3.3% (5) |
| State: | 10.6% (21,252) |
Number of families with income $75k - 100k:| Sherborn: | 8.6% (13) |
| State: | 12.0% (24,088) |
Number of families with income $100k - 125k:| Sherborn: | 6.4% (10) |
| State: | 8.9% (17,954) |
Number of families with income $125k - 150k:| Sherborn: | 5.3% (8) |
| State: | 6.9% (13,837) |
Number of families with income $150k - 200k:| Sherborn: | 16.5% (25) |
| State: | 7.3% (14,683) |
Number of families with income > $200k:| Sherborn: | 52.4% (80) |
| State: | 9.3% (18,741) |
Median per capita income in Sherborn in 2022:| Sherborn: | $229,257 |
| State: | $28,993 |
Change in median per capita income between 2000 and 2022:| Sherborn, Massachusetts: | +142.9% |
| State: | +142.4% |