The median household income in Sloan, IA in 2022 was $68,578, which was about the same as the median annual income of $69,588 across the entire state of Iowa. Compared to the median income of $38,026 in 2000 this represents an increase of 44.6%. The per capita income in 2022 was $34,243, which means an increase of 49.4% compared to 2000 when it was $17,310.
Whole page based on the data from 2000 / 2022 when the population of Sloan, Iowa was 1,032 / 1,052
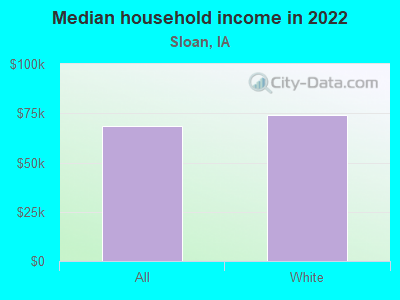
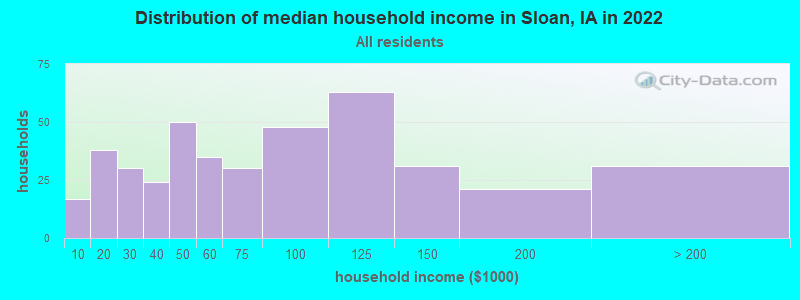
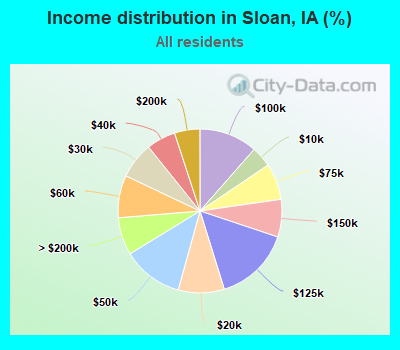
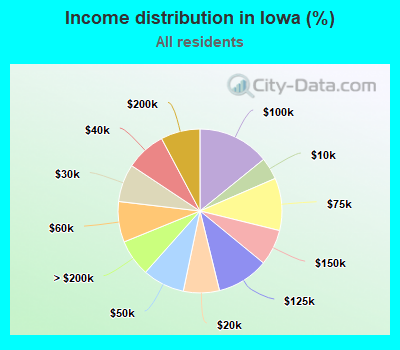
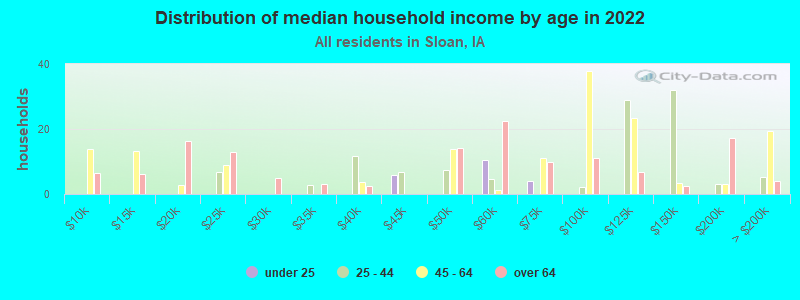
Income statistics for all residents
Median household income in Sloan, IA in 2022:
Sloan:
$68,578
State:
$69,588
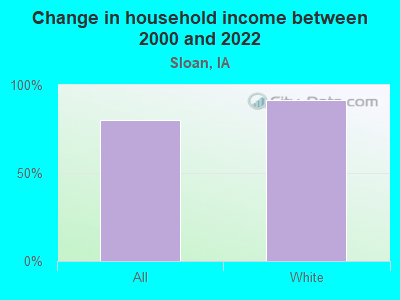
Change in median household income between 2000 and 2022:
Sloan, Iowa:
+80.3%
State:
+76.3%
Number of households with income < $10k:
Sloan:
4.1% (17)
Iowa:
4.3% (57,792)
Number of households with income $10k - 20k:
Sloan:
9.1% (38)
Iowa:
7.1% (94,476)
Number of households with income $20k - 30k:
Sloan:
7.2% (30)
Iowa:
7.5% (99,451)
Number of households with income $30k - 40k:
Sloan:
5.7% (24)
State:
7.9% (105,366)
Number of households with income $40k - 50k:
Sloan:
12.0% (50)
Iowa:
8.3% (110,374)
Number of households with income $50k - 60k:
Sloan:
8.4% (35)
State:
8.0% (106,753)
Number of households with income $60k - 75k:
Sloan:
7.2% (30)
State:
10.3% (137,637)
Number of households with income $75k - 100k:
Sloan:
11.5% (48)
State:
14.2% (188,515)
Number of households with income $100k - 125k:
Sloan:
15.1% (63)
State:
10.3% (136,469)
Number of households with income $125k - 150k:
Sloan:
7.4% (31)
Iowa:
7.1% (94,270)
Number of households with income $150k - 200k:
Sloan:
5.0% (21)
State:
7.8% (103,165)
Number of households with income > $200k:
Sloan:
7.4% (31)
State:
7.3% (96,727)
Aggregate household income in Sloan in 2022: $34,552,378
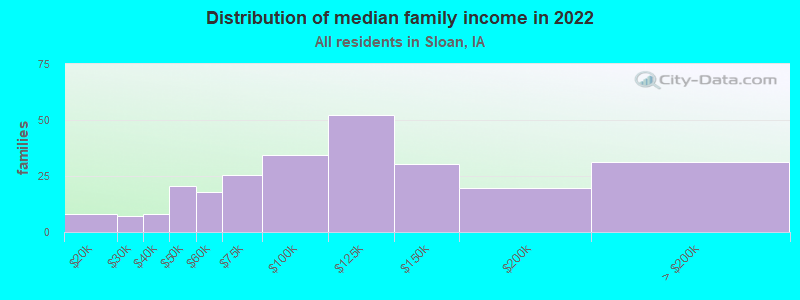
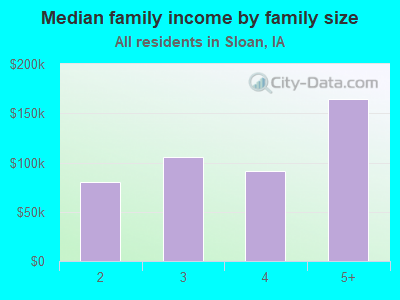
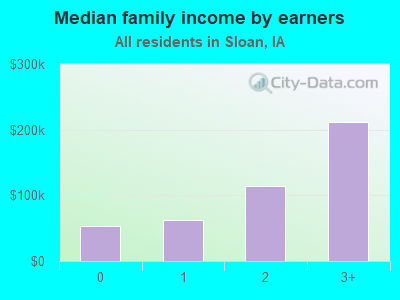
Median family income in Sloan in 2022:
Sloan:
$102,323
State:
$90,851
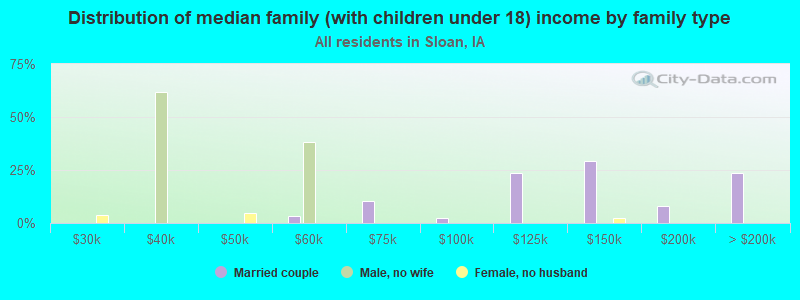
Number of families with income $10k - 20k:
Sloan:
3.1% (8)
State:
3.2% (26,365)
Number of families with income $20k - 30k:
Sloan:
2.9% (7)
State:
4.3% (35,635)
Number of families with income $30k - 40k:
Sloan:
3.2% (8)
Iowa:
5.4% (44,304)
Number of families with income $40k - 50k:
Sloan:
8.0% (20)
Iowa:
6.8% (55,757)
Number of families with income $50k - 60k:
Sloan:
7.0% (18)
State:
6.7% (55,443)
Number of families with income $60k - 75k:
Sloan:
10.0% (26)
Iowa:
10.2% (83,983)
Number of families with income $75k - 100k:
Sloan:
13.4% (34)
State:
16.5% (135,546)
Number of families with income $100k - 125k:
Sloan:
20.5% (52)
State:
13.2% (108,552)
Number of families with income $125k - 150k:
Sloan:
11.8% (30)
Iowa:
9.7% (79,659)
Number of families with income $150k - 200k:
Sloan:
7.7% (20)
State:
11.0% (90,640)
Number of families with income > $200k:
Sloan:
12.3% (31)
State:
10.4% (85,202)
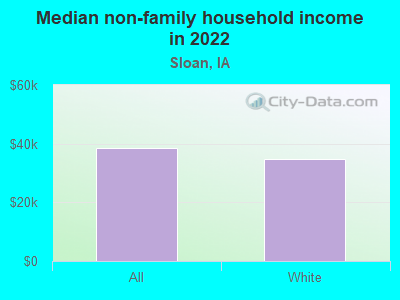
Median non-family income in Sloan in 2022:
Sloan:
$38,438
State:
$41,504
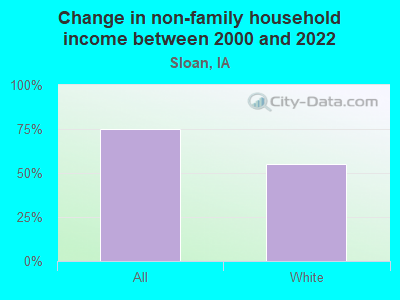
Change in median non-family income between 2000 and 2022:
Sloan, Iowa:
+74.7%
Iowa:
+84.8%
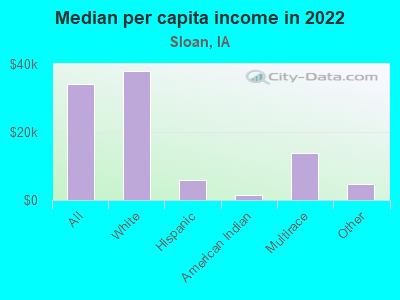
Median per capita income in Sloan in 2022:
Sloan:
$34,243
State:
$38,917
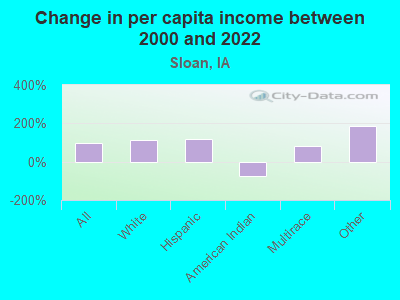
Change in median per capita income between 2000 and 2022:
Sloan, Iowa:
+97.8%
State:
+97.8%
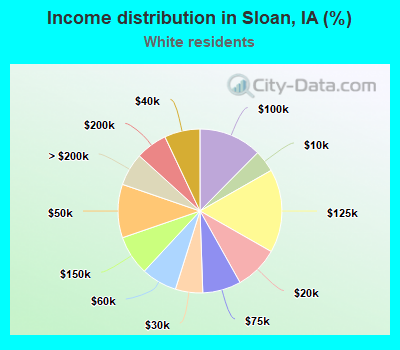
Income statistics for White residents
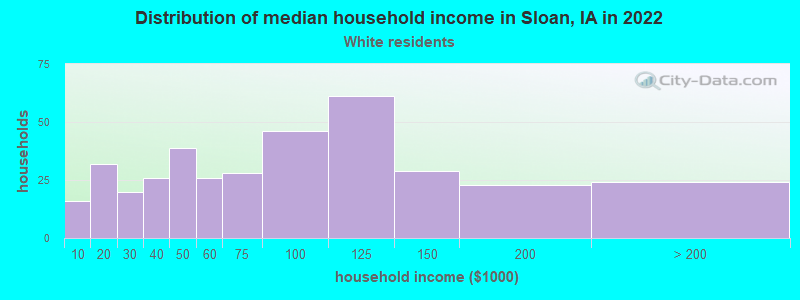
Median household income in Sloan, IA in 2022:
Sloan:
$74,270
State:
$71,725
Change in median household income between 2000 and 2022:
Sloan, Iowa:
+91.3%
State:
+79.7%
Number of households with income < $10k:
Sloan:
4.3% (16)
State:
4.0% (47,459)
Number of households with income $10k - 20k:
Sloan:
8.6% (32)
Iowa:
6.7% (78,901)
Number of households with income $20k - 30k:
Sloan:
5.4% (20)
Iowa:
7.1% (83,759)
Number of households with income $30k - 40k:
Sloan:
7.0% (26)
Iowa:
7.7% (90,779)
Number of households with income $40k - 50k:
Sloan:
10.5% (39)
Iowa:
8.0% (93,777)
Number of households with income $50k - 60k:
Sloan:
7.0% (26)
State:
8.0% (94,176)
Number of households with income $60k - 75k:
Sloan:
7.6% (28)
Iowa:
10.5% (123,053)
Number of households with income $75k - 100k:
Sloan:
12.4% (46)
State:
14.4% (168,483)
Number of households with income $100k - 125k:
Sloan:
16.5% (61)
Iowa:
10.6% (124,515)
Number of households with income $125k - 150k:
Sloan:
7.8% (29)
Iowa:
7.4% (87,043)
Number of households with income $150k - 200k:
Sloan:
6.2% (23)
State:
7.8% (91,953)
Number of households with income > $200k:
Sloan:
6.5% (24)
State:
7.6% (88,587)
Aggregate household income in Sloan in 2022: $31,661,828
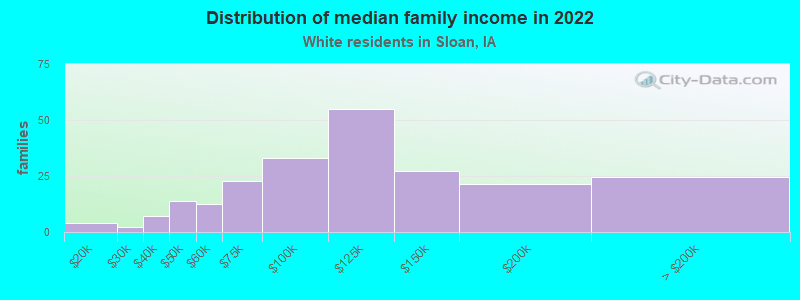
Median family income in Sloan in 2022:
Sloan:
$110,432
State:
$93,591
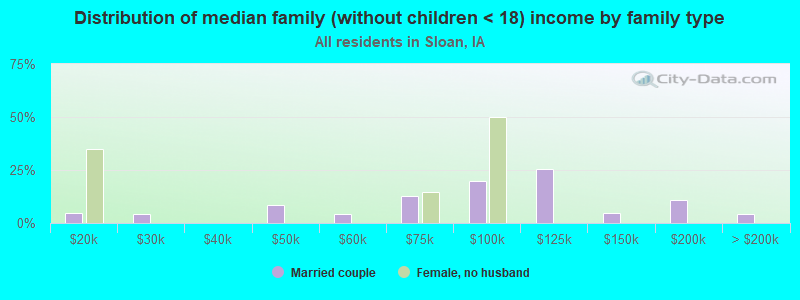
Number of families with income $10k - 20k:
Sloan:
1.9% (4)
State:
2.7% (19,465)
Number of families with income $20k - 30k:
Sloan:
1.0% (2)
State:
4.0% (28,678)
Number of families with income $30k - 40k:
Sloan:
3.2% (7)
State:
5.0% (36,249)
Number of families with income $40k - 50k:
Sloan:
6.2% (14)
State:
6.3% (45,169)
Number of families with income $50k - 60k:
Sloan:
5.6% (12)
State:
6.7% (48,577)
Number of families with income $60k - 75k:
Sloan:
10.2% (23)
State:
10.4% (75,030)
Number of families with income $75k - 100k:
Sloan:
14.8% (33)
State:
16.7% (120,450)
Number of families with income $100k - 125k:
Sloan:
24.5% (55)
State:
13.8% (99,746)
Number of families with income $125k - 150k:
Sloan:
12.1% (27)
State:
10.2% (73,833)
Number of families with income $150k - 200k:
Sloan:
9.5% (21)
Iowa:
11.3% (81,189)
Number of families with income > $200k:
Sloan:
11.0% (25)
State:
10.8% (77,838)
Median non-family income in Sloan in 2022:
Sloan:
$34,657
Iowa:
$41,981
Change in median non-family income between 2000 and 2022:
Sloan, Iowa:
+54.9%
State:
+85.4%
Median per capita income in Sloan in 2022:
Sloan:
$38,023
Iowa:
$41,266
Change in median per capita income between 2000 and 2022:
Sloan, Iowa:
+112.8%
Iowa:
+105.0%
Income statistics for Hispanic or Latino residents
Aggregate household income in Sloan in 2022: $285,543
Median per capita income in Sloan in 2022:
Sloan:
$5,945
State:
$23,112
Change in median per capita income between 2000 and 2022:
Sloan, Iowa:
+117.6%
State:
+113.1%
Income statistics for American Indian and Alaska Native residents
Aggregate household income in Sloan in 2022: $58,699
Median per capita income in Sloan in 2022:
Sloan:
$1,433
State:
$19,255
Change in median per capita income between 2000 and 2022:: -75.2%
Sloan, Iowa:
-75.2%
State:
+50.1%
Income statistics for Multirace residents
Aggregate household income in Sloan in 2022: $1,307,823
Median per capita income in Sloan in 2022:
Sloan:
$13,949
State:
$24,977
Change in median per capita income between 2000 and 2022:
Sloan, Iowa:
+81.7%
State:
+175.6%
Income statistics for other residents
Aggregate household income in Sloan in 2022: $112,624
Median per capita income in Sloan in 2022:
Sloan:
$4,780
State:
$24,763
Discuss Sloan, Iowa (IA) on our hugely popular Iowa forum.