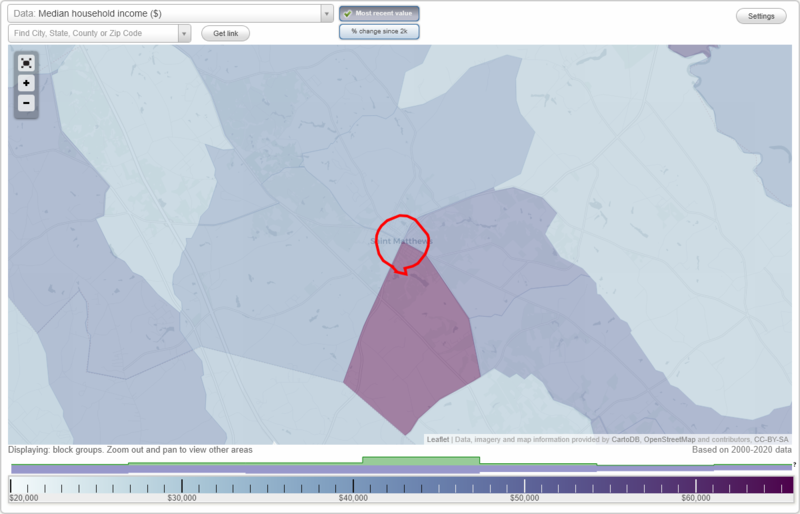
The median household income in St. Matthews, SC in 2022 was $36,228, which was 77.0% less than the median annual income of $64,115 across the entire state of South Carolina. Compared to the median income of $24,969 in 2000 this represents an increase of 31.1%. The per capita income in 2022 was $21,787, which means an increase of 31.6% compared to 2000 when it was $14,911.
Whole page based on the data from 2000 / 2022 when the population of St. Matthews, South Carolina was 2,107 / 1,985
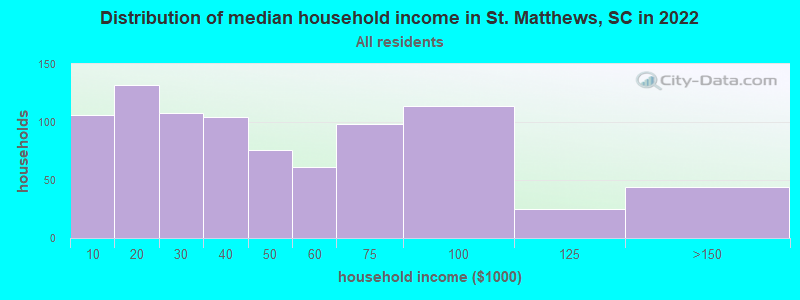
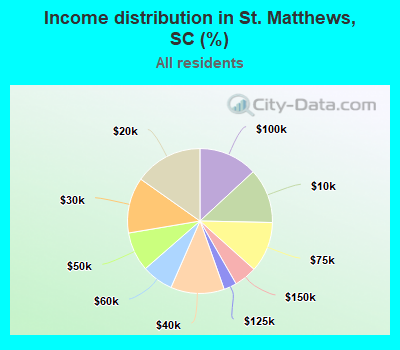
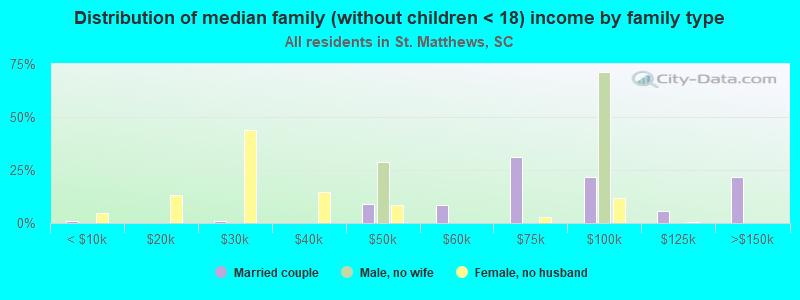
Income statistics for all residents
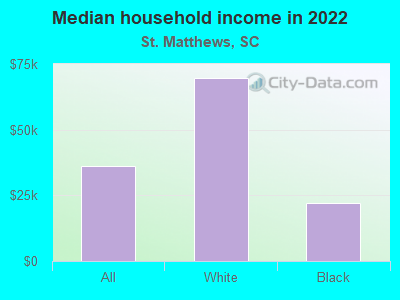
Median household income in St. Matthews, SC in 2022:
St. Matthews:
$36,228
State:
$64,115
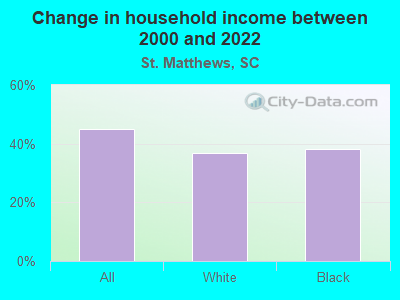
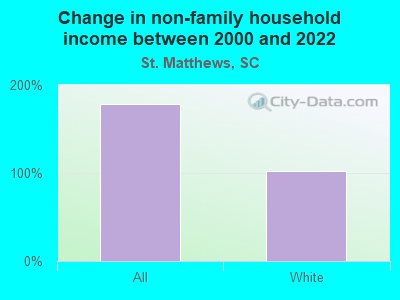
Change in median household income between 2000 and 2022:
St. Matthews, South Carolina:
+45.1%
South Carolina:
+72.9%
Number of households with income < $10k:
St. Matthews:
12.2% (106)
State:
6.1% (130,922)
Number of households with income $10k - 20k:
St. Matthews:
15.2% (132)
South Carolina:
7.9% (168,918)
Number of households with income $20k - 30k:
St. Matthews:
12.4% (108)
State:
8.0% (171,564)
Number of households with income $30k - 40k:
St. Matthews:
12.0% (104)
South Carolina:
9.2% (195,662)
Number of households with income $40k - 50k:
St. Matthews:
8.8% (76)
South Carolina:
8.2% (176,179)
Number of households with income $50k - 60k:
St. Matthews:
7.0% (61)
State:
7.5% (159,159)
Number of households with income $60k - 75k:
St. Matthews:
11.3% (98)
State:
9.9% (211,862)
Number of households with income $75k - 100k:
St. Matthews:
13.1% (114)
State:
13.5% (287,601)
Number of households with income $100k - 125k:
St. Matthews:
2.9% (25)
State:
9.3% (199,068)
Number of households with income $125k - 150k:
St. Matthews:
5.1% (44)
South Carolina:
6.2% (133,330)
Number of households with income $150k - 200k:
St. Matthews:
0.0% (0)
State:
6.6% (141,363)
Number of households with income > $200k:
St. Matthews:
0.0% (0)
State:
7.5% (160,452)
Aggregate household income in St. Matthews in 2022: $40,276,460
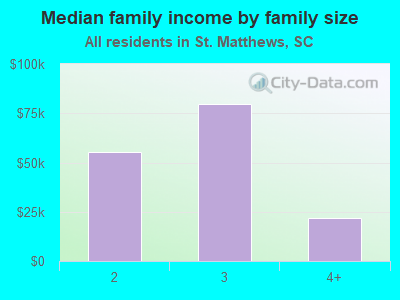
Median family income in St. Matthews in 2022:
St. Matthews:
$43,051
South Carolina:
$79,886
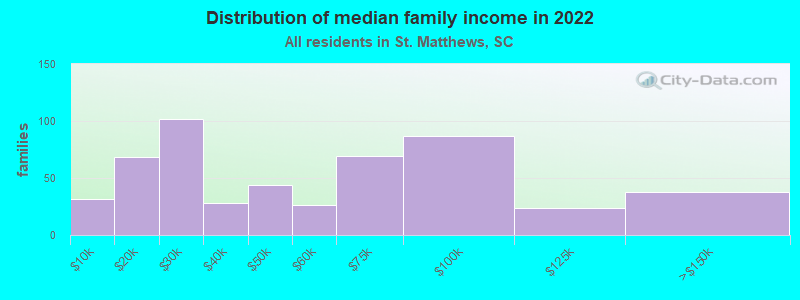
Number of families with income < $10k:
St. Matthews:
6.1% (32)
State:
3.7% (51,214)
Number of families with income $10k - 20k:
St. Matthews:
13.1% (68)
South Carolina:
4.5% (63,460)
Number of families with income $20k - 30k:
St. Matthews:
19.7% (102)
South Carolina:
5.9% (82,415)
Number of families with income $30k - 40k:
St. Matthews:
5.3% (28)
State:
7.5% (105,475)
Number of families with income $40k - 50k:
St. Matthews:
8.5% (44)
State:
7.7% (107,666)
Number of families with income $50k - 60k:
St. Matthews:
5.0% (26)
State:
7.1% (98,803)
Number of families with income $60k - 75k:
St. Matthews:
13.4% (69)
State:
9.9% (138,412)
Number of families with income $75k - 100k:
St. Matthews:
16.7% (87)
State:
15.4% (214,716)
Number of families with income $100k - 125k:
St. Matthews:
4.7% (24)
State:
11.4% (159,999)
Number of families with income $125k - 150k:
St. Matthews:
7.4% (38)
State:
8.0% (112,152)
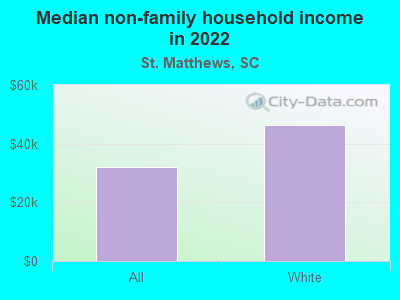
Median non-family income in St. Matthews in 2022:
St. Matthews:
$32,108
State:
$38,426
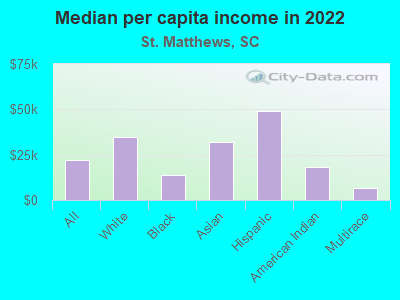
Median per capita income in St. Matthews in 2022:
St. Matthews:
$21,787
South Carolina:
$36,675
Change in median per capita income between 2000 and 2022:
St. Matthews, South Carolina:
+46.1%
South Carolina:
+95.1%
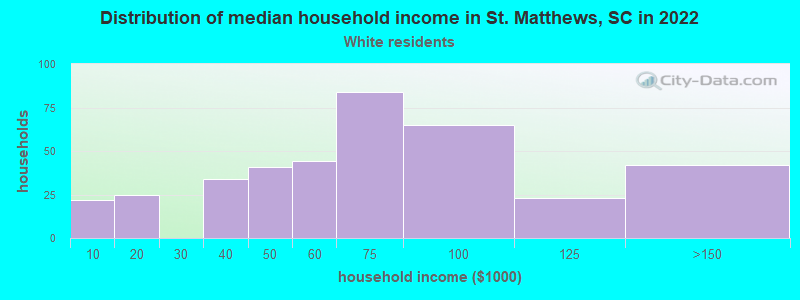
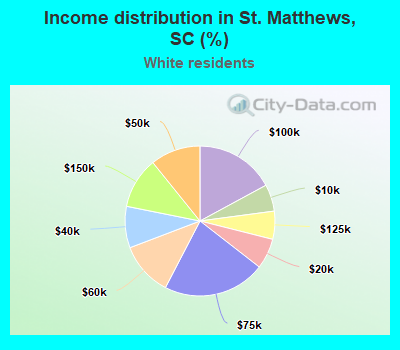
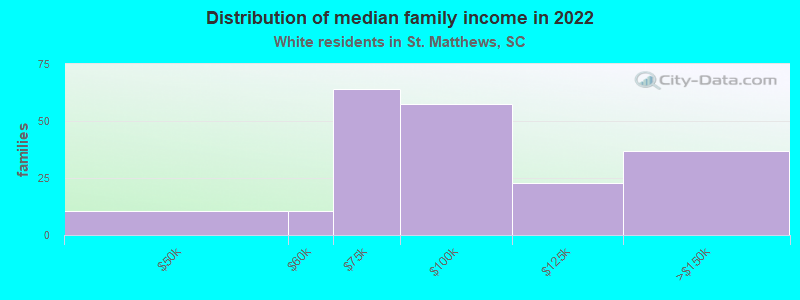
Income statistics for White residents
Median household income in St. Matthews, SC in 2022:
St. Matthews:
$69,671
State:
$73,516
Change in median household income between 2000 and 2022:
St. Matthews, South Carolina:
+36.8%
South Carolina:
+74.8%
Number of households with income < $10k:
St. Matthews:
5.8% (22)
South Carolina:
4.8% (68,379)
Number of households with income $10k - 20k:
St. Matthews:
6.6% (25)
South Carolina:
5.9% (85,105)
Number of households with income $20k - 30k:
St. Matthews:
0.0% (0)
State:
7.1% (101,178)
Number of households with income $30k - 40k:
St. Matthews:
8.9% (34)
State:
8.0% (114,877)
Number of households with income $40k - 50k:
St. Matthews:
10.8% (41)
State:
7.9% (112,749)
Number of households with income $50k - 60k:
St. Matthews:
11.6% (44)
South Carolina:
7.1% (101,835)
Number of households with income $60k - 75k:
St. Matthews:
22.1% (84)
State:
10.2% (145,879)
Number of households with income $75k - 100k:
St. Matthews:
17.1% (65)
South Carolina:
14.0% (200,068)
Number of households with income $100k - 125k:
St. Matthews:
6.1% (23)
State:
10.4% (148,542)
Number of households with income $125k - 150k:
St. Matthews:
11.1% (42)
State:
7.3% (105,118)
Number of households with income $150k - 200k:
St. Matthews:
0.0% (0)
State:
8.0% (114,506)
Number of households with income > $200k:
St. Matthews:
0.0% (0)
State:
9.3% (133,550)
Aggregate household income in St. Matthews in 2022: $25,386,312
Median family income in St. Matthews in 2022:
St. Matthews:
$78,225
South Carolina:
$90,709
Number of families with income $40k - 50k:
St. Matthews:
5.3% (11)
State:
7.0% (66,712)
Number of families with income $50k - 60k:
St. Matthews:
5.3% (11)
State:
6.6% (62,489)
Number of families with income $60k - 75k:
St. Matthews:
31.7% (64)
State:
10.0% (94,724)
Number of families with income $75k - 100k:
St. Matthews:
28.3% (57)
State:
15.5% (147,207)
Number of families with income $100k - 125k:
St. Matthews:
11.3% (23)
State:
12.5% (118,160)
Number of families with income $125k - 150k:
St. Matthews:
18.1% (37)
State:
9.5% (90,395)
Median non-family income in St. Matthews in 2022:
St. Matthews:
$46,304
State:
$42,596
Change in median non-family income between 2000 and 2022:
St. Matthews, South Carolina:
+102.1%
South Carolina:
+74.9%
Median per capita income in St. Matthews in 2022:
St. Matthews:
$34,794
South Carolina:
$42,728
Change in median per capita income between 2000 and 2022:
St. Matthews, South Carolina:
+39.2%
State:
+93.4%
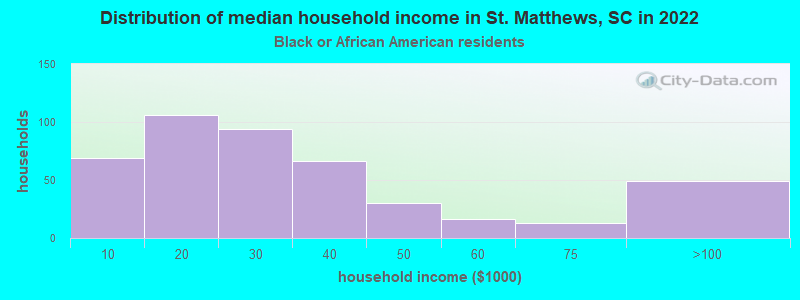
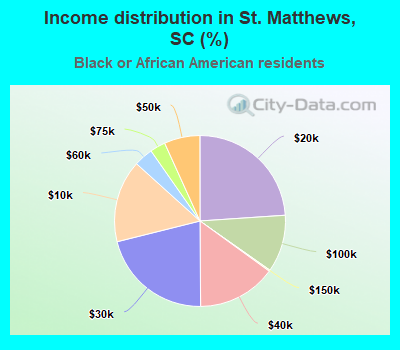
Income statistics for Black or African American residents
Median household income in St. Matthews, SC in 2022:
St. Matthews:
$22,249
South Carolina:
$44,187
Change in median household income between 2000 and 2022:
St. Matthews, South Carolina:
+38.1%
State:
+76.5%
Number of households with income < $10k:
St. Matthews:
15.6% (69)
State:
10.0% (52,303)
Number of households with income $10k - 20k:
St. Matthews:
23.9% (106)
State:
13.4% (69,913)
Number of households with income $20k - 30k:
St. Matthews:
21.2% (94)
State:
10.4% (54,216)
Number of households with income $30k - 40k:
St. Matthews:
14.9% (66)
State:
12.0% (62,722)
Number of households with income $40k - 50k:
St. Matthews:
6.8% (30)
State:
9.2% (47,773)
Number of households with income $50k - 60k:
St. Matthews:
3.6% (16)
State:
8.3% (43,083)
Number of households with income $60k - 75k:
St. Matthews:
2.9% (13)
South Carolina:
9.3% (48,640)
Number of households with income $75k - 100k:
St. Matthews:
10.8% (48)
State:
12.2% (63,723)
Number of households with income $100k - 125k:
St. Matthews:
0.0% (0)
South Carolina:
6.4% (33,117)
Number of households with income $125k - 150k:
St. Matthews:
0.2% (1)
State:
3.2% (16,465)
Number of households with income $150k - 200k:
St. Matthews:
0.0% (0)
State:
3.2% (16,672)
Number of households with income > $200k:
St. Matthews:
0.0% (0)
South Carolina:
2.3% (12,213)
Aggregate household income in St. Matthews in 2022: $13,857,516
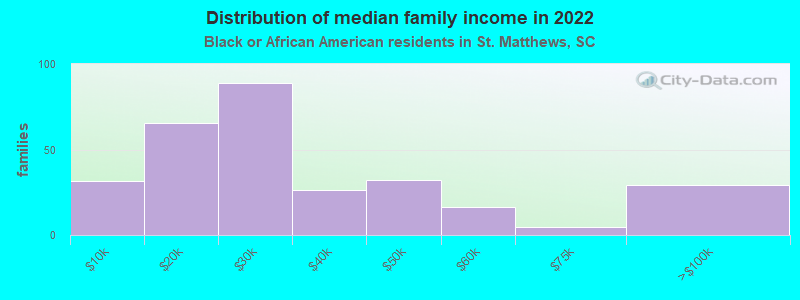
Median family income in St. Matthews in 2022:
St. Matthews:
$21,896
State:
$54,267
Number of families with income < $10k:
St. Matthews:
10.8% (32)
South Carolina:
7.3% (23,752)
Number of families with income $10k - 20k:
St. Matthews:
22.3% (65)
South Carolina:
8.5% (27,789)
Number of families with income $20k - 30k:
St. Matthews:
30.2% (89)
State:
9.4% (30,766)
Number of families with income $30k - 40k:
St. Matthews:
8.9% (26)
State:
11.6% (37,651)
Number of families with income $40k - 50k:
St. Matthews:
11.0% (32)
State:
9.5% (30,858)
Number of families with income $50k - 60k:
St. Matthews:
5.5% (16)
State:
8.7% (28,419)
Number of families with income $60k - 75k:
St. Matthews:
1.6% (5)
South Carolina:
9.6% (31,402)
Number of families with income $75k - 100k:
St. Matthews:
9.5% (28)
South Carolina:
15.2% (49,441)
Number of families with income $125k - 150k:
St. Matthews:
0.3% (1)
State:
3.9% (12,743)
Median per capita income in St. Matthews in 2022:
St. Matthews:
$13,682
State:
$24,863
Change in median per capita income between 2000 and 2022:
St. Matthews, South Carolina:
+43.2%
State:
+111.1%
Income statistics for Asian residents
Median per capita income in St. Matthews in 2022:
St. Matthews:
$32,046
State:
$48,909
Change in median per capita income between 2000 and 2022:
St. Matthews, South Carolina:
+139.5%
State:
+138.1%
Income statistics for Hispanic or Latino residents
Aggregate household income in St. Matthews in 2022: $732,442
Median per capita income in St. Matthews in 2022:
St. Matthews:
$49,139
State:
$23,692
Income statistics for American Indian and Alaska Native residents
Median per capita income in St. Matthews in 2022:
St. Matthews:
$18,449
State:
$26,654
Income statistics for Multirace residents
Aggregate household income in St. Matthews in 2022: $1,206,531
Median per capita income in St. Matthews in 2022:
St. Matthews:
$6,496
State:
$26,391
Change in median per capita income between 2000 and 2022:
St. Matthews, South Carolina:
+125.9%
State:
+120.8%
Discuss St. Matthews, South Carolina (SC) on our hugely popular South Carolina forum.