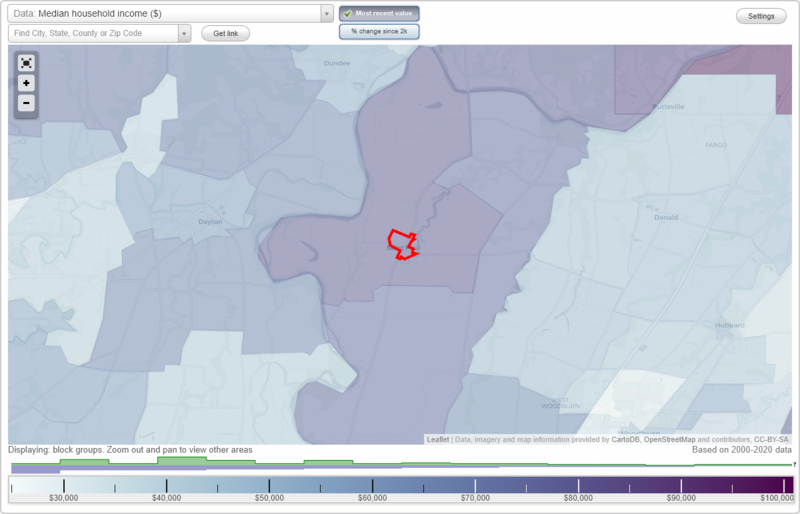
The median household income in St. Paul, OR in 2022 was $109,397, which was 30.8% greater than the median annual income of $75,657 across the entire state of Oregon. Compared to the median income of $43,750 in 2000 this represents an increase of 60.0%. The per capita income in 2022 was $44,057, which means an increase of 56.5% compared to 2000 when it was $19,144.
Whole page based on the data from 2000 / 2022 when the population of St. Paul, Oregon was 354 / 402
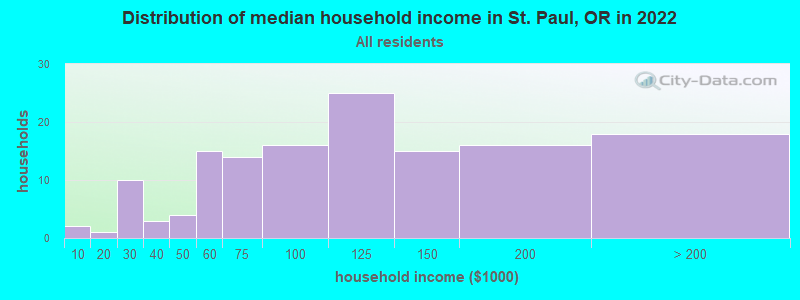
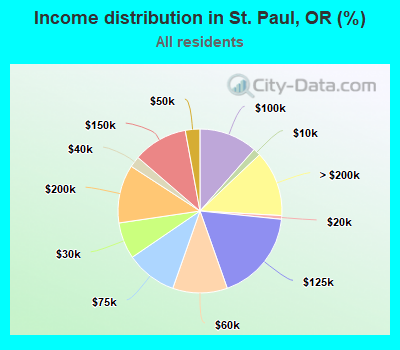
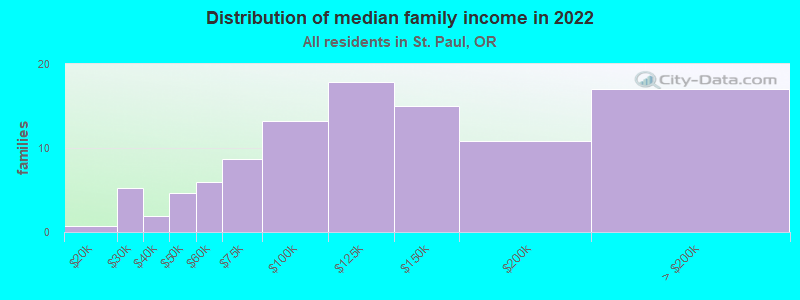
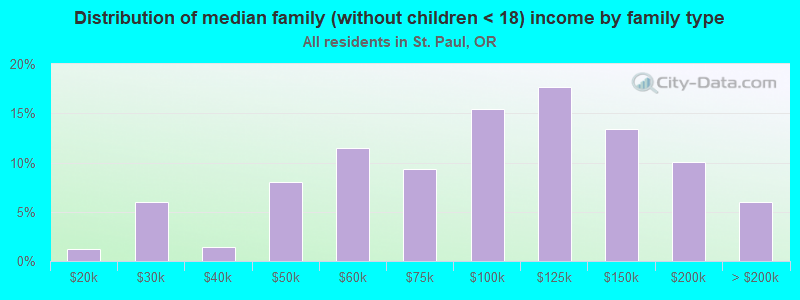
Income statistics for all residents
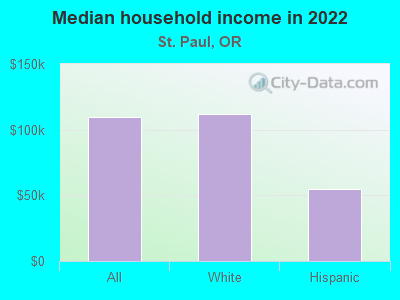
Median household income in St. Paul, OR in 2022:
St. Paul:
$109,398
State:
$75,657
Number of households with income < $10k:
St. Paul:
1.4% (2)
Oregon:
5.1% (87,297)
Number of households with income $10k - 20k:
St. Paul:
0.7% (1)
Oregon:
6.7% (115,299)
Number of households with income $20k - 30k:
St. Paul:
7.2% (10)
State:
6.9% (119,114)
Number of households with income $30k - 40k:
St. Paul:
2.2% (3)
State:
7.1% (122,333)
Number of households with income $40k - 50k:
St. Paul:
2.9% (4)
State:
7.2% (124,562)
Number of households with income $50k - 60k:
St. Paul:
10.8% (15)
State:
6.9% (118,435)
Number of households with income $60k - 75k:
St. Paul:
10.1% (14)
State:
9.8% (168,926)
Number of households with income $75k - 100k:
St. Paul:
11.5% (16)
Oregon:
13.3% (229,104)
Number of households with income $100k - 125k:
St. Paul:
18.0% (25)
State:
10.5% (181,787)
Number of households with income $125k - 150k:
St. Paul:
10.8% (15)
Oregon:
7.4% (127,392)
Number of households with income $150k - 200k:
St. Paul:
11.5% (16)
State:
8.6% (148,614)
Number of households with income > $200k:
St. Paul:
12.9% (18)
Oregon:
10.6% (183,477)
Aggregate household income in St. Paul in 2022: $16,931,167
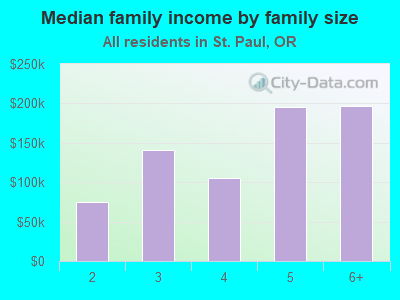
Median family income in St. Paul in 2022:
St. Paul:
$123,044
Oregon:
$93,384
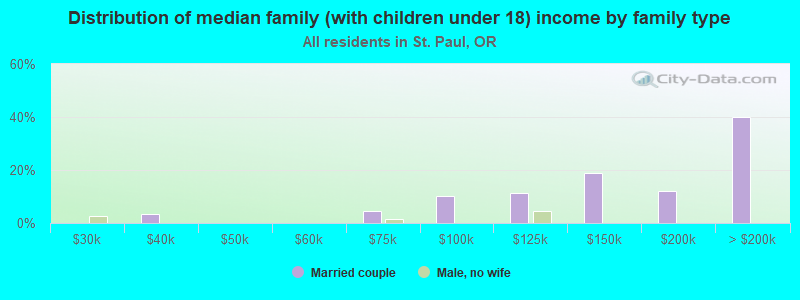
Number of families with income $10k - 20k:
St. Paul:
0.7% (1)
Oregon:
3.0% (31,605)
Number of families with income $20k - 30k:
St. Paul:
5.2% (5)
Oregon:
4.5% (47,306)
Number of families with income $30k - 40k:
St. Paul:
1.9% (2)
State:
5.8% (60,772)
Number of families with income $40k - 50k:
St. Paul:
4.6% (5)
State:
6.4% (66,435)
Number of families with income $50k - 60k:
St. Paul:
5.9% (6)
Oregon:
6.1% (63,915)
Number of families with income $60k - 75k:
St. Paul:
8.6% (9)
Oregon:
9.9% (102,697)
Number of families with income $75k - 100k:
St. Paul:
13.0% (13)
State:
14.3% (148,745)
Number of families with income $100k - 125k:
St. Paul:
17.7% (18)
Oregon:
12.4% (129,023)
Number of families with income $125k - 150k:
St. Paul:
14.9% (15)
State:
8.8% (91,808)
Number of families with income $150k - 200k:
St. Paul:
10.7% (11)
State:
11.3% (117,224)
Number of families with income > $200k:
St. Paul:
16.8% (17)
State:
14.4% (149,534)
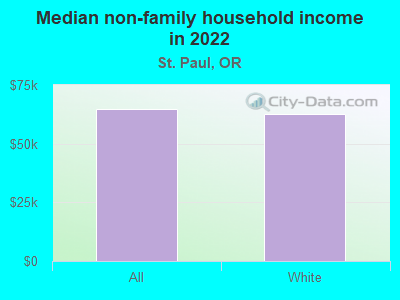
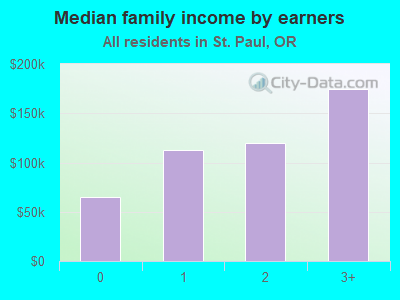
Median non-family income in St. Paul in 2022:
St. Paul:
$64,777
Oregon:
$48,114
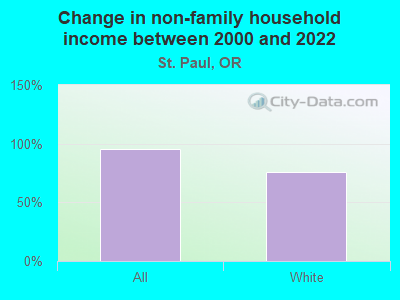
Change in median non-family income between 2000 and 2022:
St. Paul, Oregon:
+95.6%
State:
+86.8%
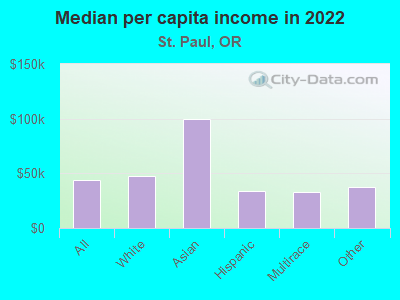
Median per capita income in St. Paul in 2022:
St. Paul:
$44,057
Oregon:
$42,474
Change in median per capita income between 2000 and 2022:
St. Paul, Oregon:
+130.1%
State:
+102.8%
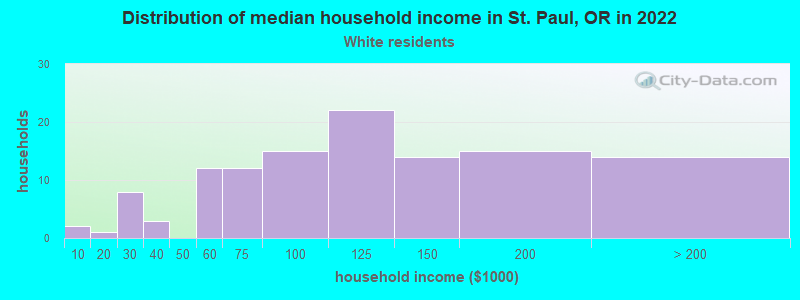
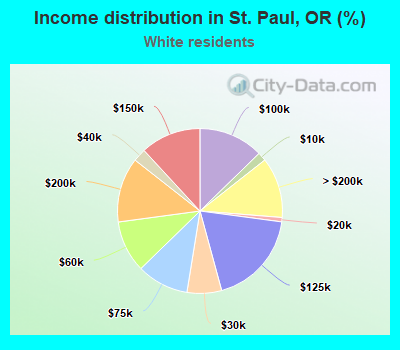
Income statistics for White residents
Median household income in St. Paul, OR in 2022:
St. Paul:
$111,694
State:
$76,846
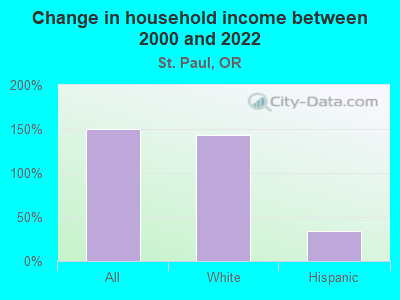
Change in median household income between 2000 and 2022:
St. Paul, Oregon:
+143.4%
State:
+84.8%
Number of households with income < $10k:
St. Paul:
1.7% (2)
Oregon:
4.9% (67,757)
Number of households with income $10k - 20k:
St. Paul:
0.8% (1)
Oregon:
6.6% (91,229)
Number of households with income $20k - 30k:
St. Paul:
6.8% (8)
State:
6.8% (93,981)
Number of households with income $30k - 40k:
St. Paul:
2.5% (3)
State:
6.9% (95,328)
Number of households with income $40k - 50k:
St. Paul:
0.0% (0)
Oregon:
7.2% (100,221)
Number of households with income $50k - 60k:
St. Paul:
10.2% (12)
State:
6.9% (95,294)
Number of households with income $60k - 75k:
St. Paul:
10.2% (12)
State:
9.5% (132,178)
Number of households with income $75k - 100k:
St. Paul:
12.7% (15)
State:
13.5% (187,105)
Number of households with income $100k - 125k:
St. Paul:
18.6% (22)
Oregon:
10.5% (145,264)
Number of households with income $125k - 150k:
St. Paul:
11.9% (14)
Oregon:
7.3% (101,755)
Number of households with income $150k - 200k:
St. Paul:
12.7% (15)
State:
8.7% (121,099)
Number of households with income > $200k:
St. Paul:
11.9% (14)
State:
11.1% (153,992)
Aggregate household income in St. Paul in 2022: $14,731,480
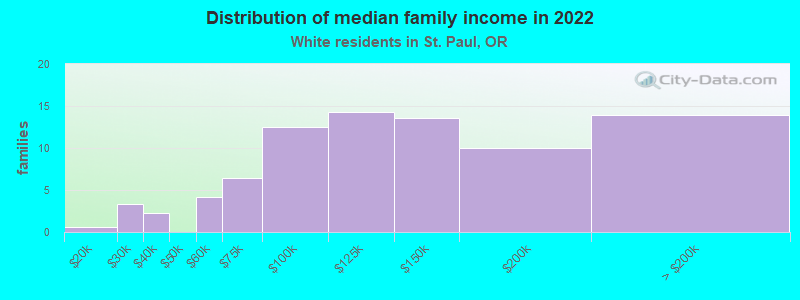
Median family income in St. Paul in 2022:
St. Paul:
$123,639
State:
$95,912
Number of families with income $10k - 20k:
St. Paul:
0.8% (1)
State:
2.8% (23,464)
Number of families with income $20k - 30k:
St. Paul:
4.1% (3)
State:
4.1% (33,830)
Number of families with income $30k - 40k:
St. Paul:
2.8% (2)
State:
5.6% (46,508)
Number of families with income $50k - 60k:
St. Paul:
5.2% (4)
Oregon:
6.0% (49,589)
Number of families with income $60k - 75k:
St. Paul:
7.9% (6)
State:
9.4% (77,838)
Number of families with income $75k - 100k:
St. Paul:
15.5% (13)
State:
14.7% (121,106)
Number of families with income $100k - 125k:
St. Paul:
17.7% (14)
State:
12.3% (101,829)
Number of families with income $125k - 150k:
St. Paul:
16.7% (14)
State:
8.9% (73,376)
Number of families with income $150k - 200k:
St. Paul:
12.3% (10)
Oregon:
11.7% (96,629)
Number of families with income > $200k:
St. Paul:
17.1% (14)
Oregon:
15.2% (125,084)
Median non-family income in St. Paul in 2022:
St. Paul:
$62,514
Oregon:
$48,924
Change in median non-family income between 2000 and 2022:
St. Paul, Oregon:
+76.1%
State:
+88.0%
Median per capita income in St. Paul in 2022:
St. Paul:
$47,639
Oregon:
$45,669
Change in median per capita income between 2000 and 2022:
St. Paul, Oregon:
+127.2%
Oregon:
+106.5%
Income statistics for Asian residents
Median per capita income in St. Paul in 2022:
St. Paul:
$100,135
State:
$52,607
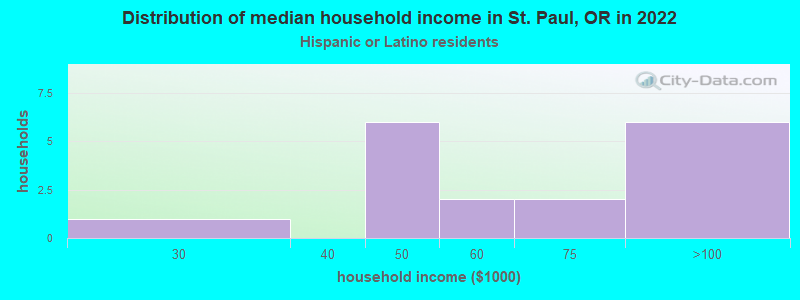
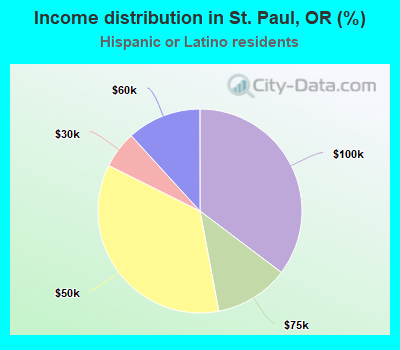
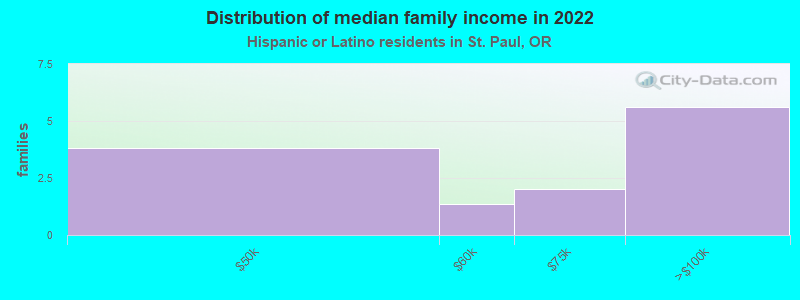
Income statistics for Hispanic or Latino residents
Median household income in St. Paul, OR in 2022:
St. Paul:
$54,564
State:
$65,081
Change in median household income between 2000 and 2022:
St. Paul, Oregon:
+33.6%
State:
+103.9%
Number of households with income < $10k:
St. Paul:
0.0% (0)
State:
5.0% (8,626)
Number of households with income $10k - 20k:
St. Paul:
0.0% (0)
Oregon:
5.4% (9,284)
Number of households with income $20k - 30k:
St. Paul:
5.9% (1)
State:
8.2% (14,265)
Number of households with income $30k - 40k:
St. Paul:
0.0% (0)
Oregon:
9.9% (17,228)
Number of households with income $40k - 50k:
St. Paul:
35.3% (6)
State:
9.2% (16,040)
Number of households with income $50k - 60k:
St. Paul:
11.8% (2)
Oregon:
7.8% (13,499)
Number of households with income $60k - 75k:
St. Paul:
11.8% (2)
Oregon:
12.6% (21,845)
Number of households with income $75k - 100k:
St. Paul:
35.3% (6)
Oregon:
13.6% (23,566)
Number of households with income $100k - 125k:
St. Paul:
0.0% (0)
State:
10.2% (17,704)
Number of households with income $125k - 150k:
St. Paul:
0.0% (0)
State:
5.9% (10,188)
Number of households with income $150k - 200k:
St. Paul:
0.0% (0)
State:
7.1% (12,405)
Number of households with income > $200k:
St. Paul:
0.0% (0)
State:
5.1% (8,851)
Aggregate household income in St. Paul in 2022: $922,418
Median family income in St. Paul in 2022:
St. Paul:
$65,052
State:
$70,541
Number of families with income $40k - 50k:
St. Paul:
29.7% (4)
State:
8.9% (10,692)
Number of families with income $50k - 60k:
St. Paul:
10.6% (1)
State:
7.0% (8,368)
Number of families with income $60k - 75k:
St. Paul:
15.9% (2)
State:
13.7% (16,446)
Number of families with income $75k - 100k:
St. Paul:
43.8% (6)
State:
14.6% (17,572)
Median per capita income in St. Paul in 2022:
St. Paul:
$34,060
Oregon:
$25,274
Change in median per capita income between 2000 and 2022:
St. Paul, Oregon:
+147.5%
Oregon:
+149.8%
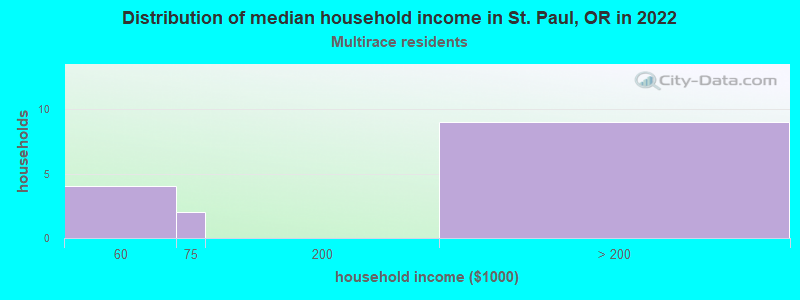
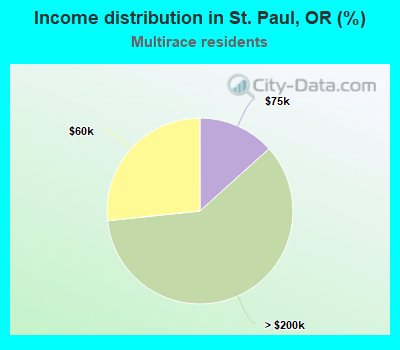
Income statistics for Multirace residents
Number of households with income < $10k:
St. Paul:
0.0% (0)
State:
4.7% (7,092)
Number of households with income $10k - 20k:
St. Paul:
0.0% (0)
Oregon:
7.7% (11,619)
Number of households with income $20k - 30k:
St. Paul:
0.0% (0)
State:
7.4% (11,055)
Number of households with income $30k - 40k:
St. Paul:
0.0% (0)
Oregon:
8.2% (12,256)
Number of households with income $40k - 50k:
St. Paul:
0.0% (0)
Oregon:
7.6% (11,440)
Number of households with income $50k - 60k:
St. Paul:
26.7% (4)
State:
7.9% (11,878)
Number of households with income $60k - 75k:
St. Paul:
13.3% (2)
State:
10.8% (16,149)
Number of households with income $75k - 100k:
St. Paul:
0.0% (0)
State:
13.7% (20,620)
Number of households with income $100k - 125k:
St. Paul:
0.0% (0)
Oregon:
9.7% (14,562)
Number of households with income $125k - 150k:
St. Paul:
0.0% (0)
Oregon:
6.6% (9,976)
Number of households with income $150k - 200k:
St. Paul:
0.0% (0)
State:
8.8% (13,229)
Number of households with income > $200k:
St. Paul:
60.0% (9)
State:
6.8% (10,234)
Aggregate household income in St. Paul in 2022: $1,540,630
Median per capita income in St. Paul in 2022:
St. Paul:
$32,517
Oregon:
$29,750
Income statistics for other residents
Aggregate household income in St. Paul in 2022: $376,003
Median per capita income in St. Paul in 2022:
St. Paul:
$37,545
State:
$25,226
Change in median per capita income between 2000 and 2022:
St. Paul, Oregon:
+143.4%
Oregon:
+162.2%
Discuss St. Paul, Oregon (OR) on our hugely popular Oregon forum.