Sun City, California (CA) income map, earnings map, and wages data
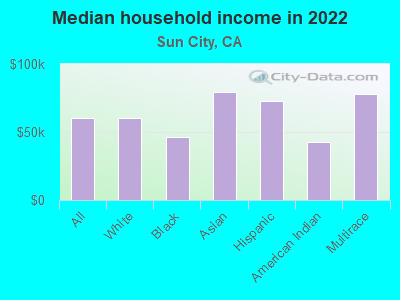
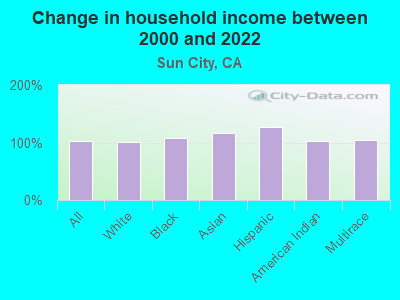
The median household income in Sun City, CA in 2022 was $60,305, which was 51.8% less than the median annual income of $91,551 across the entire state of California. Compared to the median income of $29,814 in 2000 this represents an increase of 50.6%. The per capita income in 2022 was $37,688, which means an increase of 47.3% compared to 2000 when it was $19,859.
Income statistics for all residents
Median household income in Sun City, CA in 2022:| Sun City: | $60,305 |
| California: | $91,551 |
Change in median household income between 2000 and 2022:| Sun City, California: | +102.3% |
| California: | +92.8% |
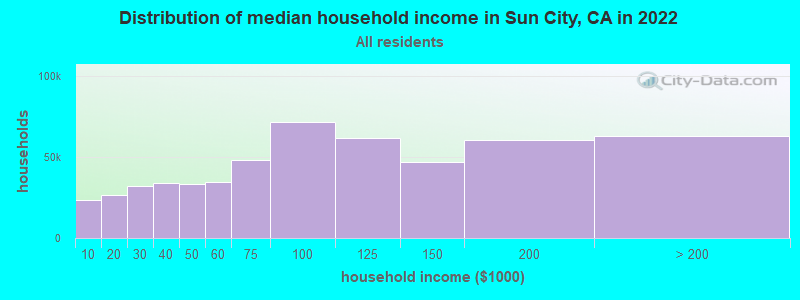
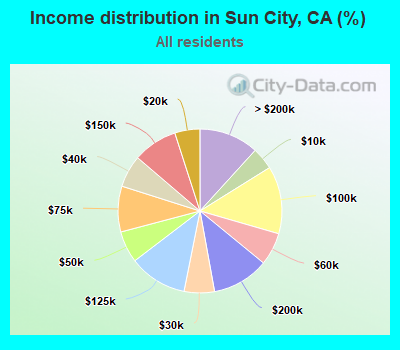
Number of households with income < $10k:| Sun City: | 4.4% (23,405) |
| State: | 4.8% (654,370) |
Number of households with income $10k - 20k:| Sun City: | 4.9% (26,468) |
| California: | 5.8% (789,493) |
Number of households with income $20k - 30k:| Sun City: | 6.0% (31,946) |
| California: | 5.7% (778,318) |
Number of households with income $30k - 40k:| Sun City: | 6.3% (33,945) |
| State: | 5.8% (783,170) |
Number of households with income $40k - 50k:| Sun City: | 6.3% (33,526) |
| California: | 5.8% (781,352) |
Number of households with income $50k - 60k:| Sun City: | 6.4% (34,477) |
| State: | 5.6% (760,175) |
Number of households with income $60k - 75k:| Sun City: | 9.0% (48,275) |
| State: | 8.2% (1,104,699) |
Number of households with income $75k - 100k:| Sun City: | 13.4% (71,437) |
| California: | 12.0% (1,627,633) |
Number of households with income $100k - 125k:| Sun City: | 11.5% (61,478) |
| California: | 10.0% (1,358,619) |
Number of households with income $125k - 150k:| Sun City: | 8.8% (47,021) |
| California: | 7.6% (1,027,455) |
Number of households with income $150k - 200k:| Sun City: | 11.2% (60,076) |
| State: | 10.6% (1,439,811) |
Number of households with income > $200k:| Sun City: | 11.8% (62,865) |
| State: | 18.0% (2,445,491) |
Aggregate household income in Sun City in 2022: $13,436,482,708
Median family income in Sun City in 2022:| Sun City: | $76,076 |
| State: | $104,823 |
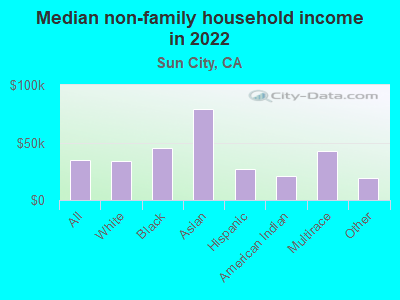
Median non-family income in Sun City in 2022:| Sun City: | $34,610 |
| California: | $59,348 |
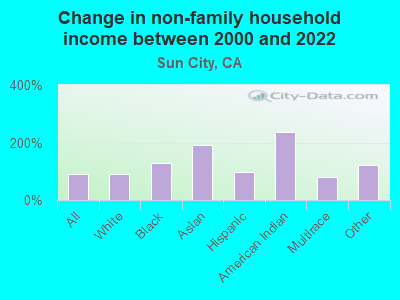
Change in median non-family income between 2000 and 2022:| Sun City, California: | +90.9% |
| California: | +85.3% |
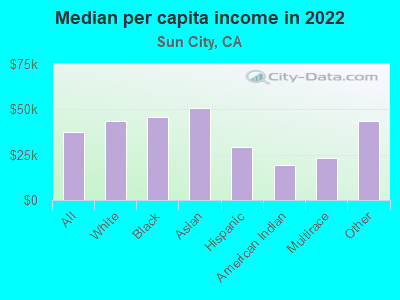
Median per capita income in Sun City in 2022:| Sun City: | $37,688 |
| State: | $46,661 |
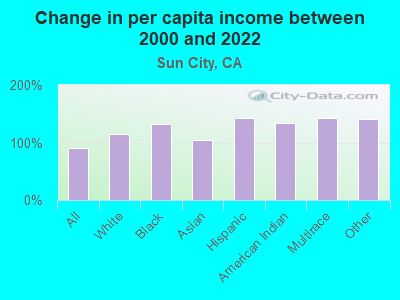
Change in median per capita income between 2000 and 2022:| Sun City, California: | +89.8% |
| California: | +105.5% |
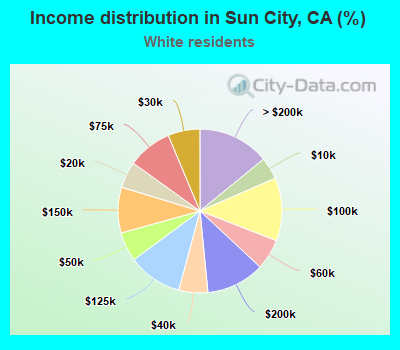
Income statistics for White residents
Median household income in Sun City, CA in 2022:| Sun City: | $60,005 |
| California: | $100,917 |
Change in median household income between 2000 and 2022:| Sun City, California: | +101.4% |
| State: | +96.8% |
Number of households with income < $10k:| Sun City: | 4.4% (10,322) |
| State: | 4.4% (284,109) |
Number of households with income $10k - 20k:| Sun City: | 5.2% (12,376) |
| California: | 5.3% (340,330) |
Number of households with income $20k - 30k:| Sun City: | 6.3% (14,953) |
| State: | 5.3% (343,145) |
Number of households with income $30k - 40k:| Sun City: | 5.7% (13,590) |
| California: | 5.1% (330,146) |
Number of households with income $40k - 50k:| Sun City: | 5.8% (13,721) |
| State: | 5.2% (335,310) |
Number of households with income $50k - 60k:| Sun City: | 6.0% (14,346) |
| State: | 5.1% (326,299) |
Number of households with income $60k - 75k:| Sun City: | 8.8% (20,845) |
| California: | 7.6% (487,640) |
Number of households with income $75k - 100k:| Sun City: | 12.4% (29,532) |
| State: | 11.5% (736,578) |
Number of households with income $100k - 125k:| Sun City: | 10.7% (25,419) |
| California: | 10.1% (648,782) |
Number of households with income $125k - 150k:| Sun City: | 9.0% (21,379) |
| State: | 7.8% (499,671) |
Number of households with income $150k - 200k:| Sun City: | 11.5% (27,272) |
| California: | 11.4% (729,603) |
Number of households with income > $200k:| Sun City: | 14.1% (33,497) |
| California: | 21.2% (1,364,246) |
Aggregate household income in Sun City in 2022: $6,237,524,320
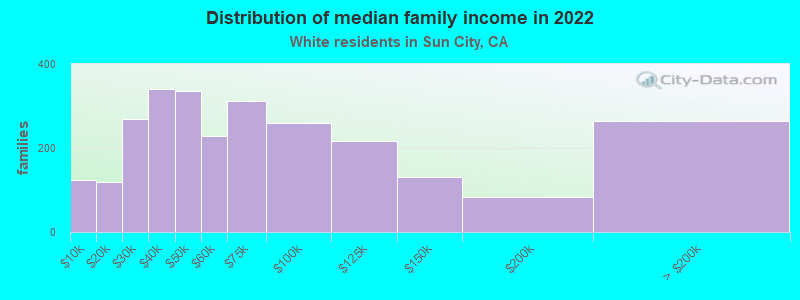
Median family income in Sun City in 2022:| Sun City: | $77,897 |
| State: | $125,379 |
Number of families with income < $10k:| Sun City: | 4.6% (123) |
| California: | 2.2% (87,079) |
Number of families with income $10k - 20k:| Sun City: | 4.4% (119) |
| State: | 2.5% (97,716) |
Number of families with income $20k - 30k:| Sun City: | 10.0% (269) |
| California: | 3.5% (137,295) |
Number of families with income $30k - 40k:| Sun City: | 12.7% (340) |
| State: | 3.9% (152,947) |
Number of families with income $40k - 50k:| Sun City: | 12.5% (336) |
| State: | 4.3% (169,197) |
Number of families with income $50k - 60k:| Sun City: | 8.5% (228) |
| State: | 4.5% (176,192) |
Number of families with income $60k - 75k:| Sun City: | 11.6% (312) |
| California: | 7.0% (274,752) |
Number of families with income $75k - 100k:| Sun City: | 9.7% (260) |
| State: | 11.3% (445,632) |
Number of families with income $100k - 125k:| Sun City: | 8.1% (216) |
| State: | 10.7% (423,630) |
Number of families with income $125k - 150k:| Sun City: | 4.9% (131) |
| California: | 9.1% (357,408) |
Number of families with income $150k - 200k:| Sun City: | 3.1% (83) |
| State: | 13.5% (532,693) |
Number of families with income > $200k:| Sun City: | 9.9% (265) |
| State: | 27.6% (1,086,948) |
Median non-family income in Sun City in 2022:| Sun City: | $33,781 |
| State: | $62,819 |
Change in median non-family income between 2000 and 2022:| Sun City, California: | +89.2% |
| State: | +84.4% |
Median per capita income in Sun City in 2022:| Sun City: | $43,735 |
| State: | $61,706 |
Change in median per capita income between 2000 and 2022:| Sun City, California: | +114.2% |
| State: | +122.7% |
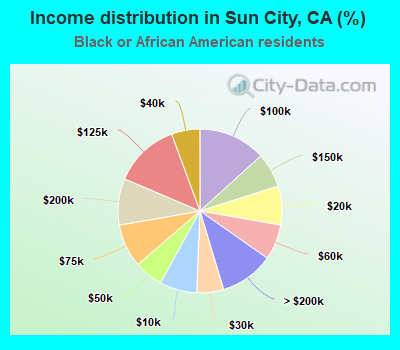
Income statistics for Black or African American residents
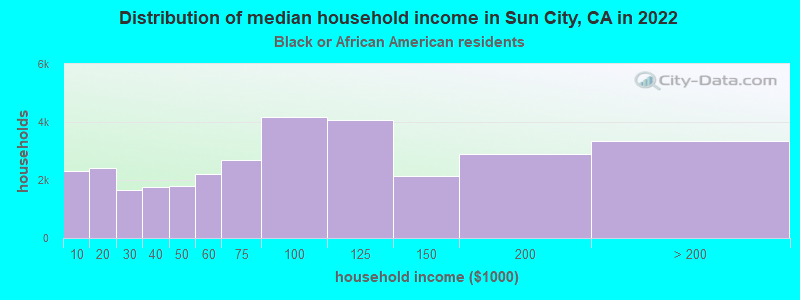
Median household income in Sun City, CA in 2022:| Sun City: | $46,237 |
| State: | $63,268 |
Change in median household income between 2000 and 2022:| Sun City, California: | +106.7% |
| State: | +81.0% |
Number of households with income < $10k:| Sun City: | 7.4% (2,318) |
| California: | 9.0% (73,219) |
Number of households with income $10k - 20k:| Sun City: | 7.7% (2,412) |
| California: | 10.6% (86,666) |
Number of households with income $20k - 30k:| Sun City: | 5.3% (1,667) |
| California: | 7.1% (57,719) |
Number of households with income $30k - 40k:| Sun City: | 5.6% (1,766) |
| California: | 7.2% (58,714) |
Number of households with income $40k - 50k:| Sun City: | 5.7% (1,793) |
| California: | 7.1% (58,075) |
Number of households with income $50k - 60k:| Sun City: | 7.0% (2,194) |
| State: | 6.8% (55,229) |
Number of households with income $60k - 75k:| Sun City: | 8.5% (2,688) |
| State: | 8.8% (71,895) |
Number of households with income $75k - 100k:| Sun City: | 13.3% (4,188) |
| State: | 11.9% (96,893) |
Number of households with income $100k - 125k:| Sun City: | 13.0% (4,085) |
| State: | 8.7% (70,729) |
Number of households with income $125k - 150k:| Sun City: | 6.8% (2,147) |
| California: | 6.3% (51,211) |
Number of households with income $150k - 200k:| Sun City: | 9.2% (2,893) |
| State: | 7.2% (58,687) |
Number of households with income > $200k:| Sun City: | 10.6% (3,345) |
| California: | 9.3% (75,487) |
Aggregate household income in Sun City in 2022: $25,991,887
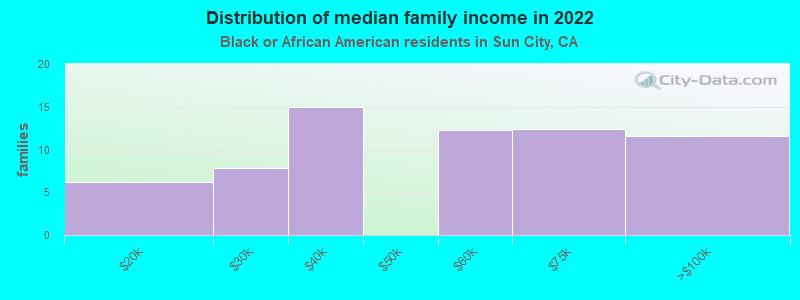
Median family income in Sun City in 2022:| Sun City: | $65,692 |
| California: | $77,263 |
Number of families with income $10k - 20k:| Sun City: | 9.5% (6) |
| California: | 6.4% (29,505) |
Number of families with income $20k - 30k:| Sun City: | 12.1% (8) |
| State: | 5.6% (25,755) |
Number of families with income $30k - 40k:| Sun City: | 23.0% (15) |
| State: | 6.8% (30,948) |
Number of families with income $50k - 60k:| Sun City: | 18.8% (12) |
| State: | 7.0% (31,860) |
Number of families with income $60k - 75k:| Sun City: | 19.0% (12) |
| State: | 8.7% (40,021) |
Number of families with income $75k - 100k:| Sun City: | 17.8% (12) |
| State: | 12.4% (56,846) |
Median non-family income in Sun City in 2022:| Sun City: | $45,428 |
| State: | $41,942 |
Change in median non-family income between 2000 and 2022:| Sun City, California: | +129.1% |
| California: | +72.0% |
Median per capita income in Sun City in 2022:| Sun City: | $45,711 |
| California: | $36,708 |
Change in median per capita income between 2000 and 2022:| Sun City, California: | +132.5% |
| State: | +110.4% |
Income statistics for Asian residents
Median household income in Sun City, CA in 2022:| Sun City: | $79,395 |
| California: | $119,861 |
Change in median household income between 2000 and 2022:| Sun City, California: | +115.7% |
| State: | +116.5% |
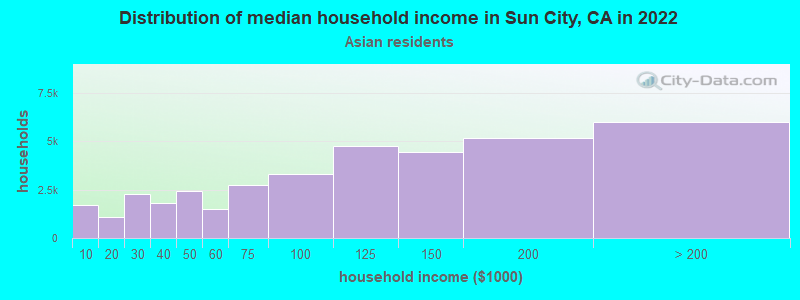
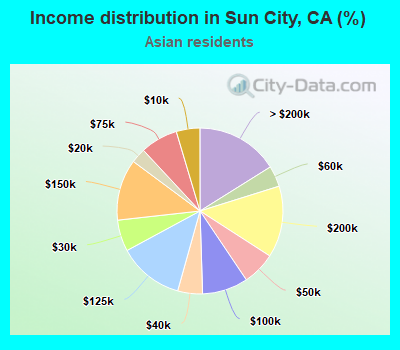
Number of households with income < $10k:| Sun City: | 4.6% (1,720) |
| State: | 5.1% (106,273) |
Number of households with income $10k - 20k:| Sun City: | 2.9% (1,079) |
| State: | 4.9% (101,815) |
Number of households with income $20k - 30k:| Sun City: | 6.1% (2,288) |
| State: | 4.6% (94,414) |
Number of households with income $30k - 40k:| Sun City: | 4.8% (1,806) |
| State: | 4.1% (84,491) |
Number of households with income $40k - 50k:| Sun City: | 6.5% (2,409) |
| State: | 4.0% (81,758) |
Number of households with income $50k - 60k:| Sun City: | 4.1% (1,524) |
| State: | 3.9% (80,971) |
Number of households with income $60k - 75k:| Sun City: | 7.3% (2,732) |
| State: | 6.0% (124,194) |
Number of households with income $75k - 100k:| Sun City: | 8.9% (3,329) |
| State: | 9.7% (200,337) |
Number of households with income $100k - 125k:| Sun City: | 12.8% (4,764) |
| State: | 9.4% (193,488) |
Number of households with income $125k - 150k:| Sun City: | 11.9% (4,452) |
| California: | 7.7% (158,253) |
Number of households with income $150k - 200k:| Sun City: | 13.9% (5,201) |
| State: | 12.2% (252,139) |
Number of households with income > $200k:| Sun City: | 16.1% (6,007) |
| State: | 28.4% (586,641) |
Aggregate household income in Sun City in 2022: $15,843,609
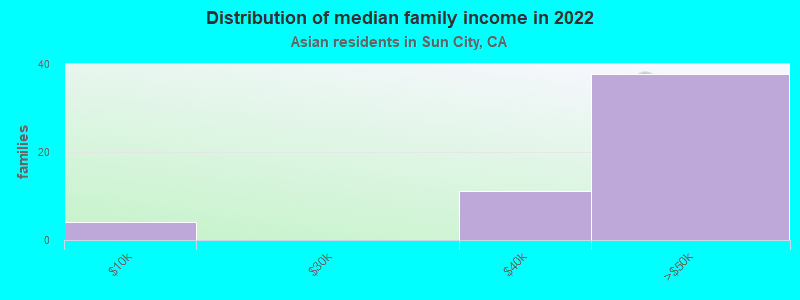
Median family income in Sun City in 2022:| Sun City: | $84,756 |
| State: | $136,040 |
Number of families with income < $10k:| Sun City: | 7.8% (4) |
| California: | 2.8% (42,046) |
Number of families with income $30k - 40k:| Sun City: | 21.1% (11) |
| State: | 3.7% (55,234) |
Number of families with income $40k - 50k:| Sun City: | 71.1% (38) |
| State: | 3.9% (58,471) |
Median non-family income in Sun City in 2022:| Sun City: | $78,770 |
| California: | $74,216 |
Median per capita income in Sun City in 2022:| Sun City: | $50,620 |
| California: | $58,824 |
Change in median per capita income between 2000 and 2022:| Sun City, California: | +104.0% |
| California: | +166.8% |
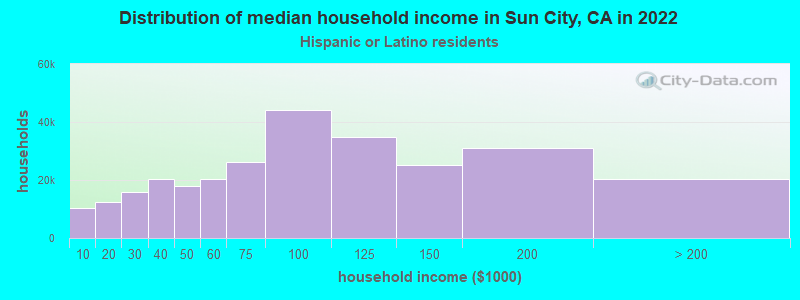
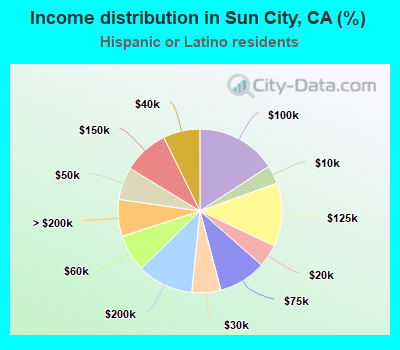
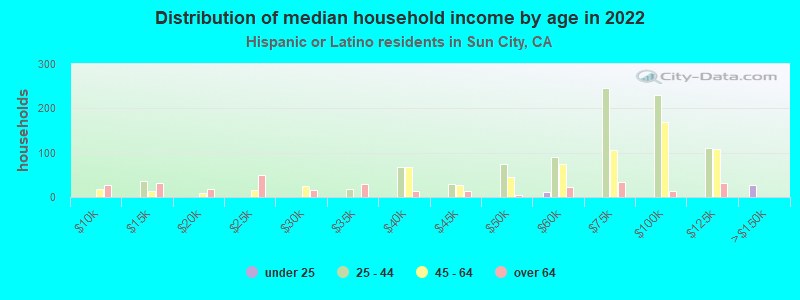
Income statistics for Hispanic or Latino residents
Median household income in Sun City, CA in 2022:| Sun City: | $72,611 |
| State: | $75,698 |
Change in median household income between 2000 and 2022:| Sun City, California: | +126.6% |
| California: | +107.2% |
Number of households with income < $10k:| Sun City: | 3.7% (10,246) |
| California: | 4.3% (183,294) |
Number of households with income $10k - 20k:| Sun City: | 4.5% (12,572) |
| State: | 6.0% (253,903) |
Number of households with income $20k - 30k:| Sun City: | 5.7% (15,992) |
| State: | 6.8% (286,386) |
Number of households with income $30k - 40k:| Sun City: | 7.3% (20,316) |
| California: | 7.4% (313,728) |
Number of households with income $40k - 50k:| Sun City: | 6.5% (18,071) |
| California: | 7.4% (313,199) |
Number of households with income $50k - 60k:| Sun City: | 7.3% (20,491) |
| State: | 7.2% (305,366) |
Number of households with income $60k - 75k:| Sun City: | 9.4% (26,272) |
| State: | 10.3% (434,937) |
Number of households with income $75k - 100k:| Sun City: | 15.9% (44,290) |
| California: | 14.4% (607,302) |
Number of households with income $100k - 125k:| Sun City: | 12.5% (34,870) |
| State: | 10.6% (447,424) |
Number of households with income $125k - 150k:| Sun City: | 9.0% (25,141) |
| State: | 7.5% (316,022) |
Number of households with income $150k - 200k:| Sun City: | 11.0% (30,869) |
| California: | 9.2% (386,269) |
Number of households with income > $200k:| Sun City: | 7.3% (20,298) |
| State: | 8.8% (372,651) |
Aggregate household income in Sun City in 2022: $366,848,395
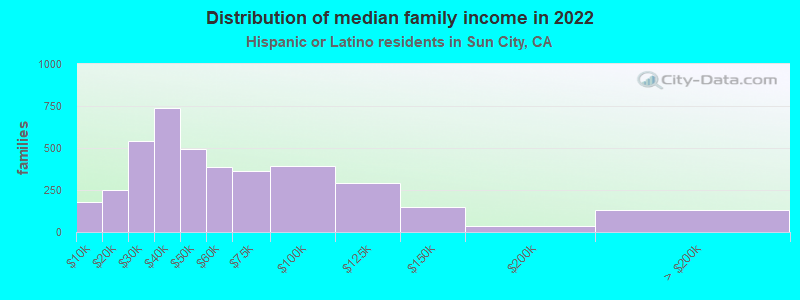
Median family income in Sun City in 2022:| Sun City: | $81,000 |
| State: | $77,589 |
Number of families with income < $10k:| Sun City: | 4.5% (177) |
| State: | 3.9% (129,468) |
Number of families with income $10k - 20k:| Sun City: | 6.4% (252) |
| California: | 4.6% (151,997) |
Number of families with income $20k - 30k:| Sun City: | 13.8% (544) |
| State: | 6.6% (216,764) |
Number of families with income $30k - 40k:| Sun City: | 18.6% (737) |
| State: | 7.6% (249,849) |
Number of families with income $40k - 50k:| Sun City: | 12.5% (494) |
| State: | 7.7% (254,822) |
Number of families with income $50k - 60k:| Sun City: | 9.7% (385) |
| State: | 7.4% (244,815) |
Number of families with income $60k - 75k:| Sun City: | 9.2% (364) |
| State: | 10.5% (345,838) |
Number of families with income $75k - 100k:| Sun City: | 10.0% (394) |
| State: | 14.9% (491,589) |
Number of families with income $100k - 125k:| Sun City: | 7.3% (290) |
| State: | 10.7% (355,400) |
Number of families with income $125k - 150k:| Sun City: | 3.7% (146) |
| California: | 7.8% (259,317) |
Number of families with income $150k - 200k:| Sun City: | 1.0% (38) |
| State: | 9.3% (306,566) |
Number of families with income > $200k:| Sun City: | 3.3% (132) |
| State: | 9.1% (299,984) |
Median non-family income in Sun City in 2022:| Sun City: | $27,082 |
| California: | $49,746 |
Change in median non-family income between 2000 and 2022:| Sun City, California: | +97.0% |
| California: | +100.7% |
Median per capita income in Sun City in 2022:| Sun City: | $29,099 |
| State: | $27,240 |
Change in median per capita income between 2000 and 2022:| Sun City, California: | +141.6% |
| State: | +133.3% |
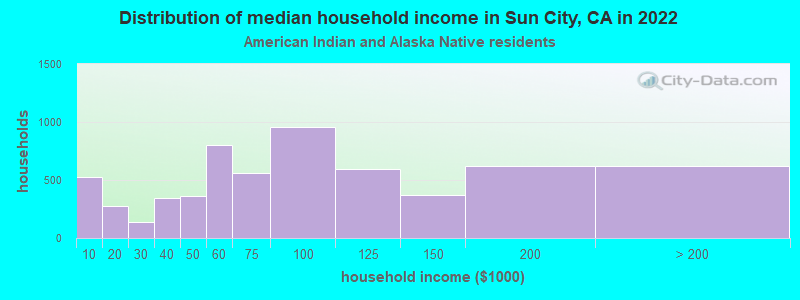
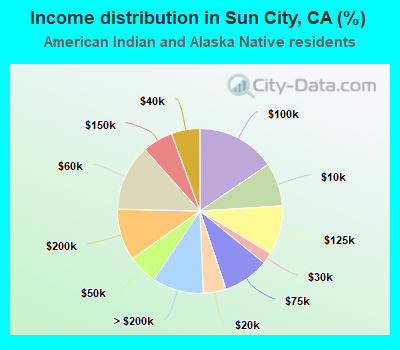
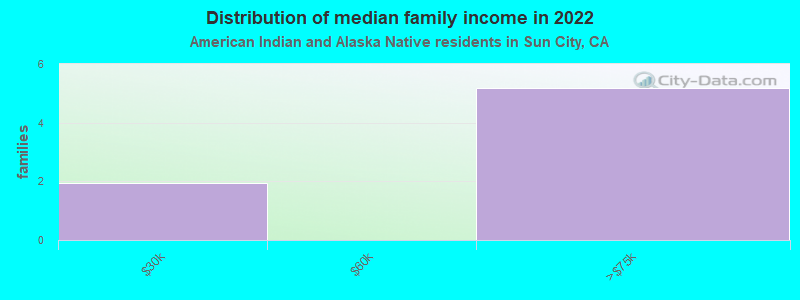
Income statistics for American Indian and Alaska Native residents
Median household income in Sun City, CA in 2022:| Sun City: | $42,556 |
| State: | $76,752 |
Change in median household income between 2000 and 2022:| Sun City, California: | +101.6% |
| State: | +110.0% |
Number of households with income < $10k:| Sun City: | 8.5% (525) |
| State: | 5.4% (8,471) |
Number of households with income $10k - 20k:| Sun City: | 4.5% (276) |
| State: | 6.0% (9,381) |
Number of households with income $20k - 30k:| Sun City: | 2.2% (135) |
| State: | 5.5% (8,668) |
Number of households with income $30k - 40k:| Sun City: | 5.6% (344) |
| State: | 8.3% (13,030) |
Number of households with income $40k - 50k:| Sun City: | 5.8% (358) |
| California: | 6.9% (10,908) |
Number of households with income $50k - 60k:| Sun City: | 13.0% (802) |
| California: | 7.1% (11,198) |
Number of households with income $60k - 75k:| Sun City: | 9.0% (557) |
| State: | 9.6% (15,190) |
Number of households with income $75k - 100k:| Sun City: | 15.5% (953) |
| California: | 14.1% (22,274) |
Number of households with income $100k - 125k:| Sun City: | 9.6% (594) |
| California: | 11.2% (17,643) |
Number of households with income $125k - 150k:| Sun City: | 6.0% (371) |
| California: | 8.3% (13,117) |
Number of households with income $150k - 200k:| Sun City: | 10.1% (621) |
| California: | 8.8% (13,853) |
Number of households with income > $200k:| Sun City: | 10.1% (620) |
| State: | 8.8% (13,925) |
Aggregate household income in Sun City in 2022: $3,071,784
Median family income in Sun City in 2022:| Sun City: | $43,628 |
| California: | $81,108 |
Median non-family income in Sun City in 2022:| Sun City: | $20,935 |
| State: | $51,296 |
Median per capita income in Sun City in 2022:| Sun City: | $19,332 |
| California: | $30,289 |
Change in median per capita income between 2000 and 2022:| Sun City, California: | +133.6% |
| California: | +98.9% |
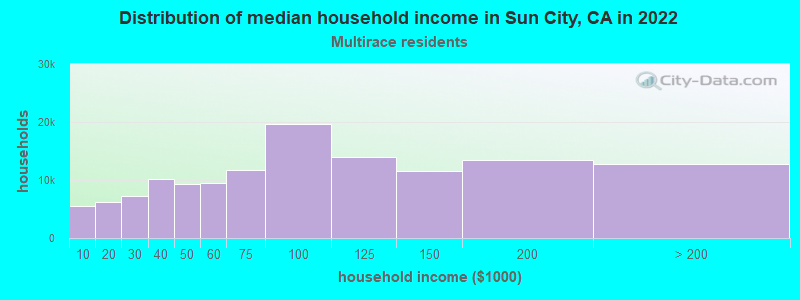
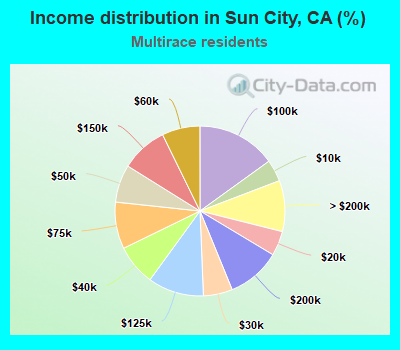
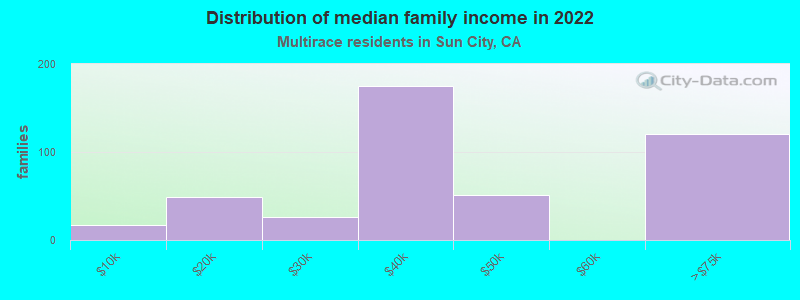
Income statistics for Multirace residents
Median household income in Sun City, CA in 2022:| Sun City: | $78,039 |
| State: | $83,153 |
Change in median household income between 2000 and 2022:| Sun City, California: | +104.2% |
| State: | +106.0% |
Number of households with income < $10k:| Sun City: | 4.2% (5,433) |
| State: | 4.2% (85,299) |
Number of households with income $10k - 20k:| Sun City: | 4.7% (6,128) |
| State: | 6.1% (122,966) |
Number of households with income $20k - 30k:| Sun City: | 5.5% (7,228) |
| State: | 6.4% (129,328) |
Number of households with income $30k - 40k:| Sun City: | 7.8% (10,156) |
| State: | 6.4% (130,070) |
Number of households with income $40k - 50k:| Sun City: | 7.2% (9,390) |
| State: | 6.5% (131,254) |
Number of households with income $50k - 60k:| Sun City: | 7.3% (9,482) |
| California: | 6.5% (132,382) |
Number of households with income $60k - 75k:| Sun City: | 8.9% (11,646) |
| California: | 9.4% (191,472) |
Number of households with income $75k - 100k:| Sun City: | 15.1% (19,688) |
| State: | 13.3% (269,691) |
Number of households with income $100k - 125k:| Sun City: | 10.7% (13,940) |
| California: | 10.2% (207,286) |
Number of households with income $125k - 150k:| Sun City: | 8.9% (11,612) |
| State: | 7.8% (158,259) |
Number of households with income $150k - 200k:| Sun City: | 10.2% (13,372) |
| California: | 10.3% (209,227) |
Number of households with income > $200k:| Sun City: | 9.7% (12,703) |
| California: | 13.0% (263,210) |
Aggregate household income in Sun City in 2022: $92,300,138
Median family income in Sun City in 2022:| Sun City: | $80,219 |
| California: | $87,642 |
Number of families with income < $10k:| Sun City: | 3.9% (17) |
| State: | 3.2% (48,017) |
Number of families with income $10k - 20k:| Sun City: | 11.2% (49) |
| California: | 4.1% (60,419) |
Number of families with income $20k - 30k:| Sun City: | 6.0% (26) |
| State: | 6.1% (89,742) |
Number of families with income $30k - 40k:| Sun City: | 39.9% (175) |
| State: | 6.2% (91,415) |
Number of families with income $40k - 50k:| Sun City: | 11.7% (51) |
| California: | 6.8% (100,085) |
Number of families with income $60k - 75k:| Sun City: | 27.4% (120) |
| California: | 9.5% (140,131) |
Median non-family income in Sun City in 2022:| Sun City: | $42,649 |
| State: | $56,558 |
Change in median non-family income between 2000 and 2022:| Sun City, California: | +80.4% |
| State: | +100.2% |
Median per capita income in Sun City in 2022:| Sun City: | $23,170 |
| California: | $32,124 |
Change in median per capita income between 2000 and 2022:| Sun City, California: | +142.3% |
| California: | +120.4% |
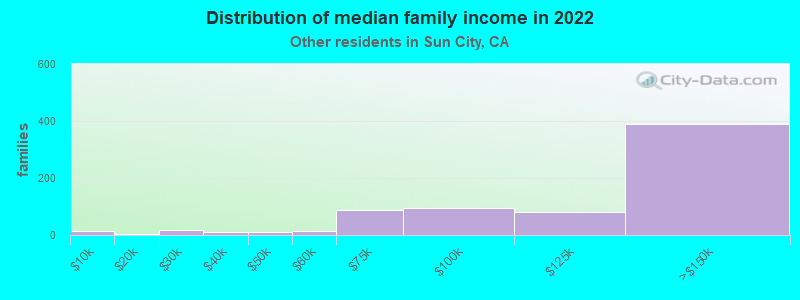
Income statistics for other residents
Number of households with income < $10k:| Sun City: | 3.1% (21) |
| State: | 4.6% (93,035) |
Number of households with income $10k - 20k:| Sun City: | 4.4% (30) |
| State: | 6.3% (126,222) |
Number of households with income $20k - 30k:| Sun City: | 6.0% (41) |
| State: | 7.1% (142,656) |
Number of households with income $30k - 40k:| Sun City: | 7.3% (50) |
| State: | 8.2% (165,018) |
Number of households with income $40k - 50k:| Sun City: | 6.9% (47) |
| State: | 8.0% (161,732) |
Number of households with income $50k - 60k:| Sun City: | 6.9% (47) |
| State: | 7.6% (152,152) |
Number of households with income $60k - 75k:| Sun City: | 10.3% (71) |
| California: | 10.4% (209,951) |
Number of households with income $75k - 100k:| Sun City: | 15.3% (105) |
| State: | 14.7% (296,102) |
Number of households with income $100k - 125k:| Sun City: | 13.1% (90) |
| California: | 10.7% (214,281) |
Number of households with income $125k - 150k:| Sun City: | 8.2% (56) |
| California: | 7.1% (143,092) |
Number of households with income $150k - 200k:| Sun City: | 11.5% (79) |
| State: | 8.6% (172,215) |
Number of households with income > $200k:| Sun City: | 7.1% (49) |
| State: | 6.7% (134,102) |
Aggregate household income in Sun City in 2022: $66,065,941
Median family income in Sun City in 2022:| Sun City: | $143,012 |
| State: | $72,756 |
Number of families with income < $10k:| Sun City: | 2.1% (15) |
| State: | 4.3% (69,090) |
Number of families with income $10k - 20k:| Sun City: | 0.5% (4) |
| California: | 5.1% (82,116) |
Number of families with income $20k - 30k:| Sun City: | 2.4% (17) |
| State: | 7.0% (112,854) |
Number of families with income $30k - 40k:| Sun City: | 1.6% (11) |
| State: | 8.4% (135,938) |
Number of families with income $40k - 50k:| Sun City: | 1.7% (12) |
| State: | 8.4% (135,353) |
Number of families with income $50k - 60k:| Sun City: | 2.0% (14) |
| California: | 7.7% (124,826) |
Number of families with income $60k - 75k:| Sun City: | 11.9% (86) |
| State: | 10.7% (173,628) |
Number of families with income $75k - 100k:| Sun City: | 13.0% (94) |
| State: | 15.2% (245,724) |
Number of families with income $100k - 125k:| Sun City: | 11.0% (80) |
| State: | 10.9% (176,716) |
Number of families with income $125k - 150k:| Sun City: | 53.8% (388) |
| California: | 7.4% (119,985) |
Median non-family income in Sun City in 2022:| Sun City: | $19,346 |
| State: | $43,881 |
Change in median non-family income between 2000 and 2022:| Sun City, California: | +121.1% |
| State: | +84.6% |
Median per capita income in Sun City in 2022:| Sun City: | $43,553 |
| State: | $25,164 |
Change in median per capita income between 2000 and 2022:| Sun City, California: | +141.4% |
| California: | +137.9% |