Tolland, Massachusetts (MA) income map, earnings map, and wages data
The median household income in Tolland, MA in 2022 was $85,424, which was 10.6% less than the median annual income of $94,488 across the entire state of Massachusetts. Compared to the median income of $53,125 in 2000 this represents an increase of 37.8%. The per capita income in 2022 was $52,864, which means an increase of 43.0% compared to 2000 when it was $30,126.
Income statistics for all residents
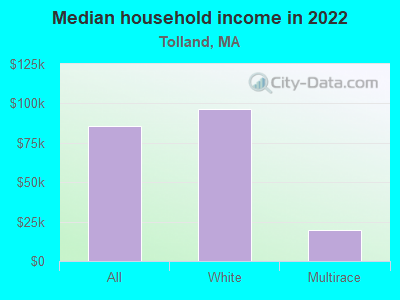
Median household income in Tolland, MA in 2022:| Tolland: | $85,424 |
| State: | $94,488 |
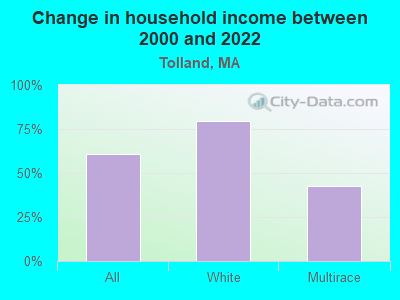
Change in median household income between 2000 and 2022:| Tolland, Massachusetts: | +60.8% |
| State: | +87.1% |
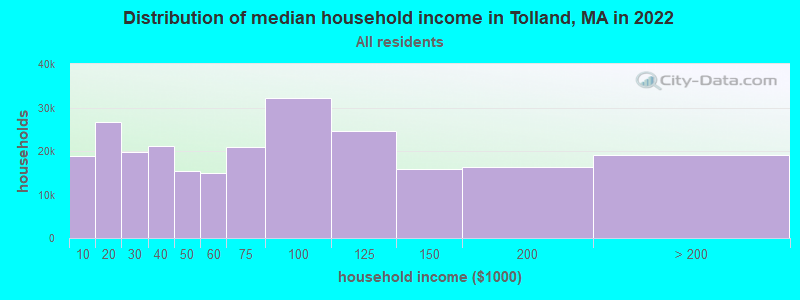
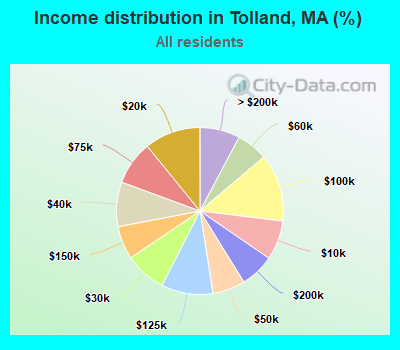
Number of households with income < $10k:| Tolland: | 7.6% (18,742) |
| Massachusetts: | 5.2% (146,170) |
Number of households with income $10k - 20k:| Tolland: | 10.9% (26,653) |
| State: | 6.4% (180,001) |
Number of households with income $20k - 30k:| Tolland: | 8.0% (19,717) |
| Massachusetts: | 5.6% (156,667) |
Number of households with income $30k - 40k:| Tolland: | 8.6% (21,156) |
| Massachusetts: | 5.6% (157,168) |
Number of households with income $40k - 50k:| Tolland: | 6.3% (15,501) |
| State: | 5.4% (151,455) |
Number of households with income $50k - 60k:| Tolland: | 6.0% (14,835) |
| State: | 5.1% (142,726) |
Number of households with income $60k - 75k:| Tolland: | 8.5% (20,898) |
| State: | 7.6% (212,203) |
Number of households with income $75k - 100k:| Tolland: | 13.1% (32,180) |
| State: | 11.3% (317,064) |
Number of households with income $100k - 125k:| Tolland: | 10.0% (24,576) |
| State: | 9.7% (270,603) |
Number of households with income $125k - 150k:| Tolland: | 6.4% (15,782) |
| State: | 8.0% (223,140) |
Number of households with income $150k - 200k:| Tolland: | 6.6% (16,235) |
| State: | 11.0% (308,695) |
Number of households with income > $200k:| Tolland: | 7.8% (19,087) |
| Massachusetts: | 19.0% (531,884) |
Aggregate household income in Tolland in 2022: $92,570,364
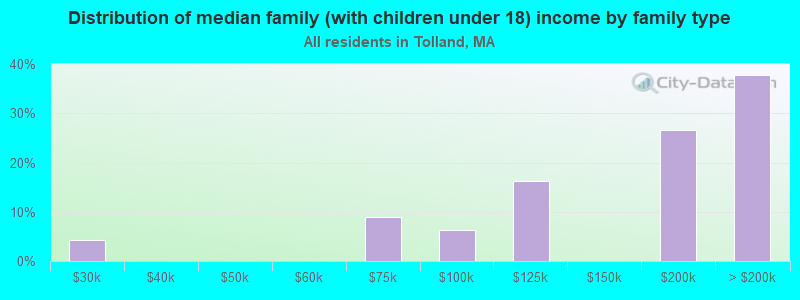
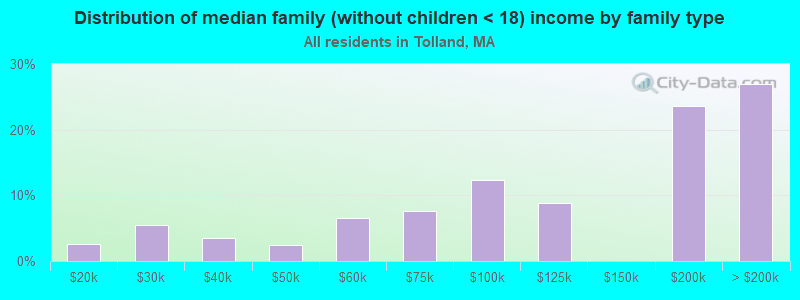
Median family income in Tolland in 2022:| Tolland: | $111,471 |
| Massachusetts: | $120,263 |
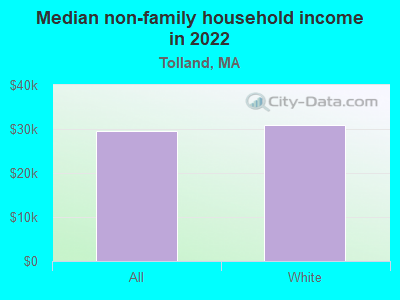
Median non-family income in Tolland in 2022:| Tolland: | $29,443 |
| State: | $55,979 |
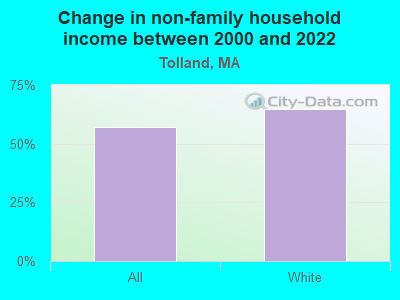
Change in median non-family income between 2000 and 2022:| Tolland, Massachusetts: | +57.0% |
| State: | +88.0% |
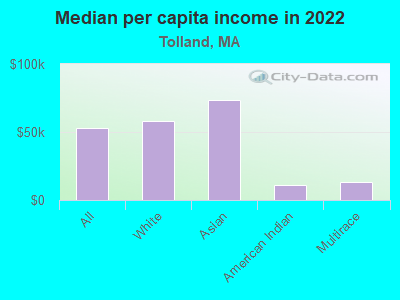
Median per capita income in Tolland in 2022:| Tolland: | $52,864 |
| State: | $54,025 |
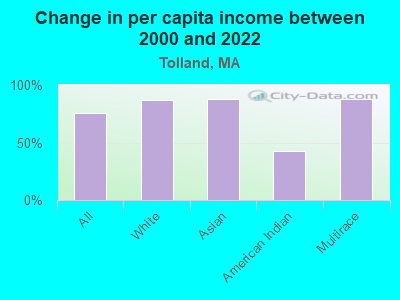
Change in median per capita income between 2000 and 2022:| Tolland, Massachusetts: | +75.5% |
| State: | +108.2% |
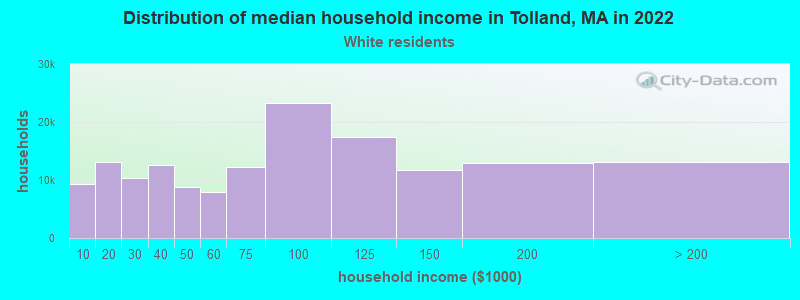
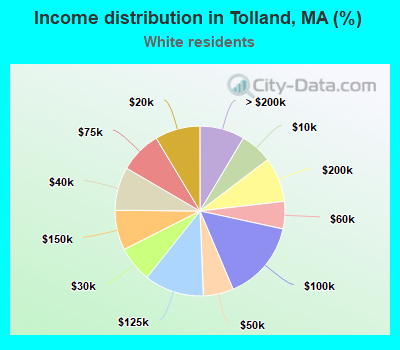
Income statistics for White residents
Median household income in Tolland, MA in 2022:| Tolland: | $96,449 |
| Massachusetts: | $101,391 |
Change in median household income between 2000 and 2022:| Tolland, Massachusetts: | +79.4% |
| State: | +93.3% |
Number of households with income < $10k:| Tolland: | 6.1% (9,347) |
| Massachusetts: | 4.4% (91,120) |
Number of households with income $10k - 20k:| Tolland: | 8.6% (13,138) |
| Massachusetts: | 5.9% (122,055) |
Number of households with income $20k - 30k:| Tolland: | 6.8% (10,419) |
| State: | 5.1% (105,311) |
Number of households with income $30k - 40k:| Tolland: | 8.3% (12,614) |
| Massachusetts: | 5.3% (110,239) |
Number of households with income $40k - 50k:| Tolland: | 5.7% (8,764) |
| Massachusetts: | 5.0% (104,636) |
Number of households with income $50k - 60k:| Tolland: | 5.2% (7,965) |
| Massachusetts: | 4.8% (99,486) |
Number of households with income $60k - 75k:| Tolland: | 8.0% (12,226) |
| State: | 7.5% (155,124) |
Number of households with income $75k - 100k:| Tolland: | 15.2% (23,295) |
| State: | 11.4% (236,252) |
Number of households with income $100k - 125k:| Tolland: | 11.3% (17,347) |
| State: | 9.9% (204,731) |
Number of households with income $125k - 150k:| Tolland: | 7.6% (11,645) |
| Massachusetts: | 8.5% (175,324) |
Number of households with income $150k - 200k:| Tolland: | 8.5% (13,013) |
| State: | 11.7% (242,980) |
Number of households with income > $200k:| Tolland: | 8.6% (13,093) |
| Massachusetts: | 20.5% (425,966) |
Aggregate household income in Tolland in 2022: $68,528,722
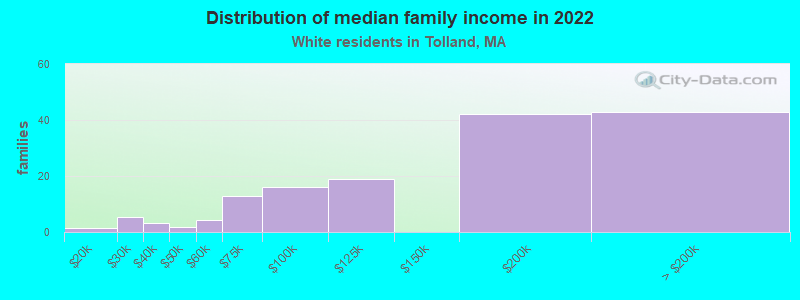
Median family income in Tolland in 2022:| Tolland: | $120,034 |
| State: | $133,153 |
Number of families with income $10k - 20k:| Tolland: | 1.0% (2) |
| State: | 2.1% (26,403) |
Number of families with income $20k - 30k:| Tolland: | 3.5% (5) |
| State: | 2.6% (32,525) |
Number of families with income $30k - 40k:| Tolland: | 2.1% (3) |
| State: | 3.9% (48,079) |
Number of families with income $40k - 50k:| Tolland: | 1.2% (2) |
| Massachusetts: | 3.8% (46,908) |
Number of families with income $50k - 60k:| Tolland: | 2.8% (4) |
| State: | 3.8% (46,476) |
Number of families with income $60k - 75k:| Tolland: | 8.6% (13) |
| State: | 6.4% (79,040) |
Number of families with income $75k - 100k:| Tolland: | 10.8% (16) |
| State: | 11.1% (137,395) |
Number of families with income $100k - 125k:| Tolland: | 12.7% (19) |
| State: | 11.1% (136,771) |
Number of families with income $150k - 200k:| Tolland: | 28.4% (42) |
| State: | 14.7% (181,602) |
Number of families with income > $200k:| Tolland: | 28.8% (43) |
| State: | 28.5% (351,887) |
Median non-family income in Tolland in 2022:| Tolland: | $30,866 |
| State: | $59,323 |
Change in median non-family income between 2000 and 2022:| Tolland, Massachusetts: | +64.6% |
| Massachusetts: | +94.3% |
Median per capita income in Tolland in 2022:| Tolland: | $58,080 |
| Massachusetts: | $60,804 |
Change in median per capita income between 2000 and 2022:| Tolland, Massachusetts: | +87.0% |
| State: | +118.7% |
Income statistics for Asian residents
Number of households with income < $10k:| Tolland: | 6.8% (21,951) |
| Massachusetts: | 6.8% (11,982) |
Number of households with income $10k - 20k:| Tolland: | 4.8% (15,345) |
| State: | 4.8% (8,376) |
Number of households with income $20k - 30k:| Tolland: | 3.7% (12,014) |
| State: | 3.7% (6,558) |
Number of households with income $30k - 40k:| Tolland: | 3.3% (10,531) |
| State: | 3.3% (5,748) |
Number of households with income $40k - 50k:| Tolland: | 4.1% (13,176) |
| State: | 4.1% (7,192) |
Number of households with income $50k - 60k:| Tolland: | 5.0% (16,001) |
| State: | 5.0% (8,734) |
Number of households with income $60k - 75k:| Tolland: | 5.8% (18,692) |
| State: | 5.8% (10,203) |
Number of households with income $75k - 100k:| Tolland: | 8.6% (27,762) |
| State: | 8.6% (15,154) |
Number of households with income $100k - 125k:| Tolland: | 10.8% (34,702) |
| Massachusetts: | 10.8% (18,942) |
Number of households with income $125k - 150k:| Tolland: | 8.0% (25,716) |
| State: | 8.0% (14,037) |
Number of households with income $150k - 200k:| Tolland: | 12.5% (40,040) |
| Massachusetts: | 12.5% (21,856) |
Number of households with income > $200k:| Tolland: | 26.6% (85,543) |
| State: | 26.6% (46,694) |
Median per capita income in Tolland in 2022:| Tolland: | $73,688 |
| State: | $58,900 |
Change in median per capita income between 2000 and 2022:| Tolland, Massachusetts: | +87.5% |
| Massachusetts: | +174.6% |
Income statistics for American Indian and Alaska Native residents
Number of households with income < $10k:| Tolland: | 6.6% (221) |
| State: | 6.6% (451) |
Number of households with income $10k - 20k:| Tolland: | 7.0% (234) |
| Massachusetts: | 7.0% (476) |
Number of households with income $20k - 30k:| Tolland: | 2.8% (94) |
| Massachusetts: | 2.8% (192) |
Number of households with income $30k - 40k:| Tolland: | 3.2% (107) |
| State: | 3.2% (218) |
Number of households with income $40k - 50k:| Tolland: | 2.9% (98) |
| State: | 2.9% (199) |
Number of households with income $50k - 60k:| Tolland: | 9.9% (332) |
| State: | 9.9% (677) |
Number of households with income $60k - 75k:| Tolland: | 11.5% (383) |
| State: | 11.5% (781) |
Number of households with income $75k - 100k:| Tolland: | 9.2% (309) |
| Massachusetts: | 9.2% (629) |
Number of households with income $100k - 125k:| Tolland: | 6.0% (199) |
| Massachusetts: | 6.0% (406) |
Number of households with income $125k - 150k:| Tolland: | 13.5% (452) |
| State: | 13.5% (921) |
Number of households with income $150k - 200k:| Tolland: | 12.6% (422) |
| State: | 12.6% (859) |
Number of households with income > $200k:| Tolland: | 14.7% (492) |
| State: | 14.7% (1,003) |
Median per capita income in Tolland in 2022:| Tolland: | $11,109 |
| State: | $39,434 |
Change in median per capita income between 2000 and 2022:| Tolland, Massachusetts: | +42.4% |
| State: | +148.2% |
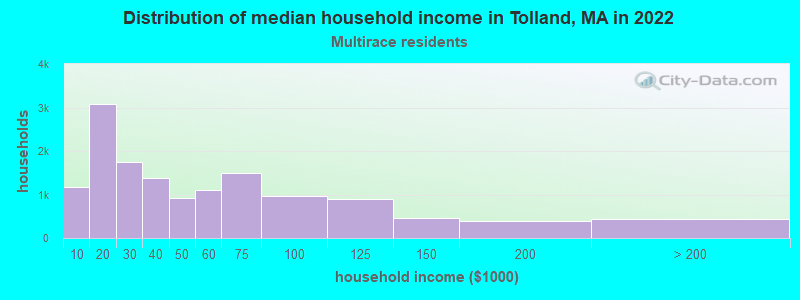
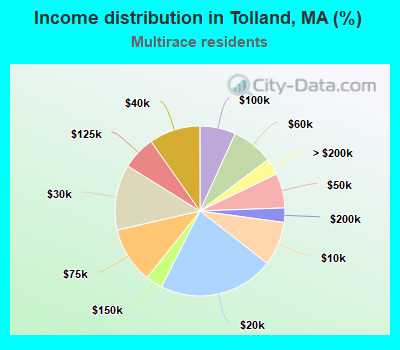
Income statistics for Multirace residents
Median household income in Tolland, MA in 2022:| Tolland: | $19,613 |
| State: | $71,552 |
Change in median household income between 2000 and 2022:| Tolland, Massachusetts: | +42.6% |
| State: | +109.0% |
Number of households with income < $10k:| Tolland: | 8.4% (1,176) |
| State: | 6.6% (15,127) |
Number of households with income $10k - 20k:| Tolland: | 22.0% (3,084) |
| State: | 9.2% (21,158) |
Number of households with income $20k - 30k:| Tolland: | 12.5% (1,753) |
| State: | 7.8% (18,016) |
Number of households with income $30k - 40k:| Tolland: | 9.7% (1,369) |
| State: | 7.9% (18,260) |
Number of households with income $40k - 50k:| Tolland: | 6.6% (922) |
| Massachusetts: | 5.6% (13,027) |
Number of households with income $50k - 60k:| Tolland: | 7.9% (1,109) |
| Massachusetts: | 5.6% (12,909) |
Number of households with income $60k - 75k:| Tolland: | 10.7% (1,505) |
| Massachusetts: | 9.0% (20,800) |
Number of households with income $75k - 100k:| Tolland: | 6.8% (956) |
| State: | 12.1% (27,875) |
Number of households with income $100k - 125k:| Tolland: | 6.4% (894) |
| Massachusetts: | 8.1% (18,754) |
Number of households with income $125k - 150k:| Tolland: | 3.2% (451) |
| State: | 6.8% (15,621) |
Number of households with income $150k - 200k:| Tolland: | 2.8% (387) |
| State: | 9.4% (21,618) |
Number of households with income > $200k:| Tolland: | 3.2% (444) |
| State: | 12.0% (27,592) |
Aggregate household income in Tolland in 2022: $593,299
Median family income in Tolland in 2022:| Tolland: | $19,571 |
| State: | $78,380 |
Number of families with income $10k - 20k:| Tolland: | 100.0% (15) |
| Massachusetts: | 4.9% (7,678) |
Median per capita income in Tolland in 2022:| Tolland: | $13,549 |
| State: | $34,029 |
Change in median per capita income between 2000 and 2022:| Tolland, Massachusetts: | +88.2% |
| State: | +132.1% |