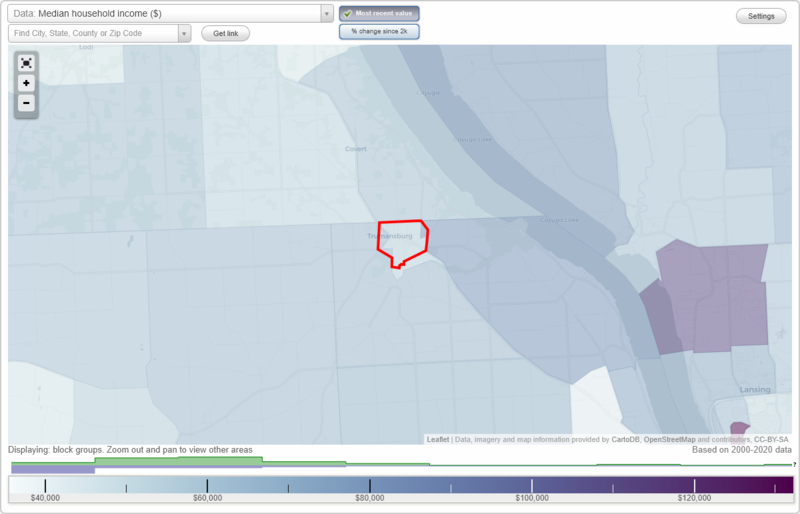
The median household income in Trumansburg, NY in 2022 was $72,250, which was 10.1% less than the median annual income of $79,557 across the entire state of New York. Compared to the median income of $39,423 in 2000 this represents an increase of 45.4%. The per capita income in 2022 was $43,255, which means an increase of 47.4% compared to 2000 when it was $22,773.
Whole page based on the data from 2000 / 2022 when the population of Trumansburg, New York was 1,581 / 1,517
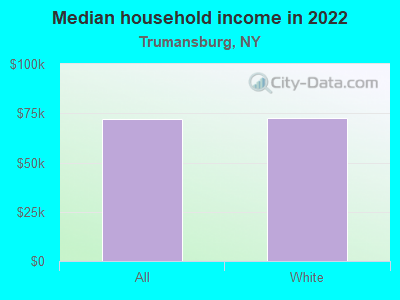
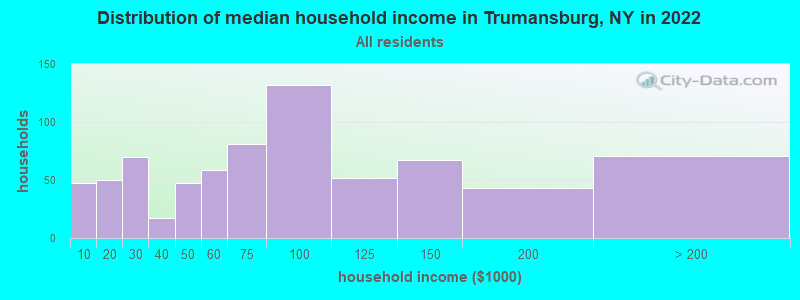
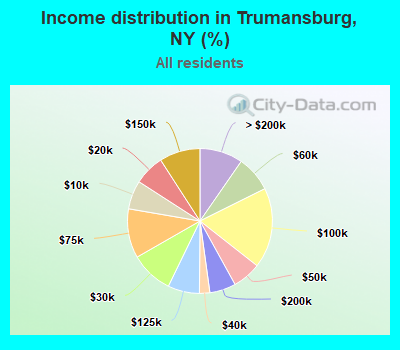
Income statistics for all residents
Median household income in Trumansburg, NY in 2022:
Trumansburg:
$72,251
New York:
$79,557
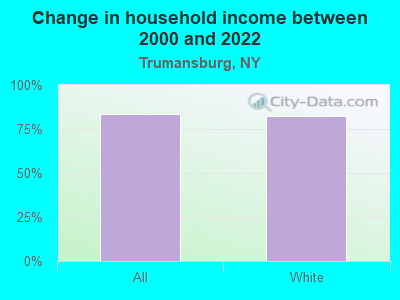
Change in median household income between 2000 and 2022:
Trumansburg, New York:
+83.3%
State:
+83.3%
Number of households with income < $10k:
Trumansburg:
6.4% (47)
State:
6.8% (527,598)
Number of households with income $10k - 20k:
Trumansburg:
6.8% (50)
New York:
7.4% (574,940)
Number of households with income $20k - 30k:
Trumansburg:
9.5% (70)
State:
6.7% (517,718)
Number of households with income $30k - 40k:
Trumansburg:
2.3% (17)
State:
6.5% (506,674)
Number of households with income $40k - 50k:
Trumansburg:
6.4% (47)
State:
6.1% (470,439)
Number of households with income $50k - 60k:
Trumansburg:
8.0% (59)
New York:
5.8% (454,042)
Number of households with income $60k - 75k:
Trumansburg:
11.0% (81)
State:
8.5% (657,508)
Number of households with income $75k - 100k:
Trumansburg:
17.9% (132)
New York:
11.6% (899,824)
Number of households with income $100k - 125k:
Trumansburg:
7.1% (52)
State:
9.3% (723,825)
Number of households with income $125k - 150k:
Trumansburg:
9.1% (67)
State:
7.1% (552,420)
Number of households with income $150k - 200k:
Trumansburg:
5.8% (43)
State:
9.4% (727,051)
Number of households with income > $200k:
Trumansburg:
9.6% (71)
New York:
15.0% (1,162,269)
Aggregate household income in Trumansburg in 2022: $65,927,134
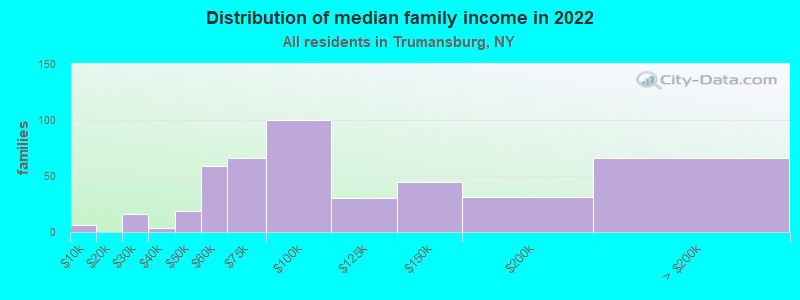
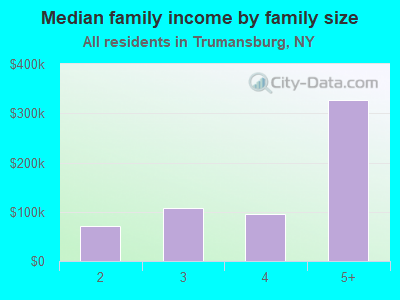
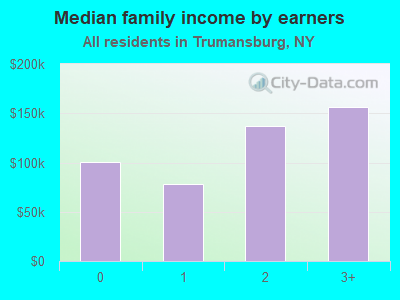
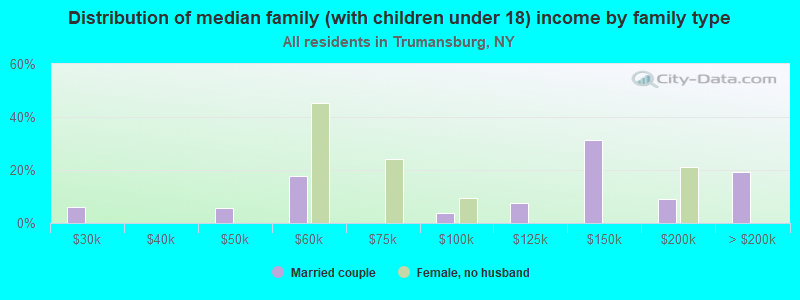
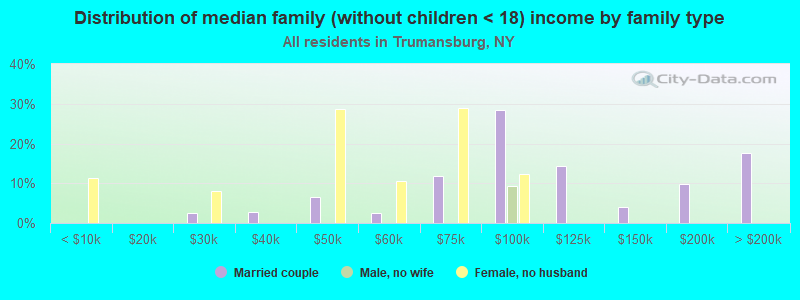
Median family income in Trumansburg in 2022:
Trumansburg:
$91,514
State:
$99,066
Number of families with income < $10k:
Trumansburg:
1.3% (6)
State:
4.2% (197,409)
Number of families with income $20k - 30k:
Trumansburg:
3.6% (16)
State:
5.1% (241,229)
Number of families with income $30k - 40k:
Trumansburg:
0.8% (4)
New York:
5.5% (259,233)
Number of families with income $40k - 50k:
Trumansburg:
4.3% (19)
New York:
5.5% (259,113)
Number of families with income $50k - 60k:
Trumansburg:
13.4% (59)
State:
5.4% (255,320)
Number of families with income $60k - 75k:
Trumansburg:
14.9% (66)
New York:
8.2% (388,624)
Number of families with income $75k - 100k:
Trumansburg:
22.6% (100)
New York:
12.3% (583,110)
Number of families with income $100k - 125k:
Trumansburg:
6.8% (30)
State:
10.6% (500,579)
Number of families with income $125k - 150k:
Trumansburg:
10.1% (45)
State:
8.5% (400,594)
Number of families with income $150k - 200k:
Trumansburg:
7.0% (31)
State:
11.6% (551,650)
Number of families with income > $200k:
Trumansburg:
15.1% (66)
State:
18.9% (895,998)
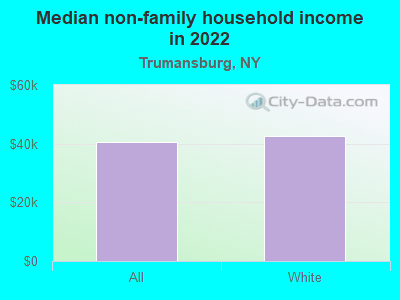
Median non-family income in Trumansburg in 2022:
Trumansburg:
$40,669
State:
$50,181
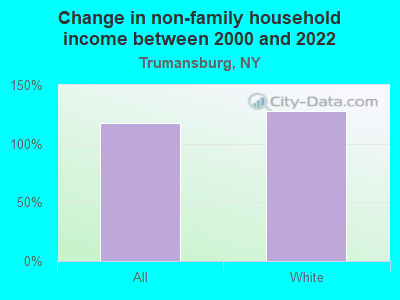
Change in median non-family income between 2000 and 2022:
Trumansburg, New York:
+117.9%
State:
+85.4%
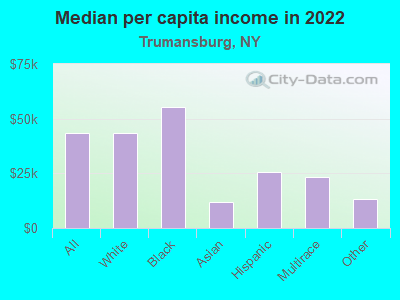
Median per capita income in Trumansburg in 2022:
Trumansburg:
$43,255
State:
$47,421
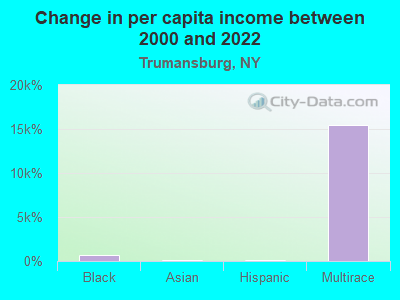
Change in median per capita income between 2000 and 2022:
Trumansburg, New York:
+89.9%
State:
+102.7%
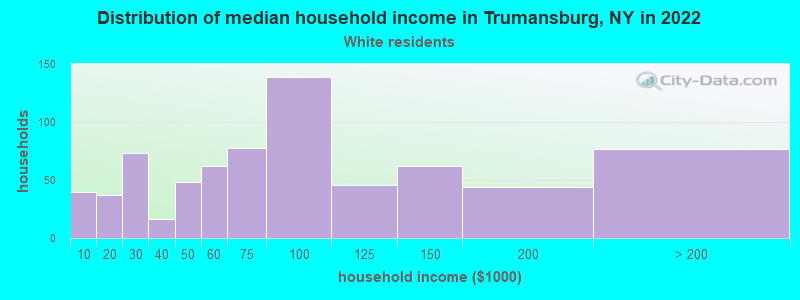
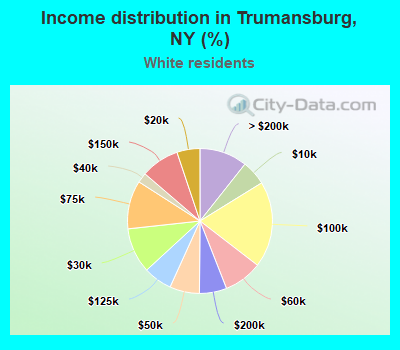
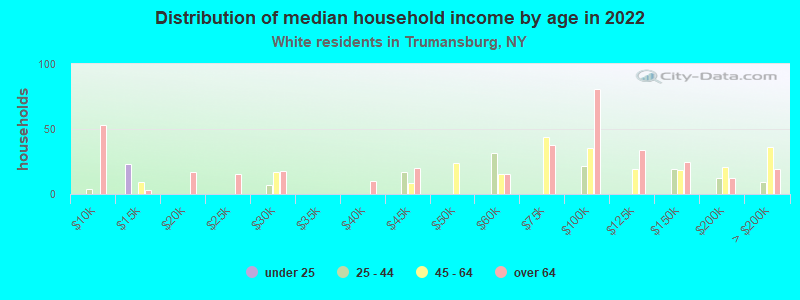
Income statistics for White residents
Median household income in Trumansburg, NY in 2022:
Trumansburg:
$72,349
State:
$89,408
Change in median household income between 2000 and 2022:
Trumansburg, New York:
+82.6%
New York:
+85.5%
Number of households with income < $10k:
Trumansburg:
5.5% (40)
State:
4.8% (225,550)
Number of households with income $10k - 20k:
Trumansburg:
5.1% (37)
New York:
6.1% (289,425)
Number of households with income $20k - 30k:
Trumansburg:
10.1% (73)
State:
5.9% (280,254)
Number of households with income $30k - 40k:
Trumansburg:
2.2% (16)
New York:
6.1% (288,263)
Number of households with income $40k - 50k:
Trumansburg:
6.6% (48)
New York:
5.9% (278,079)
Number of households with income $50k - 60k:
Trumansburg:
8.6% (62)
State:
5.7% (267,554)
Number of households with income $60k - 75k:
Trumansburg:
10.8% (78)
State:
8.4% (398,344)
Number of households with income $75k - 100k:
Trumansburg:
19.3% (139)
State:
11.8% (554,841)
Number of households with income $100k - 125k:
Trumansburg:
6.4% (46)
State:
10.0% (469,794)
Number of households with income $125k - 150k:
Trumansburg:
8.6% (62)
State:
7.6% (360,467)
Number of households with income $150k - 200k:
Trumansburg:
6.1% (44)
State:
10.1% (477,078)
Number of households with income > $200k:
Trumansburg:
10.7% (77)
New York:
17.6% (829,233)
Aggregate household income in Trumansburg in 2022: $65,175,592
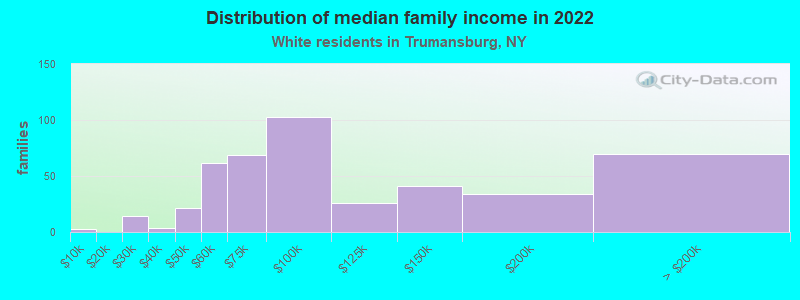
Median family income in Trumansburg in 2022:
Trumansburg:
$90,869
New York:
$115,170
Number of families with income < $10k:
Trumansburg:
0.7% (3)
State:
2.5% (68,851)
Number of families with income $20k - 30k:
Trumansburg:
3.2% (14)
New York:
3.5% (97,578)
Number of families with income $30k - 40k:
Trumansburg:
0.8% (4)
New York:
4.1% (114,108)
Number of families with income $40k - 50k:
Trumansburg:
4.6% (21)
State:
4.7% (130,902)
Number of families with income $50k - 60k:
Trumansburg:
13.8% (62)
State:
4.9% (135,118)
Number of families with income $60k - 75k:
Trumansburg:
15.5% (69)
New York:
7.8% (216,254)
Number of families with income $75k - 100k:
Trumansburg:
23.1% (103)
New York:
12.4% (342,382)
Number of families with income $100k - 125k:
Trumansburg:
5.8% (26)
State:
11.4% (314,917)
Number of families with income $125k - 150k:
Trumansburg:
9.1% (41)
State:
9.4% (260,489)
Number of families with income $150k - 200k:
Trumansburg:
7.6% (34)
State:
13.2% (365,586)
Number of families with income > $200k:
Trumansburg:
15.8% (70)
State:
23.2% (642,319)
Median non-family income in Trumansburg in 2022:
Trumansburg:
$42,776
State:
$54,783
Change in median non-family income between 2000 and 2022:
Trumansburg, New York:
+128.1%
State:
+87.9%
Median per capita income in Trumansburg in 2022:
Trumansburg:
$43,637
State:
$57,640
Change in median per capita income between 2000 and 2022:
Trumansburg, New York:
+87.5%
State:
+111.6%
Income statistics for Black or African American residents
Aggregate household income in Trumansburg in 2022: $1,071,272
Median per capita income in Trumansburg in 2022:
Trumansburg:
$55,511
State:
$31,947
Income statistics for Asian residents
Median per capita income in Trumansburg in 2022:
Trumansburg:
$11,769
New York:
$46,726
Change in median per capita income between 2000 and 2022:
Trumansburg, New York:
+116.2%
State:
+126.6%
Income statistics for Hispanic or Latino residents
Aggregate household income in Trumansburg in 2022: $3,531,829
Median per capita income in Trumansburg in 2022:
Trumansburg:
$25,732
New York:
$29,761
Change in median per capita income between 2000 and 2022:
Trumansburg, New York:
+73.4%
State:
+132.7%
Income statistics for Multirace residents
Number of households with income < $10k:
Trumansburg:
0.0% (0)
New York:
8.9% (57,924)
Number of households with income $10k - 20k:
Trumansburg:
100.0% (22)
State:
8.7% (56,590)
Number of households with income $20k - 30k:
Trumansburg:
0.0% (0)
State:
7.1% (46,287)
Number of households with income $30k - 40k:
Trumansburg:
0.0% (0)
State:
6.9% (45,132)
Number of households with income $40k - 50k:
Trumansburg:
0.0% (0)
New York:
5.8% (37,946)
Number of households with income $50k - 60k:
Trumansburg:
0.0% (0)
State:
5.6% (36,410)
Number of households with income $60k - 75k:
Trumansburg:
0.0% (0)
New York:
7.8% (50,819)
Number of households with income $75k - 100k:
Trumansburg:
0.0% (0)
State:
11.7% (76,024)
Number of households with income $100k - 125k:
Trumansburg:
0.0% (0)
State:
9.3% (60,635)
Number of households with income $125k - 150k:
Trumansburg:
0.0% (0)
State:
6.2% (40,533)
Number of households with income $150k - 200k:
Trumansburg:
0.0% (0)
State:
8.6% (56,409)
Number of households with income > $200k:
Trumansburg:
0.0% (0)
State:
13.4% (87,442)
Median per capita income in Trumansburg in 2022:
Trumansburg:
$23,255
State:
$36,931
Income statistics for other residents
Median per capita income in Trumansburg in 2022:
Trumansburg:
$13,101
State:
$26,975
Change in median per capita income between 2000 and 2022:
Trumansburg, New York:
+90.4%
New York:
+144.6%
Discuss Trumansburg, New York (NY) on our hugely popular New York forum.