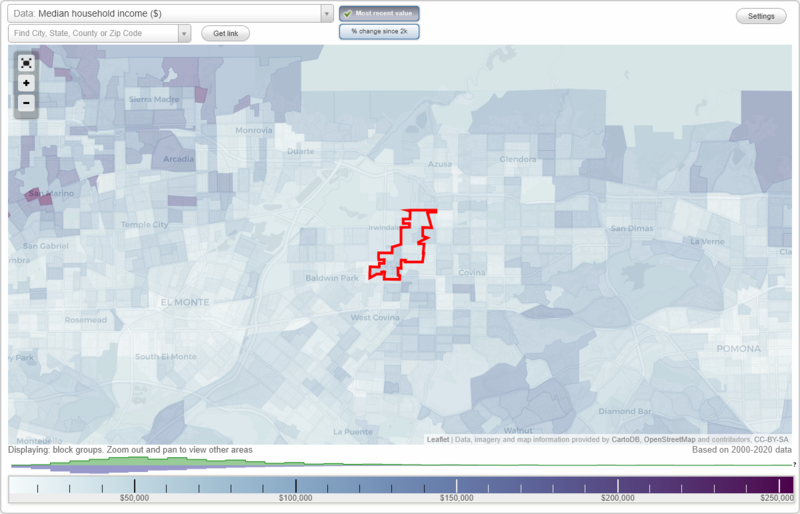
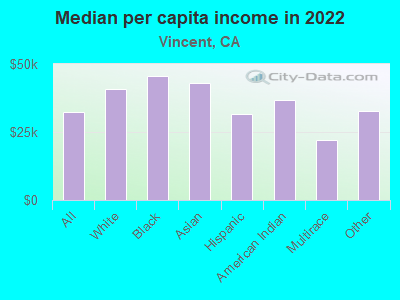
The median household income in Vincent, CA in 2022 was $102,387, which was 10.6% greater than the median annual income of $91,551 across the entire state of California. Compared to the median income of $52,349 in 2000 this represents an increase of 48.9%. The per capita income in 2022 was $32,398, which means an increase of 52.1% compared to 2000 when it was $15,522.
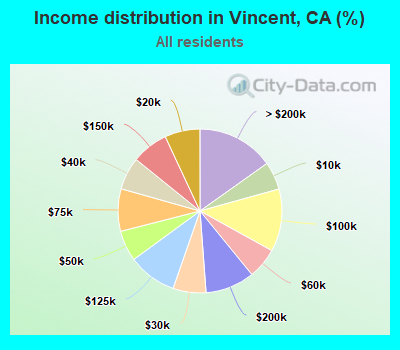
Income statistics for all residents
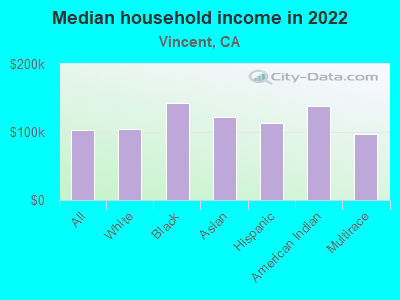
Median household income in Vincent, CA in 2022:
Vincent:
$102,388
State:
$91,551
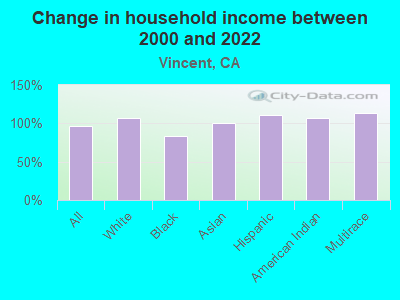
Change in median household income between 2000 and 2022:
Vincent, California:
+95.6%
State:
+92.8%
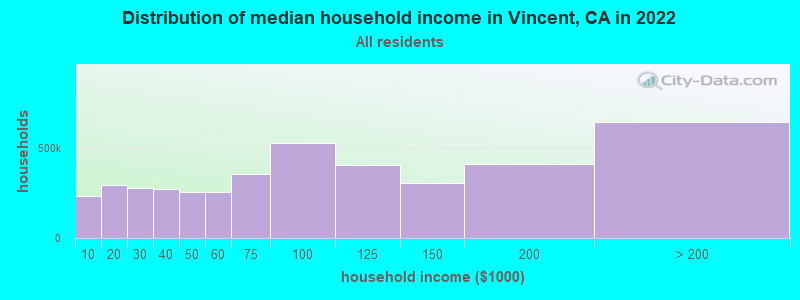
Number of households with income < $10k:
Vincent:
5.5% (233,318)
California:
4.8% (654,370)
Number of households with income $10k - 20k:
Vincent:
6.9% (294,123)
State:
5.8% (789,493)
Number of households with income $20k - 30k:
Vincent:
6.5% (275,955)
State:
5.7% (778,318)
Number of households with income $30k - 40k:
Vincent:
6.4% (272,323)
State:
5.8% (783,170)
Number of households with income $40k - 50k:
Vincent:
6.1% (257,477)
State:
5.8% (781,352)
Number of households with income $50k - 60k:
Vincent:
6.1% (257,683)
State:
5.6% (760,175)
Number of households with income $60k - 75k:
Vincent:
8.4% (354,954)
State:
8.2% (1,104,699)
Number of households with income $75k - 100k:
Vincent:
12.4% (523,922)
California:
12.0% (1,627,633)
Number of households with income $100k - 125k:
Vincent:
9.6% (407,033)
California:
10.0% (1,358,619)
Number of households with income $125k - 150k:
Vincent:
7.2% (307,061)
State:
7.6% (1,027,455)
Number of households with income $150k - 200k:
Vincent:
9.7% (411,337)
California:
10.6% (1,439,811)
Number of households with income > $200k:
Vincent:
15.2% (643,120)
State:
18.0% (2,445,491)
Aggregate household income in Vincent in 2022: $44,578,234,652
Median family income in Vincent in 2022:
Vincent:
$103,726
California:
$104,823
Median non-family income in Vincent in 2022:
Vincent:
$72,908
State:
$59,348
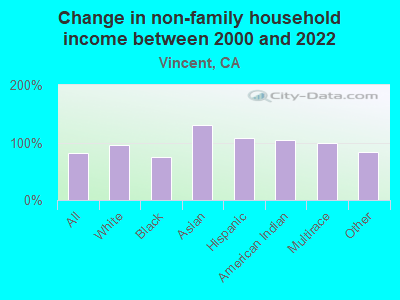
Change in median non-family income between 2000 and 2022:
Vincent, California:
+81.8%
State:
+85.3%
Median per capita income in Vincent in 2022:
Vincent:
$32,399
State:
$46,661
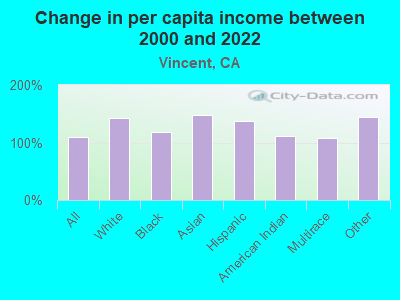
Change in median per capita income between 2000 and 2022:
Vincent, California:
+108.7%
State:
+105.5%
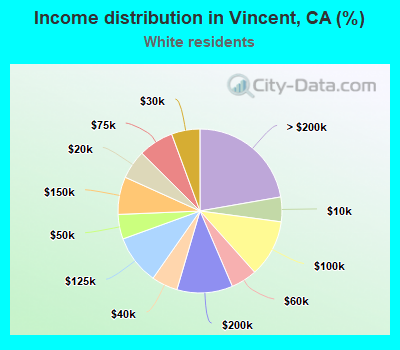
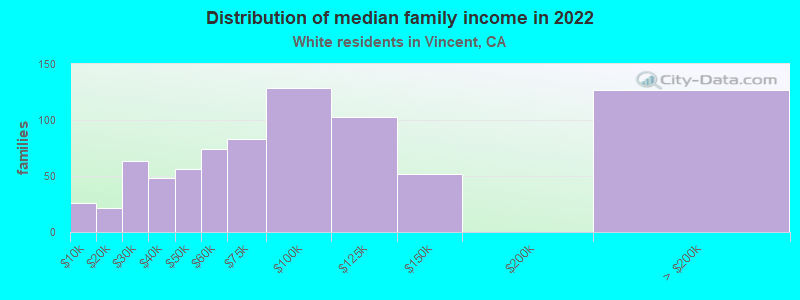
Income statistics for White residents
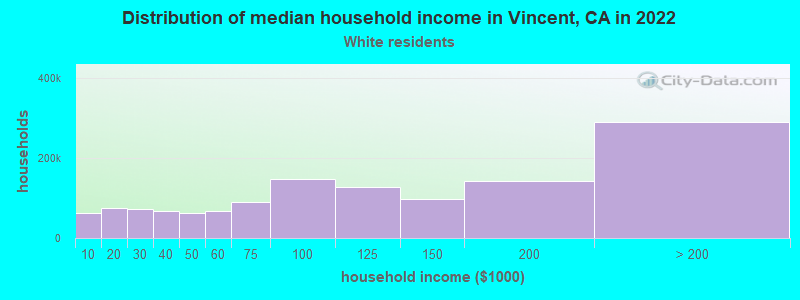
Median household income in Vincent, CA in 2022:
Vincent:
$104,833
State:
$100,917
Change in median household income between 2000 and 2022:
Vincent, California:
+107.4%
State:
+96.8%
Number of households with income < $10k:
Vincent:
4.9% (63,304)
State:
4.4% (284,109)
Number of households with income $10k - 20k:
Vincent:
5.7% (74,409)
California:
5.3% (340,330)
Number of households with income $20k - 30k:
Vincent:
5.6% (73,030)
California:
5.3% (343,145)
Number of households with income $30k - 40k:
Vincent:
5.2% (67,173)
State:
5.1% (330,146)
Number of households with income $40k - 50k:
Vincent:
4.9% (63,544)
California:
5.2% (335,310)
Number of households with income $50k - 60k:
Vincent:
5.1% (66,951)
State:
5.1% (326,299)
Number of households with income $60k - 75k:
Vincent:
6.9% (90,210)
State:
7.6% (487,640)
Number of households with income $75k - 100k:
Vincent:
11.3% (147,037)
State:
11.5% (736,578)
Number of households with income $100k - 125k:
Vincent:
9.8% (127,074)
State:
10.1% (648,782)
Number of households with income $125k - 150k:
Vincent:
7.4% (96,596)
State:
7.8% (499,671)
Number of households with income $150k - 200k:
Vincent:
11.0% (143,317)
State:
11.4% (729,603)
Number of households with income > $200k:
Vincent:
22.3% (290,066)
California:
21.2% (1,364,246)
Aggregate household income in Vincent in 2022: $11,248,838,832
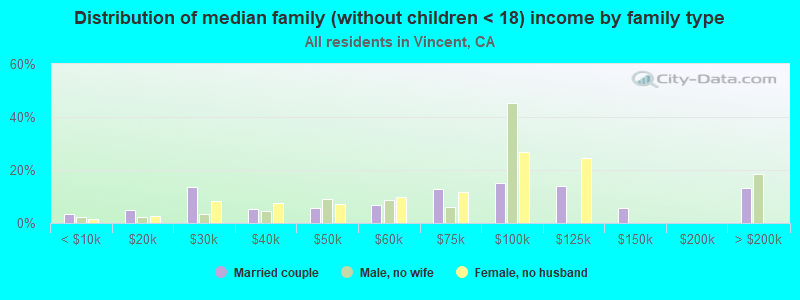
Median family income in Vincent in 2022:
Vincent:
$117,391
State:
$125,379
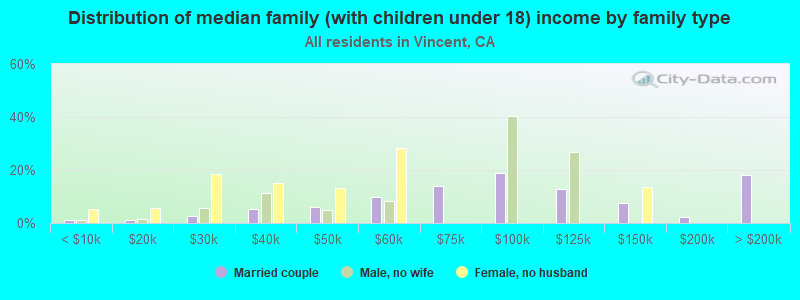
Number of families with income < $10k:
Vincent:
3.3% (26)
State:
2.2% (87,079)
Number of families with income $10k - 20k:
Vincent:
2.7% (21)
State:
2.5% (97,716)
Number of families with income $20k - 30k:
Vincent:
8.1% (63)
California:
3.5% (137,295)
Number of families with income $30k - 40k:
Vincent:
6.2% (48)
State:
3.9% (152,947)
Number of families with income $40k - 50k:
Vincent:
7.1% (56)
State:
4.3% (169,197)
Number of families with income $50k - 60k:
Vincent:
9.4% (74)
State:
4.5% (176,192)
Number of families with income $60k - 75k:
Vincent:
10.6% (83)
State:
7.0% (274,752)
Number of families with income $75k - 100k:
Vincent:
16.5% (129)
State:
11.3% (445,632)
Number of families with income $100k - 125k:
Vincent:
13.2% (103)
State:
10.7% (423,630)
Number of families with income $125k - 150k:
Vincent:
6.7% (52)
California:
9.1% (357,408)
Number of families with income > $200k:
Vincent:
16.3% (127)
California:
27.6% (1,086,948)
Median non-family income in Vincent in 2022:
Vincent:
$71,587
California:
$62,819
Change in median non-family income between 2000 and 2022:
Vincent, California:
+96.2%
State:
+84.4%
Median per capita income in Vincent in 2022:
Vincent:
$40,853
State:
$61,706
Change in median per capita income between 2000 and 2022:
Vincent, California:
+142.5%
California:
+122.7%
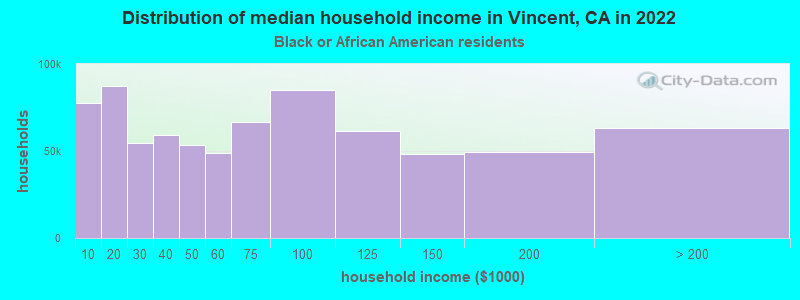
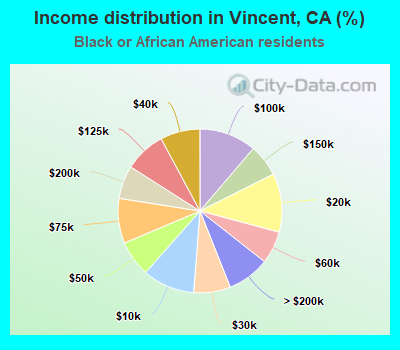
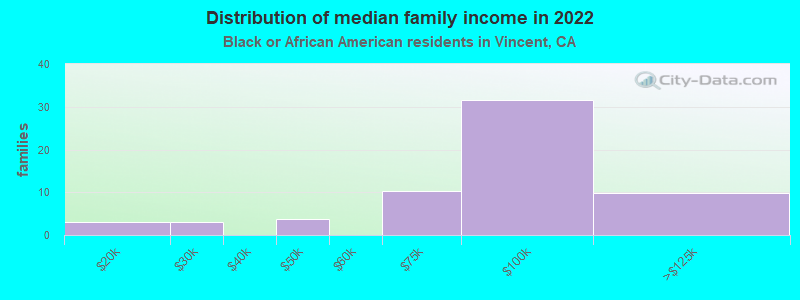
Income statistics for Black or African American residents
Median household income in Vincent, CA in 2022:
Vincent:
$141,974
California:
$63,268
Change in median household income between 2000 and 2022:
Vincent, California:
+83.6%
California:
+81.0%
Number of households with income < $10k:
Vincent:
10.3% (77,701)
State:
9.0% (73,219)
Number of households with income $10k - 20k:
Vincent:
11.6% (87,534)
State:
10.6% (86,666)
Number of households with income $20k - 30k:
Vincent:
7.3% (54,864)
State:
7.1% (57,719)
Number of households with income $30k - 40k:
Vincent:
7.8% (59,200)
California:
7.2% (58,714)
Number of households with income $40k - 50k:
Vincent:
7.1% (53,701)
California:
7.1% (58,075)
Number of households with income $50k - 60k:
Vincent:
6.4% (48,645)
State:
6.8% (55,229)
Number of households with income $60k - 75k:
Vincent:
8.9% (66,951)
State:
8.8% (71,895)
Number of households with income $75k - 100k:
Vincent:
11.2% (85,018)
State:
11.9% (96,893)
Number of households with income $100k - 125k:
Vincent:
8.1% (61,520)
State:
8.7% (70,729)
Number of households with income $125k - 150k:
Vincent:
6.4% (48,022)
California:
6.3% (51,211)
Number of households with income $150k - 200k:
Vincent:
6.5% (49,445)
State:
7.2% (58,687)
Number of households with income > $200k:
Vincent:
8.4% (63,321)
California:
9.3% (75,487)
Aggregate household income in Vincent in 2022: $99,986,944
Median family income in Vincent in 2022:
Vincent:
$144,127
State:
$77,263
Number of families with income $10k - 20k:
Vincent:
5.1% (3)
California:
6.4% (29,505)
Number of families with income $20k - 30k:
Vincent:
4.9% (3)
State:
5.6% (25,755)
Number of families with income $40k - 50k:
Vincent:
6.0% (4)
State:
8.3% (38,171)
Number of families with income $60k - 75k:
Vincent:
16.6% (10)
State:
8.7% (40,021)
Number of families with income $75k - 100k:
Vincent:
51.5% (32)
State:
12.4% (56,846)
Number of families with income $100k - 125k:
Vincent:
15.9% (10)
State:
9.8% (44,911)
Median non-family income in Vincent in 2022:
Vincent:
$149,959
California:
$41,942
Change in median non-family income between 2000 and 2022:
Vincent, California:
+73.5%
State:
+72.0%
Median per capita income in Vincent in 2022:
Vincent:
$45,654
State:
$36,708
Change in median per capita income between 2000 and 2022:
Vincent, California:
+117.9%
California:
+110.4%
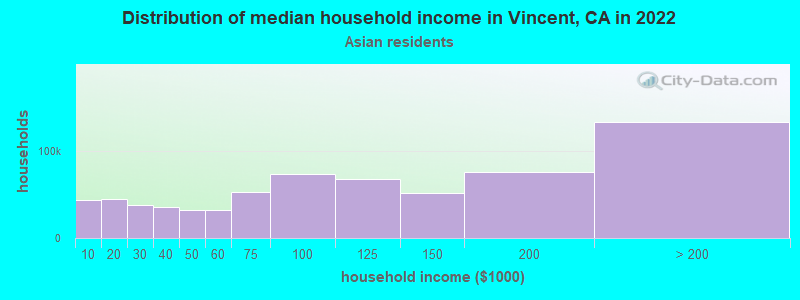
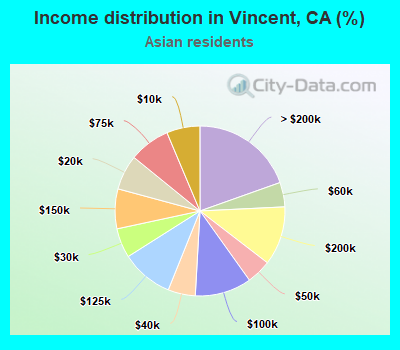
Income statistics for Asian residents
Median household income in Vincent, CA in 2022:
Vincent:
$121,609
State:
$119,861
Change in median household income between 2000 and 2022:
Vincent, California:
+101.1%
California:
+116.5%
Number of households with income < $10k:
Vincent:
6.3% (43,067)
State:
5.1% (106,273)
Number of households with income $10k - 20k:
Vincent:
6.6% (45,167)
California:
4.9% (101,815)
Number of households with income $20k - 30k:
Vincent:
5.6% (38,209)
California:
4.6% (94,414)
Number of households with income $30k - 40k:
Vincent:
5.2% (35,350)
State:
4.1% (84,491)
Number of households with income $40k - 50k:
Vincent:
4.7% (31,923)
California:
4.0% (81,758)
Number of households with income $50k - 60k:
Vincent:
4.7% (31,724)
State:
3.9% (80,971)
Number of households with income $60k - 75k:
Vincent:
7.8% (53,103)
California:
6.0% (124,194)
Number of households with income $75k - 100k:
Vincent:
10.8% (73,100)
State:
9.7% (200,337)
Number of households with income $100k - 125k:
Vincent:
9.9% (67,422)
State:
9.4% (193,488)
Number of households with income $125k - 150k:
Vincent:
7.6% (51,523)
State:
7.7% (158,253)
Number of households with income $150k - 200k:
Vincent:
11.2% (76,164)
State:
12.2% (252,139)
Number of households with income > $200k:
Vincent:
19.6% (133,070)
State:
28.4% (586,641)
Aggregate household income in Vincent in 2022: $609,840,215
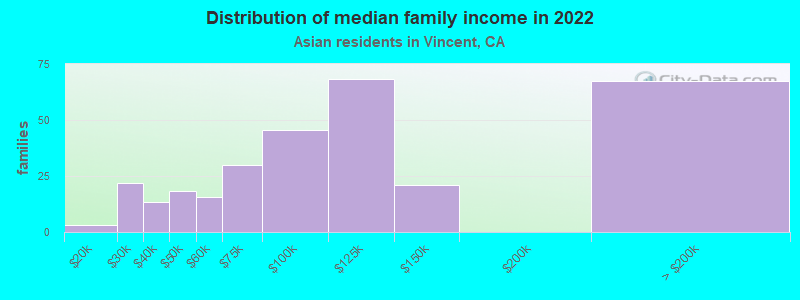
Median family income in Vincent in 2022:
Vincent:
$125,643
California:
$136,040
Number of families with income $10k - 20k:
Vincent:
1.0% (3)
State:
3.1% (46,821)
Number of families with income $20k - 30k:
Vincent:
7.2% (22)
California:
4.1% (61,519)
Number of families with income $30k - 40k:
Vincent:
4.4% (13)
State:
3.7% (55,234)
Number of families with income $40k - 50k:
Vincent:
6.0% (18)
State:
3.9% (58,471)
Number of families with income $50k - 60k:
Vincent:
5.1% (16)
State:
3.9% (58,911)
Number of families with income $60k - 75k:
Vincent:
9.9% (30)
State:
5.9% (88,675)
Number of families with income $75k - 100k:
Vincent:
15.0% (46)
California:
9.5% (143,103)
Number of families with income $100k - 125k:
Vincent:
22.4% (68)
California:
9.4% (142,085)
Number of families with income $125k - 150k:
Vincent:
6.9% (21)
State:
8.0% (120,635)
Number of families with income > $200k:
Vincent:
22.1% (67)
State:
32.5% (489,303)
Median non-family income in Vincent in 2022:
Vincent:
$27,572
California:
$74,216
Change in median non-family income between 2000 and 2022:
Vincent, California:
+131.1%
State:
+136.3%
Median per capita income in Vincent in 2022:
Vincent:
$43,056
State:
$58,824
Change in median per capita income between 2000 and 2022:
Vincent, California:
+148.4%
State:
+166.8%
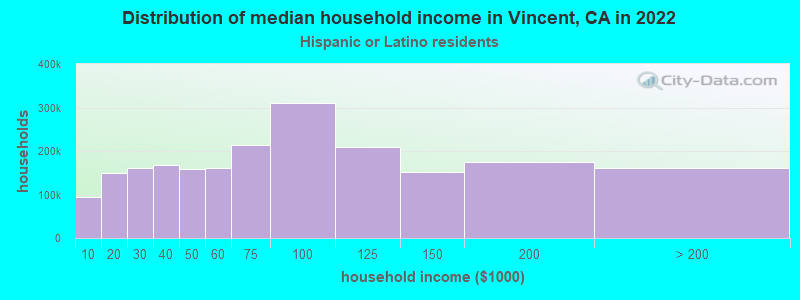
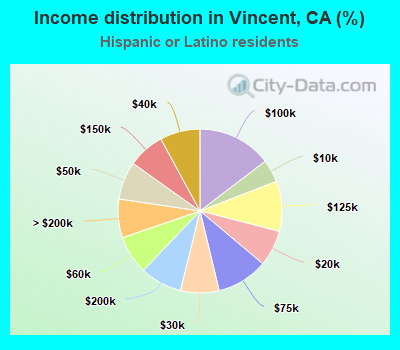
Income statistics for Hispanic or Latino residents
Median household income in Vincent, CA in 2022:
Vincent:
$112,779
State:
$75,698
Change in median household income between 2000 and 2022:
Vincent, California:
+110.8%
State:
+107.2%
Number of households with income < $10k:
Vincent:
4.5% (95,162)
State:
4.3% (183,294)
Number of households with income $10k - 20k:
Vincent:
7.1% (150,376)
State:
6.0% (253,903)
Number of households with income $20k - 30k:
Vincent:
7.6% (160,944)
State:
6.8% (286,386)
Number of households with income $30k - 40k:
Vincent:
7.9% (167,524)
California:
7.4% (313,728)
Number of households with income $40k - 50k:
Vincent:
7.5% (158,720)
State:
7.4% (313,199)
Number of households with income $50k - 60k:
Vincent:
7.6% (161,110)
State:
7.2% (305,366)
Number of households with income $60k - 75k:
Vincent:
10.1% (214,243)
State:
10.3% (434,937)
Number of households with income $75k - 100k:
Vincent:
14.6% (309,618)
California:
14.4% (607,302)
Number of households with income $100k - 125k:
Vincent:
9.9% (209,164)
State:
10.6% (447,424)
Number of households with income $125k - 150k:
Vincent:
7.2% (152,731)
State:
7.5% (316,022)
Number of households with income $150k - 200k:
Vincent:
8.3% (174,830)
California:
9.2% (386,269)
Number of households with income > $200k:
Vincent:
7.6% (161,637)
State:
8.8% (372,651)
Aggregate household income in Vincent in 2022: $7,177,990,178
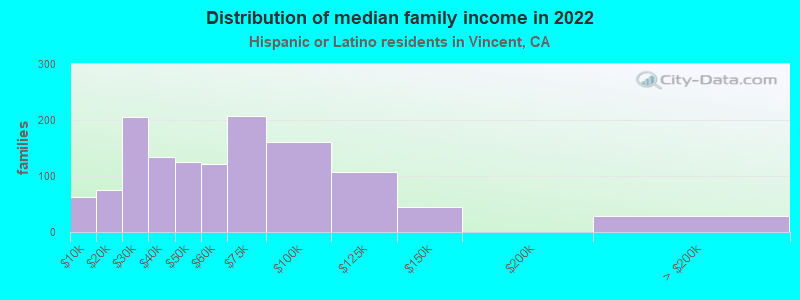
Median family income in Vincent in 2022:
Vincent:
$110,324
State:
$77,589
Number of families with income < $10k:
Vincent:
5.0% (63)
State:
3.9% (129,468)
Number of families with income $10k - 20k:
Vincent:
5.9% (75)
California:
4.6% (151,997)
Number of families with income $20k - 30k:
Vincent:
16.1% (205)
California:
6.6% (216,764)
Number of families with income $30k - 40k:
Vincent:
10.5% (134)
California:
7.6% (249,849)
Number of families with income $40k - 50k:
Vincent:
9.8% (125)
State:
7.7% (254,822)
Number of families with income $50k - 60k:
Vincent:
9.6% (122)
California:
7.4% (244,815)
Number of families with income $60k - 75k:
Vincent:
16.4% (208)
California:
10.5% (345,838)
Number of families with income $75k - 100k:
Vincent:
12.7% (161)
State:
14.9% (491,589)
Number of families with income $100k - 125k:
Vincent:
8.4% (107)
State:
10.7% (355,400)
Number of families with income $125k - 150k:
Vincent:
3.5% (45)
State:
7.8% (259,317)
Number of families with income > $200k:
Vincent:
2.2% (28)
State:
9.1% (299,984)
Median non-family income in Vincent in 2022:
Vincent:
$103,243
State:
$49,746
Change in median non-family income between 2000 and 2022:
Vincent, California:
+107.5%
State:
+100.7%
Median per capita income in Vincent in 2022:
Vincent:
$31,629
State:
$27,240
Change in median per capita income between 2000 and 2022:
Vincent, California:
+138.1%
State:
+133.3%
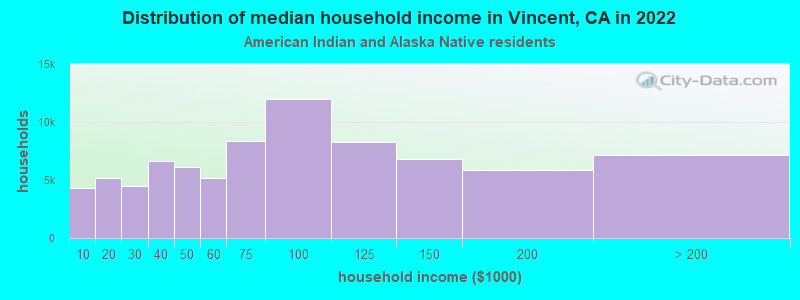
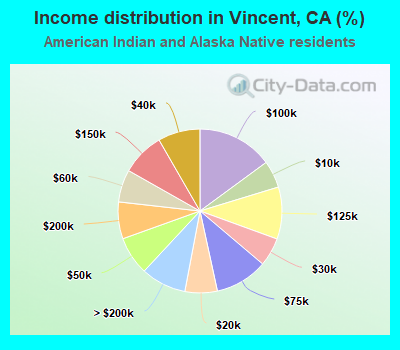
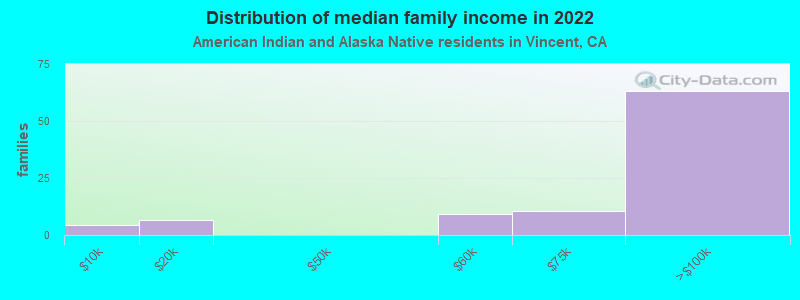
Income statistics for American Indian and Alaska Native residents
Median household income in Vincent, CA in 2022:
Vincent:
$138,795
California:
$76,752
Change in median household income between 2000 and 2022:
Vincent, California:
+106.6%
California:
+110.0%
Number of households with income < $10k:
Vincent:
5.4% (4,308)
State:
5.4% (8,471)
Number of households with income $10k - 20k:
Vincent:
6.4% (5,132)
California:
6.0% (9,381)
Number of households with income $20k - 30k:
Vincent:
5.6% (4,523)
State:
5.5% (8,668)
Number of households with income $30k - 40k:
Vincent:
8.3% (6,673)
State:
8.3% (13,030)
Number of households with income $40k - 50k:
Vincent:
7.6% (6,091)
California:
6.9% (10,908)
Number of households with income $50k - 60k:
Vincent:
6.4% (5,147)
California:
7.1% (11,198)
Number of households with income $60k - 75k:
Vincent:
10.4% (8,354)
State:
9.6% (15,190)
Number of households with income $75k - 100k:
Vincent:
14.9% (11,980)
California:
14.1% (22,274)
Number of households with income $100k - 125k:
Vincent:
10.3% (8,237)
State:
11.2% (17,643)
Number of households with income $125k - 150k:
Vincent:
8.5% (6,810)
State:
8.3% (13,117)
Number of households with income $150k - 200k:
Vincent:
7.3% (5,848)
State:
8.8% (13,853)
Number of households with income > $200k:
Vincent:
8.9% (7,175)
California:
8.8% (13,925)
Aggregate household income in Vincent in 2022: $12,928,780
Median family income in Vincent in 2022:
Vincent:
$136,467
State:
$81,108
Number of families with income < $10k:
Vincent:
4.5% (4)
California:
5.0% (5,711)
Number of families with income $10k - 20k:
Vincent:
7.1% (7)
California:
3.7% (4,148)
Number of families with income $50k - 60k:
Vincent:
9.9% (9)
State:
6.9% (7,834)
Number of families with income $60k - 75k:
Vincent:
11.3% (11)
State:
9.1% (10,247)
Number of families with income $75k - 100k:
Vincent:
67.2% (63)
State:
14.8% (16,731)
Median non-family income in Vincent in 2022:
Vincent:
$310,524
State:
$51,296
Change in median non-family income between 2000 and 2022:
Vincent, California:
+103.8%
State:
+114.0%
Median per capita income in Vincent in 2022:
Vincent:
$36,714
California:
$30,289
Change in median per capita income between 2000 and 2022:
Vincent, California:
+111.4%
State:
+98.9%
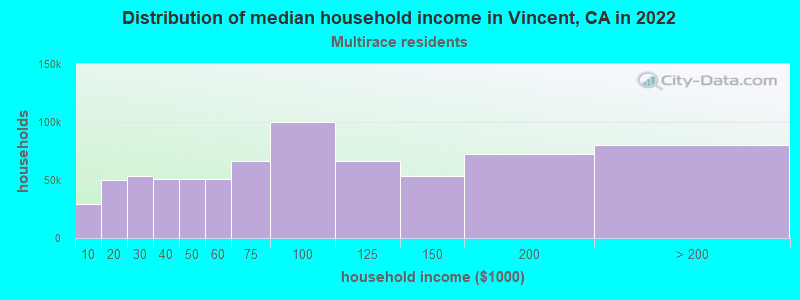
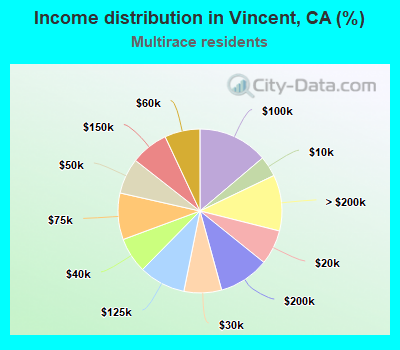
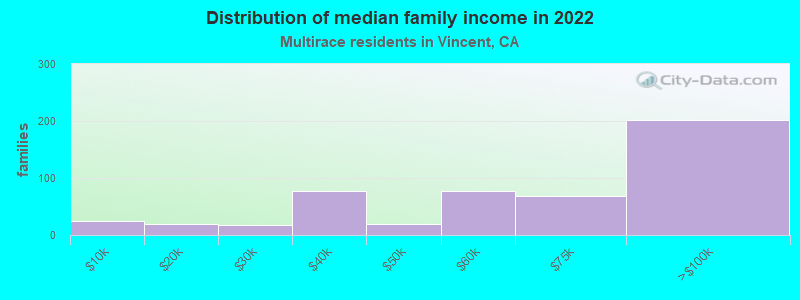
Income statistics for Multirace residents
Median household income in Vincent, CA in 2022:
Vincent:
$97,490
California:
$83,153
Change in median household income between 2000 and 2022:
Vincent, California:
+112.7%
State:
+106.0%
Number of households with income < $10k:
Vincent:
4.1% (29,508)
California:
4.2% (85,299)
Number of households with income $10k - 20k:
Vincent:
6.9% (49,805)
California:
6.1% (122,966)
Number of households with income $20k - 30k:
Vincent:
7.4% (53,828)
State:
6.4% (129,328)
Number of households with income $30k - 40k:
Vincent:
7.0% (50,733)
State:
6.4% (130,070)
Number of households with income $40k - 50k:
Vincent:
7.0% (51,073)
California:
6.5% (131,254)
Number of households with income $50k - 60k:
Vincent:
7.0% (50,501)
State:
6.5% (132,382)
Number of households with income $60k - 75k:
Vincent:
9.2% (66,547)
State:
9.4% (191,472)
Number of households with income $75k - 100k:
Vincent:
13.8% (100,122)
State:
13.3% (269,691)
Number of households with income $100k - 125k:
Vincent:
9.2% (66,556)
State:
10.2% (207,286)
Number of households with income $125k - 150k:
Vincent:
7.4% (53,878)
State:
7.8% (158,259)
Number of households with income $150k - 200k:
Vincent:
9.9% (72,086)
State:
10.3% (209,227)
Number of households with income > $200k:
Vincent:
11.0% (79,960)
California:
13.0% (263,210)
Aggregate household income in Vincent in 2022: $250,149,065
Median family income in Vincent in 2022:
Vincent:
$84,241
California:
$87,642
Number of families with income < $10k:
Vincent:
4.7% (24)
State:
3.2% (48,017)
Number of families with income $10k - 20k:
Vincent:
3.7% (19)
State:
4.1% (60,419)
Number of families with income $20k - 30k:
Vincent:
3.6% (18)
State:
6.1% (89,742)
Number of families with income $30k - 40k:
Vincent:
15.4% (78)
California:
6.2% (91,415)
Number of families with income $40k - 50k:
Vincent:
3.8% (19)
State:
6.8% (100,085)
Number of families with income $50k - 60k:
Vincent:
15.4% (78)
California:
6.7% (98,298)
Number of families with income $60k - 75k:
Vincent:
13.5% (68)
State:
9.5% (140,131)
Number of families with income $75k - 100k:
Vincent:
39.9% (202)
State:
13.8% (203,439)
Median non-family income in Vincent in 2022:
Vincent:
$122,072
California:
$56,558
Change in median non-family income between 2000 and 2022:
Vincent, California:
+100.0%
State:
+100.2%
Median per capita income in Vincent in 2022:
Vincent:
$22,019
State:
$32,124
Change in median per capita income between 2000 and 2022:
Vincent, California:
+108.4%
California:
+120.4%
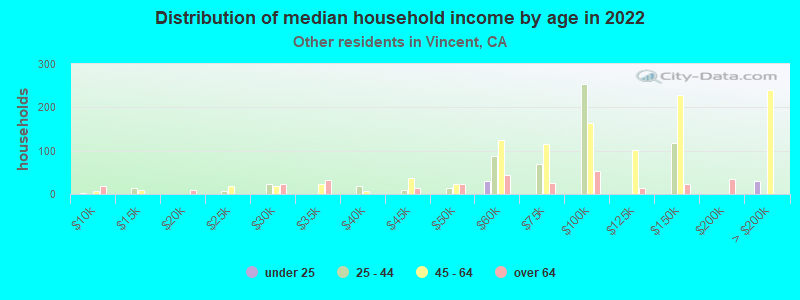
Income statistics for other residents
Number of households with income < $10k:
Vincent:
5.0% (1,083)
State:
4.6% (93,035)
Number of households with income $10k - 20k:
Vincent:
7.4% (1,591)
California:
6.3% (126,222)
Number of households with income $20k - 30k:
Vincent:
7.8% (1,672)
California:
7.1% (142,656)
Number of households with income $30k - 40k:
Vincent:
8.5% (1,826)
State:
8.2% (165,018)
Number of households with income $40k - 50k:
Vincent:
7.9% (1,704)
California:
8.0% (161,732)
Number of households with income $50k - 60k:
Vincent:
8.0% (1,717)
State:
7.6% (152,152)
Number of households with income $60k - 75k:
Vincent:
10.5% (2,242)
California:
10.4% (209,951)
Number of households with income $75k - 100k:
Vincent:
14.7% (3,150)
State:
14.7% (296,102)
Number of households with income $100k - 125k:
Vincent:
10.0% (2,144)
California:
10.7% (214,281)
Number of households with income $125k - 150k:
Vincent:
6.9% (1,473)
State:
7.1% (143,092)
Number of households with income $150k - 200k:
Vincent:
7.5% (1,605)
State:
8.6% (172,215)
Number of households with income > $200k:
Vincent:
5.8% (1,246)
California:
6.7% (134,102)
Aggregate household income in Vincent in 2022: $1,801,465,924
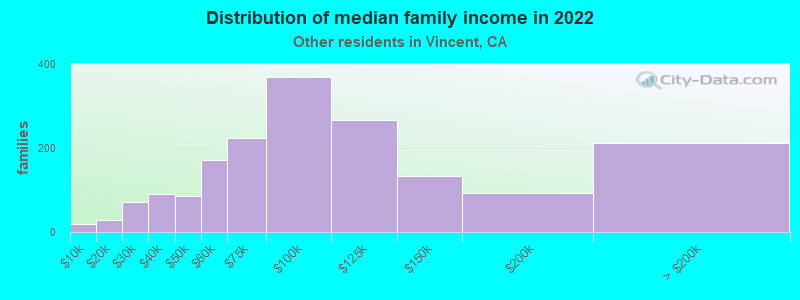
Median family income in Vincent in 2022:
Vincent:
$112,022
California:
$72,756
Number of families with income < $10k:
Vincent:
1.0% (18)
California:
4.3% (69,090)
Number of families with income $10k - 20k:
Vincent:
1.6% (28)
California:
5.1% (82,116)
Number of families with income $20k - 30k:
Vincent:
4.1% (72)
State:
7.0% (112,854)
Number of families with income $30k - 40k:
Vincent:
5.1% (90)
California:
8.4% (135,938)
Number of families with income $40k - 50k:
Vincent:
4.9% (86)
State:
8.4% (135,353)
Number of families with income $50k - 60k:
Vincent:
9.7% (172)
State:
7.7% (124,826)
Number of families with income $60k - 75k:
Vincent:
12.7% (224)
State:
10.7% (173,628)
Number of families with income $75k - 100k:
Vincent:
20.9% (368)
State:
15.2% (245,724)
Number of families with income $100k - 125k:
Vincent:
15.1% (266)
California:
10.9% (176,716)
Number of families with income $125k - 150k:
Vincent:
7.6% (134)
State:
7.4% (119,985)
Number of families with income $150k - 200k:
Vincent:
5.2% (92)
State:
8.5% (137,332)
Number of families with income > $200k:
Vincent:
12.1% (213)
California:
6.6% (106,346)
Median non-family income in Vincent in 2022:
Vincent:
$88,607
State:
$43,881
Change in median non-family income between 2000 and 2022:
Vincent, California:
+84.3%
State:
+84.6%
Median per capita income in Vincent in 2022:
Vincent:
$32,836
State:
$25,164
Change in median per capita income between 2000 and 2022:
Vincent, California:
+144.3%
California:
+137.9%
Discuss Vincent, California (CA) on our hugely popular California forum.