Yarmouth, Massachusetts (MA) income map, earnings map, and wages data
The median household income in Yarmouth, MA in 2022 was $79,245, which was 19.2% less than the median annual income of $94,488 across the entire state of Massachusetts. Compared to the median income of $39,808 in 2000 this represents an increase of 49.8%. The per capita income in 2022 was $54,198, which means an increase of 58.1% compared to 2000 when it was $22,731.
Income statistics for all residents
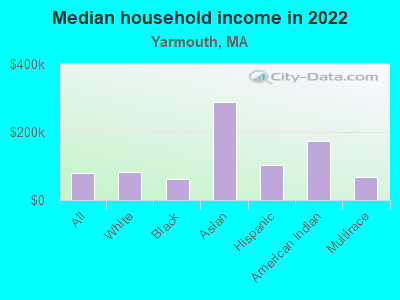
Median household income in Yarmouth, MA in 2022:| Yarmouth: | $79,245 |
| State: | $94,488 |
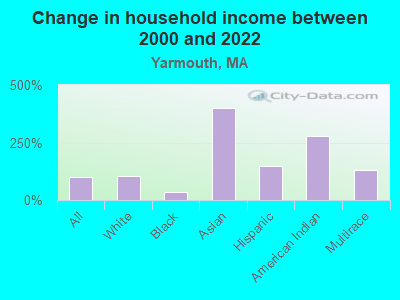
Change in median household income between 2000 and 2022:| Yarmouth, Massachusetts: | +99.1% |
| State: | +87.1% |
Number of households with income < $10k:| Yarmouth: | 4.0% (3,727) |
| Massachusetts: | 5.2% (146,170) |
Number of households with income $10k - 20k:| Yarmouth: | 5.8% (5,345) |
| Massachusetts: | 6.4% (180,001) |
Number of households with income $20k - 30k:| Yarmouth: | 5.1% (4,704) |
| State: | 5.6% (156,667) |
Number of households with income $30k - 40k:| Yarmouth: | 5.2% (4,827) |
| State: | 5.6% (157,168) |
Number of households with income $40k - 50k:| Yarmouth: | 6.0% (5,599) |
| State: | 5.4% (151,455) |
Number of households with income $50k - 60k:| Yarmouth: | 5.5% (5,100) |
| State: | 5.1% (142,726) |
Number of households with income $60k - 75k:| Yarmouth: | 9.9% (9,210) |
| State: | 7.6% (212,203) |
Number of households with income $75k - 100k:| Yarmouth: | 11.6% (10,811) |
| State: | 11.3% (317,064) |
Number of households with income $100k - 125k:| Yarmouth: | 10.4% (9,649) |
| State: | 9.7% (270,603) |
Number of households with income $125k - 150k:| Yarmouth: | 7.5% (6,949) |
| Massachusetts: | 8.0% (223,140) |
Number of households with income $150k - 200k:| Yarmouth: | 12.6% (11,710) |
| State: | 11.0% (308,695) |
Number of households with income > $200k:| Yarmouth: | 16.4% (15,262) |
| Massachusetts: | 19.0% (531,884) |
Aggregate household income in Yarmouth in 2022: $3,673,284,254
Median family income in Yarmouth in 2022:| Yarmouth: | $101,688 |
| State: | $120,263 |
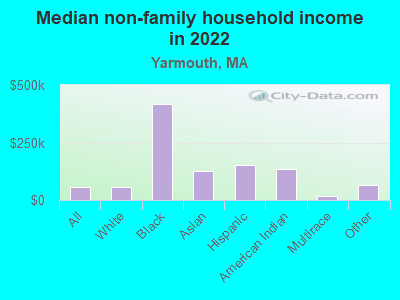
Median non-family income in Yarmouth in 2022:| Yarmouth: | $56,577 |
| State: | $55,979 |
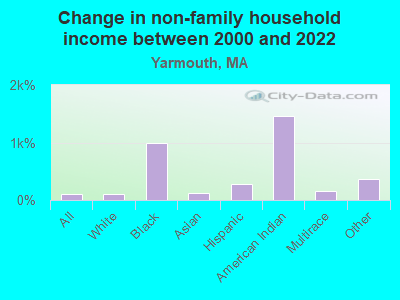
Change in median non-family income between 2000 and 2022:| Yarmouth, Massachusetts: | +103.0% |
| State: | +88.0% |
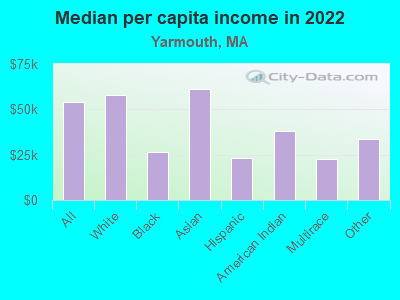
Median per capita income in Yarmouth in 2022:| Yarmouth: | $54,199 |
| State: | $54,025 |
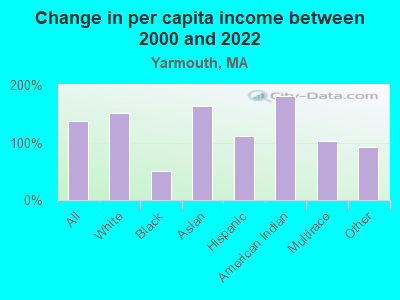
Change in median per capita income between 2000 and 2022:| Yarmouth, Massachusetts: | +138.4% |
| Massachusetts: | +108.2% |
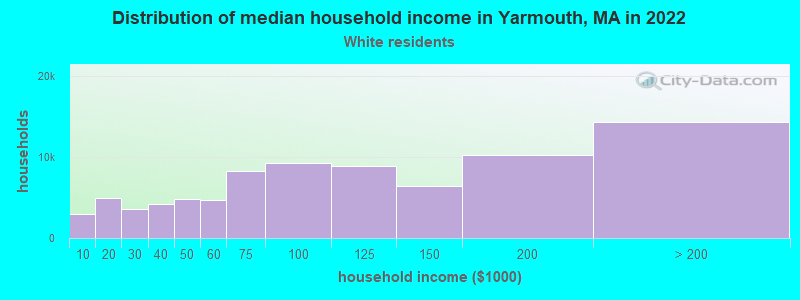
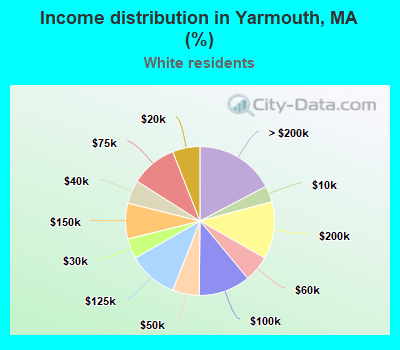
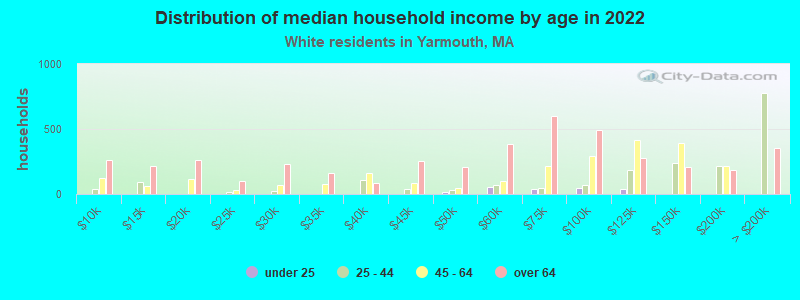
Income statistics for White residents
Median household income in Yarmouth, MA in 2022:| Yarmouth: | $81,454 |
| State: | $101,391 |
Change in median household income between 2000 and 2022:| Yarmouth, Massachusetts: | +105.6% |
| State: | +93.3% |
Number of households with income < $10k:| Yarmouth: | 3.5% (2,914) |
| Massachusetts: | 4.4% (91,120) |
Number of households with income $10k - 20k:| Yarmouth: | 6.0% (4,924) |
| State: | 5.9% (122,055) |
Number of households with income $20k - 30k:| Yarmouth: | 4.4% (3,615) |
| Massachusetts: | 5.1% (105,311) |
Number of households with income $30k - 40k:| Yarmouth: | 5.1% (4,219) |
| Massachusetts: | 5.3% (110,239) |
Number of households with income $40k - 50k:| Yarmouth: | 5.8% (4,788) |
| State: | 5.0% (104,636) |
Number of households with income $50k - 60k:| Yarmouth: | 5.7% (4,681) |
| State: | 4.8% (99,486) |
Number of households with income $60k - 75k:| Yarmouth: | 10.1% (8,301) |
| State: | 7.5% (155,124) |
Number of households with income $75k - 100k:| Yarmouth: | 11.2% (9,270) |
| State: | 11.4% (236,252) |
Number of households with income $100k - 125k:| Yarmouth: | 10.8% (8,901) |
| State: | 9.9% (204,731) |
Number of households with income $125k - 150k:| Yarmouth: | 7.8% (6,405) |
| Massachusetts: | 8.5% (175,324) |
Number of households with income $150k - 200k:| Yarmouth: | 12.4% (10,275) |
| State: | 11.7% (242,980) |
Number of households with income > $200k:| Yarmouth: | 17.3% (14,303) |
| State: | 20.5% (425,966) |
Aggregate household income in Yarmouth in 2022: $3,320,220,652
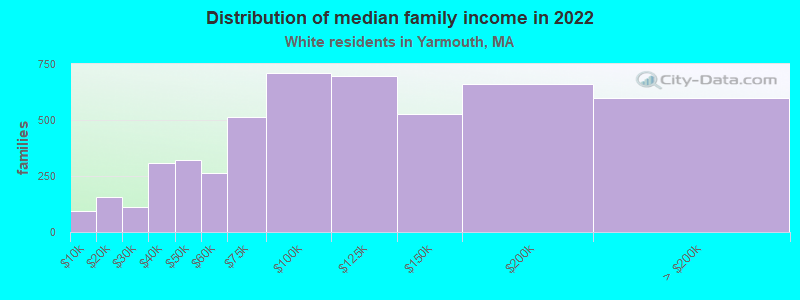
Median family income in Yarmouth in 2022:| Yarmouth: | $106,832 |
| Massachusetts: | $133,153 |
Number of families with income < $10k:| Yarmouth: | 1.9% (95) |
| State: | 2.0% (25,038) |
Number of families with income $10k - 20k:| Yarmouth: | 3.2% (157) |
| Massachusetts: | 2.1% (26,403) |
Number of families with income $20k - 30k:| Yarmouth: | 2.2% (110) |
| Massachusetts: | 2.6% (32,525) |
Number of families with income $30k - 40k:| Yarmouth: | 6.2% (306) |
| Massachusetts: | 3.9% (48,079) |
Number of families with income $40k - 50k:| Yarmouth: | 6.5% (321) |
| State: | 3.8% (46,908) |
Number of families with income $50k - 60k:| Yarmouth: | 5.3% (263) |
| State: | 3.8% (46,476) |
Number of families with income $60k - 75k:| Yarmouth: | 10.4% (514) |
| Massachusetts: | 6.4% (79,040) |
Number of families with income $75k - 100k:| Yarmouth: | 14.3% (708) |
| State: | 11.1% (137,395) |
Number of families with income $100k - 125k:| Yarmouth: | 14.0% (696) |
| State: | 11.1% (136,771) |
Number of families with income $125k - 150k:| Yarmouth: | 10.7% (528) |
| Massachusetts: | 10.0% (123,709) |
Number of families with income $150k - 200k:| Yarmouth: | 13.3% (662) |
| State: | 14.7% (181,602) |
Number of families with income > $200k:| Yarmouth: | 12.0% (597) |
| State: | 28.5% (351,887) |
Median non-family income in Yarmouth in 2022:| Yarmouth: | $54,952 |
| State: | $59,323 |
Change in median non-family income between 2000 and 2022:| Yarmouth, Massachusetts: | +96.7% |
| State: | +94.3% |
Median per capita income in Yarmouth in 2022:| Yarmouth: | $57,852 |
| State: | $60,804 |
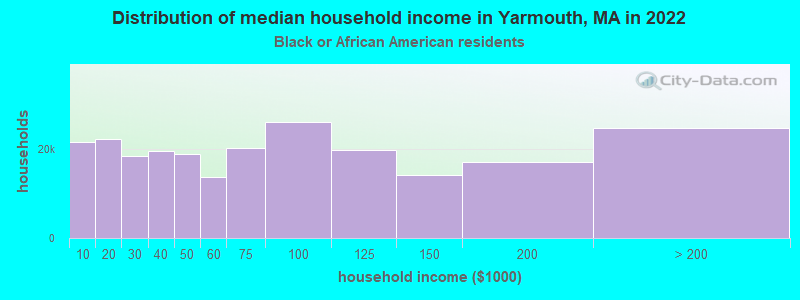
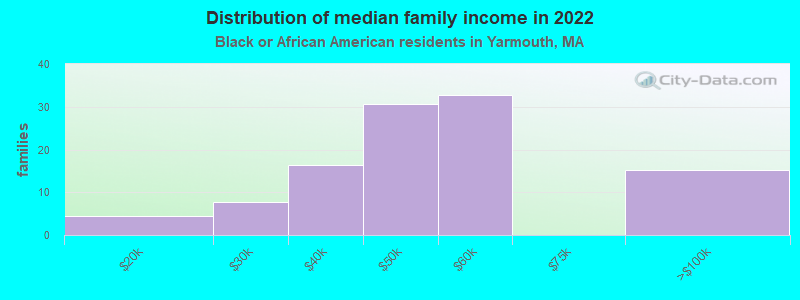
Income statistics for Black or African American residents
Median household income in Yarmouth, MA in 2022:| Yarmouth: | $62,569 |
| State: | $63,189 |
Change in median household income between 2000 and 2022:| Yarmouth, Massachusetts: | +36.2% |
| State: | +87.4% |
Number of households with income < $10k:| Yarmouth: | 9.1% (21,521) |
| State: | 9.1% (15,797) |
Number of households with income $10k - 20k:| Yarmouth: | 9.4% (22,161) |
| Massachusetts: | 9.4% (16,267) |
Number of households with income $20k - 30k:| Yarmouth: | 7.8% (18,419) |
| Massachusetts: | 7.8% (13,520) |
Number of households with income $30k - 40k:| Yarmouth: | 8.3% (19,634) |
| State: | 8.3% (14,412) |
Number of households with income $40k - 50k:| Yarmouth: | 7.9% (18,787) |
| State: | 7.9% (13,790) |
Number of households with income $50k - 60k:| Yarmouth: | 5.8% (13,679) |
| State: | 5.8% (10,041) |
Number of households with income $60k - 75k:| Yarmouth: | 8.5% (20,193) |
| State: | 8.5% (14,822) |
Number of households with income $75k - 100k:| Yarmouth: | 11.0% (26,051) |
| State: | 11.0% (19,122) |
Number of households with income $100k - 125k:| Yarmouth: | 8.4% (19,856) |
| State: | 8.4% (14,575) |
Number of households with income $125k - 150k:| Yarmouth: | 6.0% (14,208) |
| State: | 6.0% (10,429) |
Number of households with income $150k - 200k:| Yarmouth: | 7.2% (17,083) |
| State: | 7.2% (12,539) |
Number of households with income > $200k:| Yarmouth: | 10.5% (24,774) |
| State: | 10.5% (18,185) |
Aggregate household income in Yarmouth in 2022: $21,655,147
Median family income in Yarmouth in 2022:| Yarmouth: | $89,713 |
| State: | $79,815 |
Number of families with income $10k - 20k:| Yarmouth: | 4.2% (5) |
| State: | 6.8% (7,412) |
Number of families with income $20k - 30k:| Yarmouth: | 7.3% (8) |
| State: | 6.6% (7,274) |
Number of families with income $30k - 40k:| Yarmouth: | 15.2% (16) |
| State: | 6.4% (7,002) |
Number of families with income $40k - 50k:| Yarmouth: | 28.5% (31) |
| State: | 7.9% (8,656) |
Number of families with income $50k - 60k:| Yarmouth: | 30.6% (33) |
| Massachusetts: | 6.4% (6,986) |
Number of families with income $75k - 100k:| Yarmouth: | 14.2% (15) |
| State: | 11.5% (12,654) |
Median non-family income in Yarmouth in 2022:| Yarmouth: | $417,801 |
| State: | $38,934 |
Median per capita income in Yarmouth in 2022:| Yarmouth: | $26,508 |
| State: | $33,524 |
Change in median per capita income between 2000 and 2022:| Yarmouth, Massachusetts: | +50.9% |
| Massachusetts: | +109.4% |
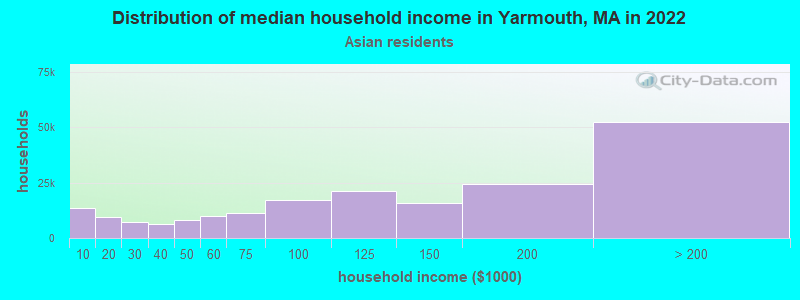
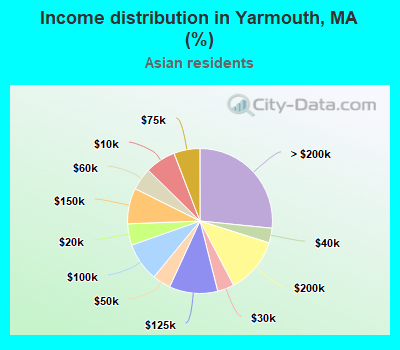
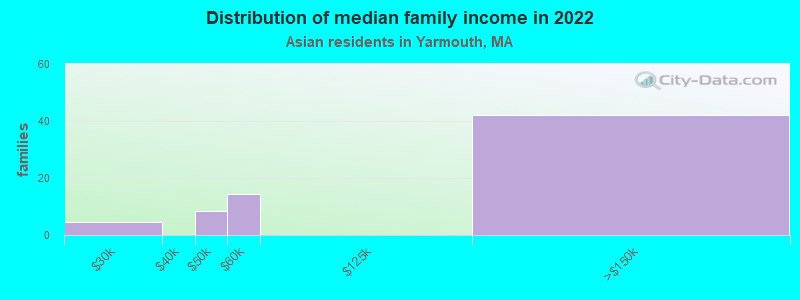
Income statistics for Asian residents
Median household income in Yarmouth, MA in 2022:| Yarmouth: | $287,257 |
| Massachusetts: | $117,855 |
Number of households with income < $10k:| Yarmouth: | 6.8% (13,458) |
| State: | 6.8% (11,982) |
Number of households with income $10k - 20k:| Yarmouth: | 4.8% (9,408) |
| Massachusetts: | 4.8% (8,376) |
Number of households with income $20k - 30k:| Yarmouth: | 3.7% (7,366) |
| State: | 3.7% (6,558) |
Number of households with income $30k - 40k:| Yarmouth: | 3.3% (6,456) |
| State: | 3.3% (5,748) |
Number of households with income $40k - 50k:| Yarmouth: | 4.1% (8,078) |
| Massachusetts: | 4.1% (7,192) |
Number of households with income $50k - 60k:| Yarmouth: | 5.0% (9,810) |
| Massachusetts: | 5.0% (8,734) |
Number of households with income $60k - 75k:| Yarmouth: | 5.8% (11,460) |
| State: | 5.8% (10,203) |
Number of households with income $75k - 100k:| Yarmouth: | 8.6% (17,021) |
| Massachusetts: | 8.6% (15,154) |
Number of households with income $100k - 125k:| Yarmouth: | 10.8% (21,275) |
| Massachusetts: | 10.8% (18,942) |
Number of households with income $125k - 150k:| Yarmouth: | 8.0% (15,766) |
| State: | 8.0% (14,037) |
Number of households with income $150k - 200k:| Yarmouth: | 12.5% (24,548) |
| Massachusetts: | 12.5% (21,856) |
Number of households with income > $200k:| Yarmouth: | 26.6% (52,446) |
| State: | 26.6% (46,694) |
Aggregate household income in Yarmouth in 2022: $17,656,394
Median family income in Yarmouth in 2022:| Yarmouth: | $328,022 |
| Massachusetts: | $140,113 |
Number of families with income $20k - 30k:| Yarmouth: | 6.5% (5) |
| Massachusetts: | 2.3% (2,708) |
Number of families with income $40k - 50k:| Yarmouth: | 12.0% (8) |
| Massachusetts: | 3.9% (4,621) |
Number of families with income $50k - 60k:| Yarmouth: | 20.7% (14) |
| State: | 3.9% (4,606) |
Number of families with income $125k - 150k:| Yarmouth: | 60.8% (42) |
| State: | 8.6% (10,071) |
Median non-family income in Yarmouth in 2022:| Yarmouth: | $128,251 |
| Massachusetts: | $71,440 |
Change in median non-family income between 2000 and 2022:| Yarmouth, Massachusetts: | +128.0% |
| Massachusetts: | +128.0% |
Median per capita income in Yarmouth in 2022:| Yarmouth: | $61,412 |
| Massachusetts: | $58,900 |
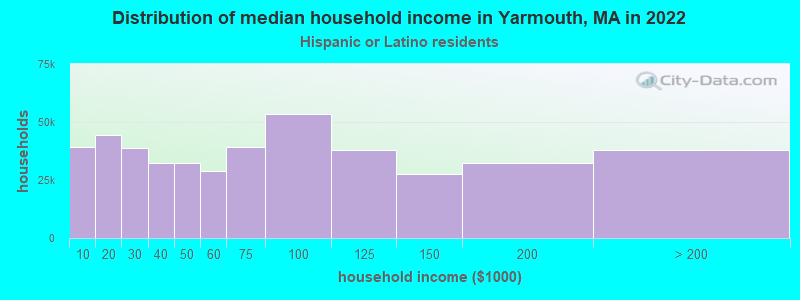
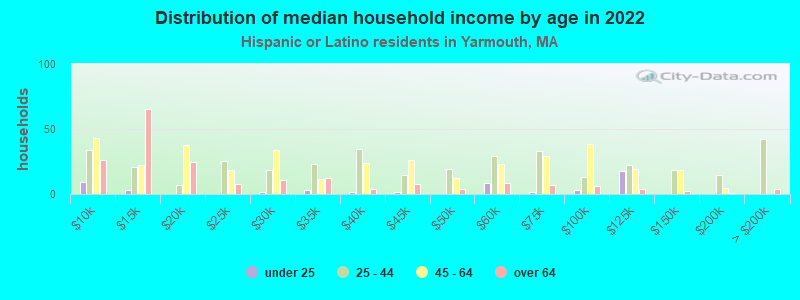
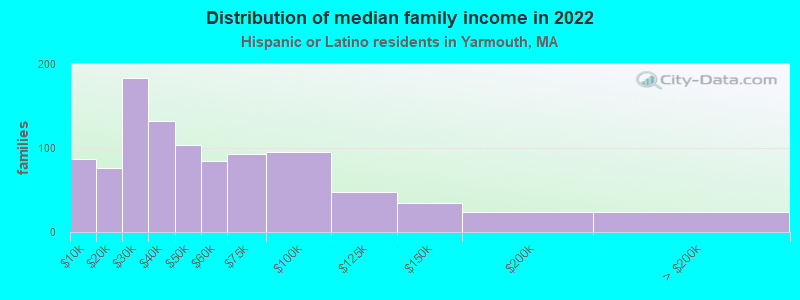
Income statistics for Hispanic or Latino residents
Median household income in Yarmouth, MA in 2022:| Yarmouth: | $104,384 |
| State: | $61,523 |
Change in median household income between 2000 and 2022:| Yarmouth, Massachusetts: | +147.7% |
| Massachusetts: | +125.4% |
Number of households with income < $10k:| Yarmouth: | 8.8% (39,066) |
| State: | 8.8% (25,307) |
Number of households with income $10k - 20k:| Yarmouth: | 10.0% (44,232) |
| Massachusetts: | 10.0% (28,653) |
Number of households with income $20k - 30k:| Yarmouth: | 8.8% (38,885) |
| State: | 8.8% (25,189) |
Number of households with income $30k - 40k:| Yarmouth: | 7.2% (32,142) |
| State: | 7.2% (20,822) |
Number of households with income $40k - 50k:| Yarmouth: | 7.2% (32,135) |
| State: | 7.2% (20,817) |
Number of households with income $50k - 60k:| Yarmouth: | 6.5% (28,941) |
| State: | 6.5% (18,748) |
Number of households with income $60k - 75k:| Yarmouth: | 8.8% (39,195) |
| State: | 8.8% (25,390) |
Number of households with income $75k - 100k:| Yarmouth: | 12.0% (53,239) |
| Massachusetts: | 12.0% (34,488) |
Number of households with income $100k - 125k:| Yarmouth: | 8.6% (37,973) |
| State: | 8.6% (24,599) |
Number of households with income $125k - 150k:| Yarmouth: | 6.2% (27,390) |
| State: | 6.2% (17,743) |
Number of households with income $150k - 200k:| Yarmouth: | 7.3% (32,444) |
| Massachusetts: | 7.3% (21,017) |
Number of households with income > $200k:| Yarmouth: | 8.6% (37,984) |
| Massachusetts: | 8.6% (24,606) |
Aggregate household income in Yarmouth in 2022: $13,255,172
Median family income in Yarmouth in 2022:| Yarmouth: | $108,836 |
| State: | $66,072 |
Number of families with income < $10k:| Yarmouth: | 8.8% (87) |
| Massachusetts: | 6.2% (12,456) |
Number of families with income $10k - 20k:| Yarmouth: | 7.7% (76) |
| State: | 6.0% (12,071) |
Number of families with income $20k - 30k:| Yarmouth: | 18.6% (183) |
| Massachusetts: | 10.1% (20,376) |
Number of families with income $30k - 40k:| Yarmouth: | 13.4% (132) |
| State: | 8.2% (16,470) |
Number of families with income $40k - 50k:| Yarmouth: | 10.5% (103) |
| State: | 7.4% (14,829) |
Number of families with income $50k - 60k:| Yarmouth: | 8.5% (84) |
| State: | 7.3% (14,643) |
Number of families with income $60k - 75k:| Yarmouth: | 9.4% (93) |
| Massachusetts: | 10.6% (21,252) |
Number of families with income $75k - 100k:| Yarmouth: | 9.7% (95) |
| State: | 12.0% (24,088) |
Number of families with income $100k - 125k:| Yarmouth: | 4.9% (48) |
| Massachusetts: | 8.9% (17,954) |
Number of families with income $125k - 150k:| Yarmouth: | 3.5% (34) |
| State: | 6.9% (13,837) |
Number of families with income $150k - 200k:| Yarmouth: | 2.4% (24) |
| Massachusetts: | 7.3% (14,683) |
Number of families with income > $200k:| Yarmouth: | 2.5% (24) |
| State: | 9.3% (18,741) |
Median non-family income in Yarmouth in 2022:| Yarmouth: | $150,725 |
| Massachusetts: | $37,563 |
Median per capita income in Yarmouth in 2022:| Yarmouth: | $22,939 |
| State: | $28,993 |
Change in median per capita income between 2000 and 2022:| Yarmouth, Massachusetts: | +111.4% |
| Massachusetts: | +142.4% |
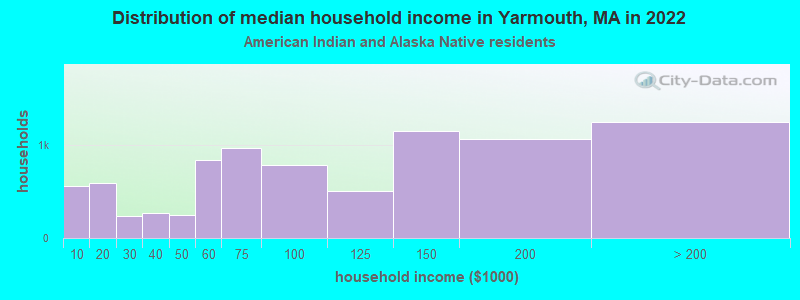
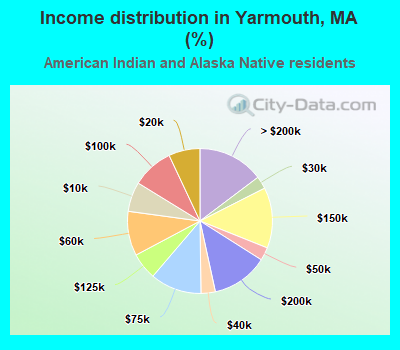
Income statistics for American Indian and Alaska Native residents
Median household income in Yarmouth, MA in 2022:| Yarmouth: | $172,081 |
| Massachusetts: | $87,730 |
Number of households with income < $10k:| Yarmouth: | 6.6% (559) |
| Massachusetts: | 6.6% (451) |
Number of households with income $10k - 20k:| Yarmouth: | 7.0% (590) |
| Massachusetts: | 7.0% (476) |
Number of households with income $20k - 30k:| Yarmouth: | 2.8% (238) |
| Massachusetts: | 2.8% (192) |
Number of households with income $30k - 40k:| Yarmouth: | 3.2% (270) |
| State: | 3.2% (218) |
Number of households with income $40k - 50k:| Yarmouth: | 2.9% (247) |
| Massachusetts: | 2.9% (199) |
Number of households with income $50k - 60k:| Yarmouth: | 9.9% (839) |
| Massachusetts: | 9.9% (677) |
Number of households with income $60k - 75k:| Yarmouth: | 11.5% (968) |
| Massachusetts: | 11.5% (781) |
Number of households with income $75k - 100k:| Yarmouth: | 9.2% (780) |
| Massachusetts: | 9.2% (629) |
Number of households with income $100k - 125k:| Yarmouth: | 6.0% (503) |
| State: | 6.0% (406) |
Number of households with income $125k - 150k:| Yarmouth: | 13.5% (1,142) |
| State: | 13.5% (921) |
Number of households with income $150k - 200k:| Yarmouth: | 12.6% (1,065) |
| State: | 12.6% (859) |
Number of households with income > $200k:| Yarmouth: | 14.7% (1,243) |
| Massachusetts: | 14.7% (1,003) |
Aggregate household income in Yarmouth in 2022: $1,221,915
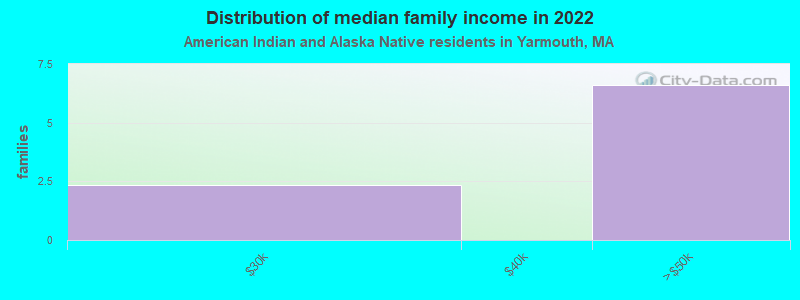
Median family income in Yarmouth in 2022:| Yarmouth: | $117,572 |
| Massachusetts: | $105,715 |
Median non-family income in Yarmouth in 2022:| Yarmouth: | $136,206 |
| Massachusetts: | $75,379 |
Median per capita income in Yarmouth in 2022:| Yarmouth: | $38,060 |
| State: | $39,434 |
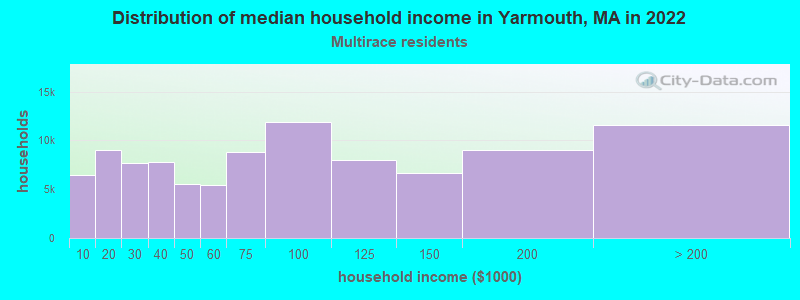
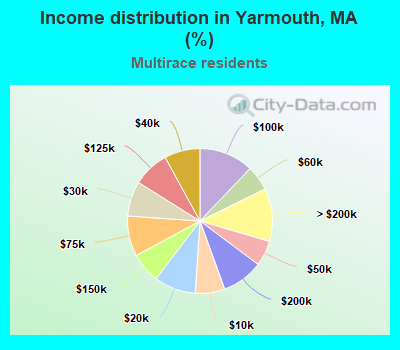
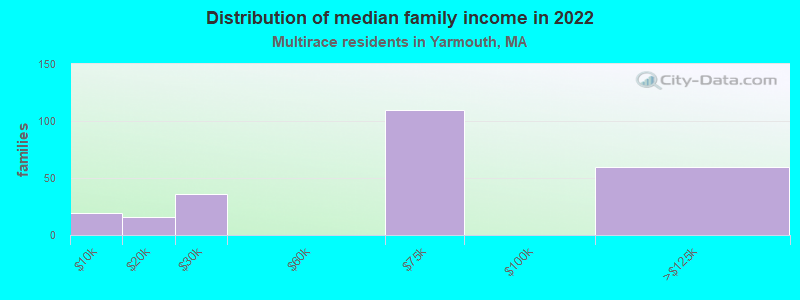
Income statistics for Multirace residents
Median household income in Yarmouth, MA in 2022:| Yarmouth: | $66,677 |
| Massachusetts: | $71,552 |
Change in median household income between 2000 and 2022:| Yarmouth, Massachusetts: | +129.9% |
| State: | +109.0% |
Number of households with income < $10k:| Yarmouth: | 6.6% (6,449) |
| Massachusetts: | 6.6% (15,127) |
Number of households with income $10k - 20k:| Yarmouth: | 9.3% (9,065) |
| State: | 9.2% (21,158) |
Number of households with income $20k - 30k:| Yarmouth: | 7.8% (7,640) |
| State: | 7.8% (18,016) |
Number of households with income $30k - 40k:| Yarmouth: | 8.0% (7,794) |
| State: | 7.9% (18,260) |
Number of households with income $40k - 50k:| Yarmouth: | 5.7% (5,531) |
| State: | 5.6% (13,027) |
Number of households with income $50k - 60k:| Yarmouth: | 5.6% (5,475) |
| State: | 5.6% (12,909) |
Number of households with income $60k - 75k:| Yarmouth: | 9.0% (8,806) |
| State: | 9.0% (20,800) |
Number of households with income $75k - 100k:| Yarmouth: | 12.1% (11,882) |
| Massachusetts: | 12.1% (27,875) |
Number of households with income $100k - 125k:| Yarmouth: | 8.1% (7,939) |
| Massachusetts: | 8.1% (18,754) |
Number of households with income $125k - 150k:| Yarmouth: | 6.8% (6,616) |
| Massachusetts: | 6.8% (15,621) |
Number of households with income $150k - 200k:| Yarmouth: | 9.2% (9,046) |
| Massachusetts: | 9.4% (21,618) |
Number of households with income > $200k:| Yarmouth: | 11.8% (11,585) |
| State: | 12.0% (27,592) |
Aggregate household income in Yarmouth in 2022: $24,022,469
Median family income in Yarmouth in 2022:| Yarmouth: | $61,523 |
| State: | $78,380 |
Number of families with income < $10k:| Yarmouth: | 8.1% (19) |
| State: | 4.5% (7,017) |
Number of families with income $10k - 20k:| Yarmouth: | 6.4% (16) |
| Massachusetts: | 4.9% (7,678) |
Number of families with income $20k - 30k:| Yarmouth: | 14.9% (36) |
| Massachusetts: | 8.5% (13,245) |
Number of families with income $60k - 75k:| Yarmouth: | 45.6% (110) |
| Massachusetts: | 10.3% (16,064) |
Number of families with income $100k - 125k:| Yarmouth: | 25.0% (60) |
| State: | 7.9% (12,321) |
Median non-family income in Yarmouth in 2022:| Yarmouth: | $16,239 |
| State: | $42,253 |
Median per capita income in Yarmouth in 2022:| Yarmouth: | $22,565 |
| Massachusetts: | $34,029 |
Change in median per capita income between 2000 and 2022:| Yarmouth, Massachusetts: | +103.4% |
| State: | +132.1% |
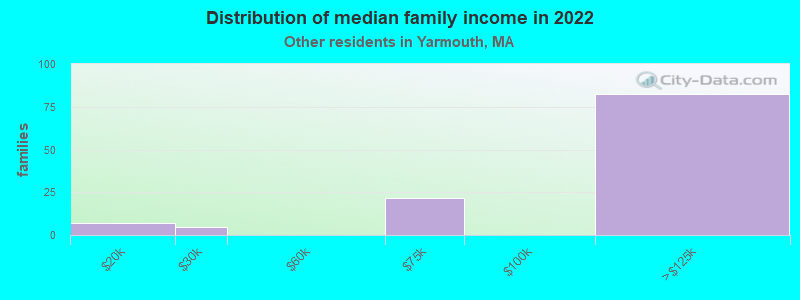
Income statistics for other residents
Number of households with income < $10k:| Yarmouth: | 8.3% (12) |
| Massachusetts: | 8.4% (11,559) |
Number of households with income $10k - 20k:| Yarmouth: | 9.0% (13) |
| State: | 8.4% (11,499) |
Number of households with income $20k - 30k:| Yarmouth: | 9.7% (14) |
| Massachusetts: | 9.5% (13,070) |
Number of households with income $30k - 40k:| Yarmouth: | 6.2% (9) |
| State: | 6.0% (8,291) |
Number of households with income $40k - 50k:| Yarmouth: | 9.0% (13) |
| State: | 9.2% (12,611) |
Number of households with income $50k - 60k:| Yarmouth: | 7.6% (11) |
| Massachusetts: | 7.9% (10,879) |
Number of households with income $60k - 75k:| Yarmouth: | 7.6% (11) |
| State: | 7.5% (10,239) |
Number of households with income $75k - 100k:| Yarmouth: | 13.1% (19) |
| Massachusetts: | 13.1% (18,032) |
Number of households with income $100k - 125k:| Yarmouth: | 9.7% (14) |
| Massachusetts: | 9.6% (13,141) |
Number of households with income $125k - 150k:| Yarmouth: | 4.8% (7) |
| State: | 5.0% (6,808) |
Number of households with income $150k - 200k:| Yarmouth: | 6.2% (9) |
| Massachusetts: | 6.4% (8,843) |
Number of households with income > $200k:| Yarmouth: | 9.0% (13) |
| Massachusetts: | 9.0% (12,396) |
Aggregate household income in Yarmouth in 2022: $9,244,927
Median family income in Yarmouth in 2022:| Yarmouth: | $277,571 |
| State: | $66,840 |
Number of families with income $10k - 20k:| Yarmouth: | 6.1% (7) |
| State: | 4.7% (4,798) |
Number of families with income $20k - 30k:| Yarmouth: | 4.2% (5) |
| State: | 10.4% (10,595) |
Number of families with income $60k - 75k:| Yarmouth: | 18.6% (22) |
| State: | 8.5% (8,683) |
Number of families with income $100k - 125k:| Yarmouth: | 71.1% (82) |
| State: | 9.3% (9,480) |
Median non-family income in Yarmouth in 2022:| Yarmouth: | $64,536 |
| State: | $36,127 |
Median per capita income in Yarmouth in 2022:| Yarmouth: | $33,720 |
| State: | $30,797 |
Change in median per capita income between 2000 and 2022:| Yarmouth, Massachusetts: | +91.6% |
| State: | +188.5% |