Banning, California Submit your own pictures of this city and show them to the world
OSM Map
General Map
Google Map
MSN Map
OSM Map
General Map
Google Map
MSN Map
OSM Map
General Map
Google Map
MSN Map
OSM Map
General Map
Google Map
MSN Map
Please wait while loading the map...
Population in 2022: 30,683 (98% urban, 2% rural). Population change since 2000: +30.2%Males: 15,019 Females: 15,664
March 2022 cost of living index in Banning: 82.6 (low, U.S. average is 100) Percentage of residents living in poverty in 2022: 18.9%for White Non-Hispanic residents , 36.5% for Black residents , 21.7% for Hispanic or Latino residents , 31.6% for American Indian residents , 24.9% for other race residents , 17.5% for two or more races residents )
Profiles of local businesses
Business Search - 14 Million verified businesses
Data:
Median household income ($)
Median household income (% change since 2000)
Household income diversity
Ratio of average income to average house value (%)
Ratio of average income to average rent
Median household income ($) - White
Median household income ($) - Black or African American
Median household income ($) - Asian
Median household income ($) - Hispanic or Latino
Median household income ($) - American Indian and Alaska Native
Median household income ($) - Multirace
Median household income ($) - Other Race
Median household income for houses/condos with a mortgage ($)
Median household income for apartments without a mortgage ($)
Races - White alone (%)
Races - White alone (% change since 2000)
Races - Black alone (%)
Races - Black alone (% change since 2000)
Races - American Indian alone (%)
Races - American Indian alone (% change since 2000)
Races - Asian alone (%)
Races - Asian alone (% change since 2000)
Races - Hispanic (%)
Races - Hispanic (% change since 2000)
Races - Native Hawaiian and Other Pacific Islander alone (%)
Races - Native Hawaiian and Other Pacific Islander alone (% change since 2000)
Races - Two or more races (%)
Races - Two or more races (% change since 2000)
Races - Other race alone (%)
Races - Other race alone (% change since 2000)
Racial diversity
Unemployment (%)
Unemployment (% change since 2000)
Unemployment (%) - White
Unemployment (%) - Black or African American
Unemployment (%) - Asian
Unemployment (%) - Hispanic or Latino
Unemployment (%) - American Indian and Alaska Native
Unemployment (%) - Multirace
Unemployment (%) - Other Race
Population density (people per square mile)
Population - Males (%)
Population - Females (%)
Population - Males (%) - White
Population - Males (%) - Black or African American
Population - Males (%) - Asian
Population - Males (%) - Hispanic or Latino
Population - Males (%) - American Indian and Alaska Native
Population - Males (%) - Multirace
Population - Males (%) - Other Race
Population - Females (%) - White
Population - Females (%) - Black or African American
Population - Females (%) - Asian
Population - Females (%) - Hispanic or Latino
Population - Females (%) - American Indian and Alaska Native
Population - Females (%) - Multirace
Population - Females (%) - Other Race
Coronavirus confirmed cases (Apr 15, 2024)
Deaths caused by coronavirus (Apr 15, 2024)
Coronavirus confirmed cases (per 100k population) (Apr 15, 2024)
Deaths caused by coronavirus (per 100k population) (Apr 15, 2024)
Daily increase in number of cases (Apr 15, 2024)
Weekly increase in number of cases (Apr 15, 2024)
Cases doubled (in days) (Apr 15, 2024)
Hospitalized patients (Apr 18, 2022)
Negative test results (Apr 18, 2022)
Total test results (Apr 18, 2022)
COVID Vaccine doses distributed (per 100k population) (Sep 19, 2023)
COVID Vaccine doses administered (per 100k population) (Sep 19, 2023)
COVID Vaccine doses distributed (Sep 19, 2023)
COVID Vaccine doses administered (Sep 19, 2023)
Likely homosexual households (%)
Likely homosexual households (% change since 2000)
Likely homosexual households - Lesbian couples (%)
Likely homosexual households - Lesbian couples (% change since 2000)
Likely homosexual households - Gay men (%)
Likely homosexual households - Gay men (% change since 2000)
Cost of living index
Median gross rent ($)
Median contract rent ($)
Median monthly housing costs ($)
Median house or condo value ($)
Median house or condo value ($ change since 2000)
Mean house or condo value by units in structure - 1, detached ($)
Mean house or condo value by units in structure - 1, attached ($)
Mean house or condo value by units in structure - 2 ($)
Mean house or condo value by units in structure by units in structure - 3 or 4 ($)
Mean house or condo value by units in structure - 5 or more ($)
Mean house or condo value by units in structure - Boat, RV, van, etc. ($)
Mean house or condo value by units in structure - Mobile home ($)
Median house or condo value ($) - White
Median house or condo value ($) - Black or African American
Median house or condo value ($) - Asian
Median house or condo value ($) - Hispanic or Latino
Median house or condo value ($) - American Indian and Alaska Native
Median house or condo value ($) - Multirace
Median house or condo value ($) - Other Race
Median resident age
Resident age diversity
Median resident age - Males
Median resident age - Females
Median resident age - White
Median resident age - Black or African American
Median resident age - Asian
Median resident age - Hispanic or Latino
Median resident age - American Indian and Alaska Native
Median resident age - Multirace
Median resident age - Other Race
Median resident age - Males - White
Median resident age - Males - Black or African American
Median resident age - Males - Asian
Median resident age - Males - Hispanic or Latino
Median resident age - Males - American Indian and Alaska Native
Median resident age - Males - Multirace
Median resident age - Males - Other Race
Median resident age - Females - White
Median resident age - Females - Black or African American
Median resident age - Females - Asian
Median resident age - Females - Hispanic or Latino
Median resident age - Females - American Indian and Alaska Native
Median resident age - Females - Multirace
Median resident age - Females - Other Race
Commute - mean travel time to work (minutes)
Travel time to work - Less than 5 minutes (%)
Travel time to work - Less than 5 minutes (% change since 2000)
Travel time to work - 5 to 9 minutes (%)
Travel time to work - 5 to 9 minutes (% change since 2000)
Travel time to work - 10 to 19 minutes (%)
Travel time to work - 10 to 19 minutes (% change since 2000)
Travel time to work - 20 to 29 minutes (%)
Travel time to work - 20 to 29 minutes (% change since 2000)
Travel time to work - 30 to 39 minutes (%)
Travel time to work - 30 to 39 minutes (% change since 2000)
Travel time to work - 40 to 59 minutes (%)
Travel time to work - 40 to 59 minutes (% change since 2000)
Travel time to work - 60 to 89 minutes (%)
Travel time to work - 60 to 89 minutes (% change since 2000)
Travel time to work - 90 or more minutes (%)
Travel time to work - 90 or more minutes (% change since 2000)
Marital status - Never married (%)
Marital status - Now married (%)
Marital status - Separated (%)
Marital status - Widowed (%)
Marital status - Divorced (%)
Median family income ($)
Median family income (% change since 2000)
Median non-family income ($)
Median non-family income (% change since 2000)
Median per capita income ($)
Median per capita income (% change since 2000)
Median family income ($) - White
Median family income ($) - Black or African American
Median family income ($) - Asian
Median family income ($) - Hispanic or Latino
Median family income ($) - American Indian and Alaska Native
Median family income ($) - Multirace
Median family income ($) - Other Race
Median year house/condo built
Median year apartment built
Year house built - Built 2005 or later (%)
Year house built - Built 2000 to 2004 (%)
Year house built - Built 1990 to 1999 (%)
Year house built - Built 1980 to 1989 (%)
Year house built - Built 1970 to 1979 (%)
Year house built - Built 1960 to 1969 (%)
Year house built - Built 1950 to 1959 (%)
Year house built - Built 1940 to 1949 (%)
Year house built - Built 1939 or earlier (%)
Average household size
Household density (households per square mile)
Average household size - White
Average household size - Black or African American
Average household size - Asian
Average household size - Hispanic or Latino
Average household size - American Indian and Alaska Native
Average household size - Multirace
Average household size - Other Race
Occupied housing units (%)
Vacant housing units (%)
Owner occupied housing units (%)
Renter occupied housing units (%)
Vacancy status - For rent (%)
Vacancy status - For sale only (%)
Vacancy status - Rented or sold, not occupied (%)
Vacancy status - For seasonal, recreational, or occasional use (%)
Vacancy status - For migrant workers (%)
Vacancy status - Other vacant (%)
Residents with income below the poverty level (%)
Residents with income below 50% of the poverty level (%)
Children below poverty level (%)
Poor families by family type - Married-couple family (%)
Poor families by family type - Male, no wife present (%)
Poor families by family type - Female, no husband present (%)
Poverty status for native-born residents (%)
Poverty status for foreign-born residents (%)
Poverty among high school graduates not in families (%)
Poverty among people who did not graduate high school not in families (%)
Residents with income below the poverty level (%) - White
Residents with income below the poverty level (%) - Black or African American
Residents with income below the poverty level (%) - Asian
Residents with income below the poverty level (%) - Hispanic or Latino
Residents with income below the poverty level (%) - American Indian and Alaska Native
Residents with income below the poverty level (%) - Multirace
Residents with income below the poverty level (%) - Other Race
Air pollution - Air Quality Index (AQI)
Air pollution - CO
Air pollution - NO2
Air pollution - SO2
Air pollution - Ozone
Air pollution - PM10
Air pollution - PM25
Air pollution - Pb
Crime - Murders per 100,000 population
Crime - Rapes per 100,000 population
Crime - Robberies per 100,000 population
Crime - Assaults per 100,000 population
Crime - Burglaries per 100,000 population
Crime - Thefts per 100,000 population
Crime - Auto thefts per 100,000 population
Crime - Arson per 100,000 population
Crime - City-data.com crime index
Crime - Violent crime index
Crime - Property crime index
Crime - Murders per 100,000 population (5 year average)
Crime - Rapes per 100,000 population (5 year average)
Crime - Robberies per 100,000 population (5 year average)
Crime - Assaults per 100,000 population (5 year average)
Crime - Burglaries per 100,000 population (5 year average)
Crime - Thefts per 100,000 population (5 year average)
Crime - Auto thefts per 100,000 population (5 year average)
Crime - Arson per 100,000 population (5 year average)
Crime - City-data.com crime index (5 year average)
Crime - Violent crime index (5 year average)
Crime - Property crime index (5 year average)
1996 Presidential Elections Results (%) - Democratic Party (Clinton)
1996 Presidential Elections Results (%) - Republican Party (Dole)
1996 Presidential Elections Results (%) - Other
2000 Presidential Elections Results (%) - Democratic Party (Gore)
2000 Presidential Elections Results (%) - Republican Party (Bush)
2000 Presidential Elections Results (%) - Other
2004 Presidential Elections Results (%) - Democratic Party (Kerry)
2004 Presidential Elections Results (%) - Republican Party (Bush)
2004 Presidential Elections Results (%) - Other
2008 Presidential Elections Results (%) - Democratic Party (Obama)
2008 Presidential Elections Results (%) - Republican Party (McCain)
2008 Presidential Elections Results (%) - Other
2012 Presidential Elections Results (%) - Democratic Party (Obama)
2012 Presidential Elections Results (%) - Republican Party (Romney)
2012 Presidential Elections Results (%) - Other
2016 Presidential Elections Results (%) - Democratic Party (Clinton)
2016 Presidential Elections Results (%) - Republican Party (Trump)
2016 Presidential Elections Results (%) - Other
2020 Presidential Elections Results (%) - Democratic Party (Biden)
2020 Presidential Elections Results (%) - Republican Party (Trump)
2020 Presidential Elections Results (%) - Other
Ancestries Reported - Arab (%)
Ancestries Reported - Czech (%)
Ancestries Reported - Danish (%)
Ancestries Reported - Dutch (%)
Ancestries Reported - English (%)
Ancestries Reported - French (%)
Ancestries Reported - French Canadian (%)
Ancestries Reported - German (%)
Ancestries Reported - Greek (%)
Ancestries Reported - Hungarian (%)
Ancestries Reported - Irish (%)
Ancestries Reported - Italian (%)
Ancestries Reported - Lithuanian (%)
Ancestries Reported - Norwegian (%)
Ancestries Reported - Polish (%)
Ancestries Reported - Portuguese (%)
Ancestries Reported - Russian (%)
Ancestries Reported - Scotch-Irish (%)
Ancestries Reported - Scottish (%)
Ancestries Reported - Slovak (%)
Ancestries Reported - Subsaharan African (%)
Ancestries Reported - Swedish (%)
Ancestries Reported - Swiss (%)
Ancestries Reported - Ukrainian (%)
Ancestries Reported - United States (%)
Ancestries Reported - Welsh (%)
Ancestries Reported - West Indian (%)
Ancestries Reported - Other (%)
Educational Attainment - No schooling completed (%)
Educational Attainment - Less than high school (%)
Educational Attainment - High school or equivalent (%)
Educational Attainment - Less than 1 year of college (%)
Educational Attainment - 1 or more years of college (%)
Educational Attainment - Associate degree (%)
Educational Attainment - Bachelor's degree (%)
Educational Attainment - Master's degree (%)
Educational Attainment - Professional school degree (%)
Educational Attainment - Doctorate degree (%)
School Enrollment - Nursery, preschool (%)
School Enrollment - Kindergarten (%)
School Enrollment - Grade 1 to 4 (%)
School Enrollment - Grade 5 to 8 (%)
School Enrollment - Grade 9 to 12 (%)
School Enrollment - College undergrad (%)
School Enrollment - Graduate or professional (%)
School Enrollment - Not enrolled in school (%)
School enrollment - Public schools (%)
School enrollment - Private schools (%)
School enrollment - Not enrolled (%)
Median number of rooms in houses and condos
Median number of rooms in apartments
Housing units lacking complete plumbing facilities (%)
Housing units lacking complete kitchen facilities (%)
Density of houses
Urban houses (%)
Rural houses (%)
Households with people 60 years and over (%)
Households with people 65 years and over (%)
Households with people 75 years and over (%)
Households with one or more nonrelatives (%)
Households with no nonrelatives (%)
Population in households (%)
Family households (%)
Nonfamily households (%)
Population in families (%)
Family households with own children (%)
Median number of bedrooms in owner occupied houses
Mean number of bedrooms in owner occupied houses
Median number of bedrooms in renter occupied houses
Mean number of bedrooms in renter occupied houses
Median number of vehichles in owner occupied houses
Mean number of vehichles in owner occupied houses
Median number of vehichles in renter occupied houses
Mean number of vehichles in renter occupied houses
Mortgage status - with mortgage (%)
Mortgage status - with second mortgage (%)
Mortgage status - with home equity loan (%)
Mortgage status - with both second mortgage and home equity loan (%)
Mortgage status - without a mortgage (%)
Average family size
Average family size - White
Average family size - Black or African American
Average family size - Asian
Average family size - Hispanic or Latino
Average family size - American Indian and Alaska Native
Average family size - Multirace
Average family size - Other Race
Geographical mobility - Same house 1 year ago (%)
Geographical mobility - Moved within same county (%)
Geographical mobility - Moved from different county within same state (%)
Geographical mobility - Moved from different state (%)
Geographical mobility - Moved from abroad (%)
Place of birth - Born in state of residence (%)
Place of birth - Born in other state (%)
Place of birth - Native, outside of US (%)
Place of birth - Foreign born (%)
Housing units in structures - 1, detached (%)
Housing units in structures - 1, attached (%)
Housing units in structures - 2 (%)
Housing units in structures - 3 or 4 (%)
Housing units in structures - 5 to 9 (%)
Housing units in structures - 10 to 19 (%)
Housing units in structures - 20 to 49 (%)
Housing units in structures - 50 or more (%)
Housing units in structures - Mobile home (%)
Housing units in structures - Boat, RV, van, etc. (%)
House/condo owner moved in on average (years ago)
Renter moved in on average (years ago)
Year householder moved into unit - Moved in 1999 to March 2000 (%)
Year householder moved into unit - Moved in 1995 to 1998 (%)
Year householder moved into unit - Moved in 1990 to 1994 (%)
Year householder moved into unit - Moved in 1980 to 1989 (%)
Year householder moved into unit - Moved in 1970 to 1979 (%)
Year householder moved into unit - Moved in 1969 or earlier (%)
Means of transportation to work - Drove car alone (%)
Means of transportation to work - Carpooled (%)
Means of transportation to work - Public transportation (%)
Means of transportation to work - Bus or trolley bus (%)
Means of transportation to work - Streetcar or trolley car (%)
Means of transportation to work - Subway or elevated (%)
Means of transportation to work - Railroad (%)
Means of transportation to work - Ferryboat (%)
Means of transportation to work - Taxicab (%)
Means of transportation to work - Motorcycle (%)
Means of transportation to work - Bicycle (%)
Means of transportation to work - Walked (%)
Means of transportation to work - Other means (%)
Working at home (%)
Industry diversity
Most Common Industries - Agriculture, forestry, fishing and hunting, and mining (%)
Most Common Industries - Agriculture, forestry, fishing and hunting (%)
Most Common Industries - Mining, quarrying, and oil and gas extraction (%)
Most Common Industries - Construction (%)
Most Common Industries - Manufacturing (%)
Most Common Industries - Wholesale trade (%)
Most Common Industries - Retail trade (%)
Most Common Industries - Transportation and warehousing, and utilities (%)
Most Common Industries - Transportation and warehousing (%)
Most Common Industries - Utilities (%)
Most Common Industries - Information (%)
Most Common Industries - Finance and insurance, and real estate and rental and leasing (%)
Most Common Industries - Finance and insurance (%)
Most Common Industries - Real estate and rental and leasing (%)
Most Common Industries - Professional, scientific, and management, and administrative and waste management services (%)
Most Common Industries - Professional, scientific, and technical services (%)
Most Common Industries - Management of companies and enterprises (%)
Most Common Industries - Administrative and support and waste management services (%)
Most Common Industries - Educational services, and health care and social assistance (%)
Most Common Industries - Educational services (%)
Most Common Industries - Health care and social assistance (%)
Most Common Industries - Arts, entertainment, and recreation, and accommodation and food services (%)
Most Common Industries - Arts, entertainment, and recreation (%)
Most Common Industries - Accommodation and food services (%)
Most Common Industries - Other services, except public administration (%)
Most Common Industries - Public administration (%)
Occupation diversity
Most Common Occupations - Management, business, science, and arts occupations (%)
Most Common Occupations - Management, business, and financial occupations (%)
Most Common Occupations - Management occupations (%)
Most Common Occupations - Business and financial operations occupations (%)
Most Common Occupations - Computer, engineering, and science occupations (%)
Most Common Occupations - Computer and mathematical occupations (%)
Most Common Occupations - Architecture and engineering occupations (%)
Most Common Occupations - Life, physical, and social science occupations (%)
Most Common Occupations - Education, legal, community service, arts, and media occupations (%)
Most Common Occupations - Community and social service occupations (%)
Most Common Occupations - Legal occupations (%)
Most Common Occupations - Education, training, and library occupations (%)
Most Common Occupations - Arts, design, entertainment, sports, and media occupations (%)
Most Common Occupations - Healthcare practitioners and technical occupations (%)
Most Common Occupations - Health diagnosing and treating practitioners and other technical occupations (%)
Most Common Occupations - Health technologists and technicians (%)
Most Common Occupations - Service occupations (%)
Most Common Occupations - Healthcare support occupations (%)
Most Common Occupations - Protective service occupations (%)
Most Common Occupations - Fire fighting and prevention, and other protective service workers including supervisors (%)
Most Common Occupations - Law enforcement workers including supervisors (%)
Most Common Occupations - Food preparation and serving related occupations (%)
Most Common Occupations - Building and grounds cleaning and maintenance occupations (%)
Most Common Occupations - Personal care and service occupations (%)
Most Common Occupations - Sales and office occupations (%)
Most Common Occupations - Sales and related occupations (%)
Most Common Occupations - Office and administrative support occupations (%)
Most Common Occupations - Natural resources, construction, and maintenance occupations (%)
Most Common Occupations - Farming, fishing, and forestry occupations (%)
Most Common Occupations - Construction and extraction occupations (%)
Most Common Occupations - Installation, maintenance, and repair occupations (%)
Most Common Occupations - Production, transportation, and material moving occupations (%)
Most Common Occupations - Production occupations (%)
Most Common Occupations - Transportation occupations (%)
Most Common Occupations - Material moving occupations (%)
People in Group quarters - Institutionalized population (%)
People in Group quarters - Correctional institutions (%)
People in Group quarters - Federal prisons and detention centers (%)
People in Group quarters - Halfway houses (%)
People in Group quarters - Local jails and other confinement facilities (including police lockups) (%)
People in Group quarters - Military disciplinary barracks (%)
People in Group quarters - State prisons (%)
People in Group quarters - Other types of correctional institutions (%)
People in Group quarters - Nursing homes (%)
People in Group quarters - Hospitals/wards, hospices, and schools for the handicapped (%)
People in Group quarters - Hospitals/wards and hospices for chronically ill (%)
People in Group quarters - Hospices or homes for chronically ill (%)
People in Group quarters - Military hospitals or wards for chronically ill (%)
People in Group quarters - Other hospitals or wards for chronically ill (%)
People in Group quarters - Hospitals or wards for drug/alcohol abuse (%)
People in Group quarters - Mental (Psychiatric) hospitals or wards (%)
People in Group quarters - Schools, hospitals, or wards for the mentally retarded (%)
People in Group quarters - Schools, hospitals, or wards for the physically handicapped (%)
People in Group quarters - Institutions for the deaf (%)
People in Group quarters - Institutions for the blind (%)
People in Group quarters - Orthopedic wards and institutions for the physically handicapped (%)
People in Group quarters - Wards in general hospitals for patients who have no usual home elsewhere (%)
People in Group quarters - Wards in military hospitals for patients who have no usual home elsewhere (%)
People in Group quarters - Juvenile institutions (%)
People in Group quarters - Long-term care (%)
People in Group quarters - Homes for abused, dependent, and neglected children (%)
People in Group quarters - Residential treatment centers for emotionally disturbed children (%)
People in Group quarters - Training schools for juvenile delinquents (%)
People in Group quarters - Short-term care, detention or diagnostic centers for delinquent children (%)
People in Group quarters - Type of juvenile institution unknown (%)
People in Group quarters - Noninstitutionalized population (%)
People in Group quarters - College dormitories (includes college quarters off campus) (%)
People in Group quarters - Military quarters (%)
People in Group quarters - On base (%)
People in Group quarters - Barracks, unaccompanied personnel housing (UPH), (Enlisted/Officer), ;and similar group living quarters for military personnel (%)
People in Group quarters - Transient quarters for temporary residents (%)
People in Group quarters - Military ships (%)
People in Group quarters - Group homes (%)
People in Group quarters - Homes or halfway houses for drug/alcohol abuse (%)
People in Group quarters - Homes for the mentally ill (%)
People in Group quarters - Homes for the mentally retarded (%)
People in Group quarters - Homes for the physically handicapped (%)
People in Group quarters - Other group homes (%)
People in Group quarters - Religious group quarters (%)
People in Group quarters - Dormitories (%)
People in Group quarters - Agriculture workers' dormitories on farms (%)
People in Group quarters - Job Corps and vocational training facilities (%)
People in Group quarters - Other workers' dormitories (%)
People in Group quarters - Crews of maritime vessels (%)
People in Group quarters - Other nonhousehold living situations (%)
People in Group quarters - Other noninstitutional group quarters (%)
Residents speaking English at home (%)
Residents speaking English at home - Born in the United States (%)
Residents speaking English at home - Native, born elsewhere (%)
Residents speaking English at home - Foreign born (%)
Residents speaking Spanish at home (%)
Residents speaking Spanish at home - Born in the United States (%)
Residents speaking Spanish at home - Native, born elsewhere (%)
Residents speaking Spanish at home - Foreign born (%)
Residents speaking other language at home (%)
Residents speaking other language at home - Born in the United States (%)
Residents speaking other language at home - Native, born elsewhere (%)
Residents speaking other language at home - Foreign born (%)
Class of Workers - Employee of private company (%)
Class of Workers - Self-employed in own incorporated business (%)
Class of Workers - Private not-for-profit wage and salary workers (%)
Class of Workers - Local government workers (%)
Class of Workers - State government workers (%)
Class of Workers - Federal government workers (%)
Class of Workers - Self-employed workers in own not incorporated business and Unpaid family workers (%)
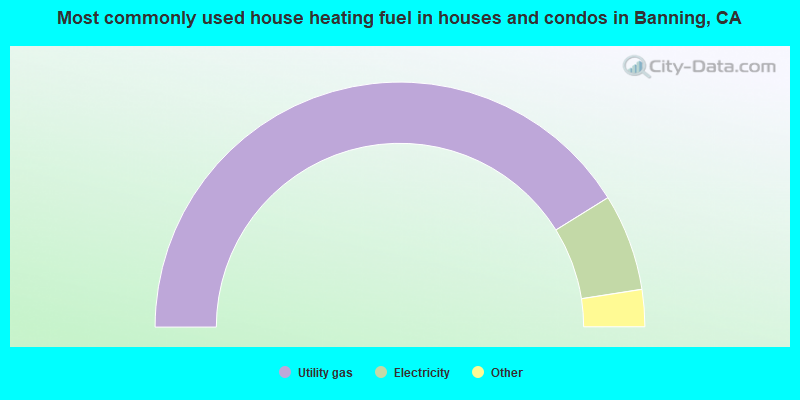
House heating fuel used in houses and condos - Utility gas (%)
House heating fuel used in houses and condos - Bottled, tank, or LP gas (%)
House heating fuel used in houses and condos - Electricity (%)
House heating fuel used in houses and condos - Fuel oil, kerosene, etc. (%)
House heating fuel used in houses and condos - Coal or coke (%)
House heating fuel used in houses and condos - Wood (%)
House heating fuel used in houses and condos - Solar energy (%)
House heating fuel used in houses and condos - Other fuel (%)
House heating fuel used in houses and condos - No fuel used (%)
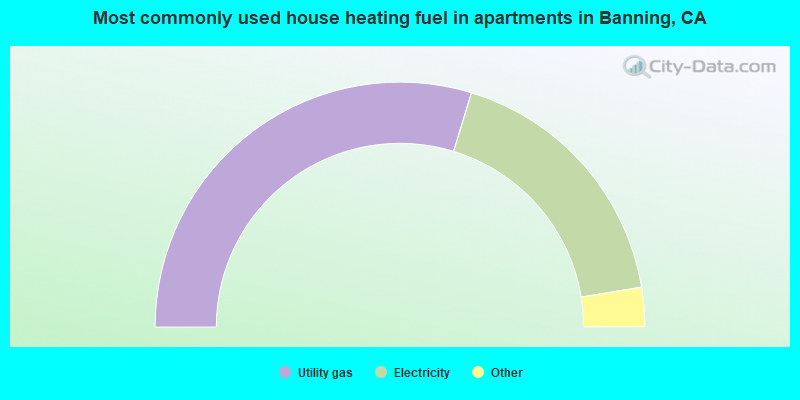
House heating fuel used in apartments - Utility gas (%)
House heating fuel used in apartments - Bottled, tank, or LP gas (%)
House heating fuel used in apartments - Electricity (%)
House heating fuel used in apartments - Fuel oil, kerosene, etc. (%)
House heating fuel used in apartments - Coal or coke (%)
House heating fuel used in apartments - Wood (%)
House heating fuel used in apartments - Solar energy (%)
House heating fuel used in apartments - Other fuel (%)
House heating fuel used in apartments - No fuel used (%)
Armed forces status - In Armed Forces (%)
Armed forces status - Civilian (%)
Armed forces status - Civilian - Veteran (%)
Armed forces status - Civilian - Nonveteran (%)
Fatal accidents locations in years 2005-2021
Fatal accidents locations in 2005
Fatal accidents locations in 2006
Fatal accidents locations in 2007
Fatal accidents locations in 2008
Fatal accidents locations in 2009
Fatal accidents locations in 2010
Fatal accidents locations in 2011
Fatal accidents locations in 2012
Fatal accidents locations in 2013
Fatal accidents locations in 2014
Fatal accidents locations in 2015
Fatal accidents locations in 2016
Fatal accidents locations in 2017
Fatal accidents locations in 2018
Fatal accidents locations in 2019
Fatal accidents locations in 2020
Fatal accidents locations in 2021
Alcohol use - People drinking some alcohol every month (%)
Alcohol use - People not drinking at all (%)
Alcohol use - Average days/month drinking alcohol
Alcohol use - Average drinks/week
Alcohol use - Average days/year people drink much
Audiometry - Average condition of hearing (%)
Audiometry - People that can hear a whisper from across a quiet room (%)
Audiometry - People that can hear normal voice from across a quiet room (%)
Audiometry - Ears ringing, roaring, buzzing (%)
Audiometry - Had a job exposure to loud noise (%)
Audiometry - Had off-work exposure to loud noise (%)
Blood Pressure & Cholesterol - Has high blood pressure (%)
Blood Pressure & Cholesterol - Checking blood pressure at home (%)
Blood Pressure & Cholesterol - Frequently checking blood cholesterol (%)
Blood Pressure & Cholesterol - Has high cholesterol level (%)
Consumer Behavior - Money monthly spent on food at supermarket/grocery store
Consumer Behavior - Money monthly spent on food at other stores
Consumer Behavior - Money monthly spent on eating out
Consumer Behavior - Money monthly spent on carryout/delivered foods
Consumer Behavior - Income spent on food at supermarket/grocery store (%)
Consumer Behavior - Income spent on food at other stores (%)
Consumer Behavior - Income spent on eating out (%)
Consumer Behavior - Income spent on carryout/delivered foods (%)
Current Health Status - General health condition (%)
Current Health Status - Blood donors (%)
Current Health Status - Has blood ever tested for HIV virus (%)
Current Health Status - Left-handed people (%)
Dermatology - People using sunscreen (%)
Diabetes - Diabetics (%)
Diabetes - Had a blood test for high blood sugar (%)
Diabetes - People taking insulin (%)
Diet Behavior & Nutrition - Diet health (%)
Diet Behavior & Nutrition - Milk product consumption (# of products/month)
Diet Behavior & Nutrition - Meals not home prepared (#/week)
Diet Behavior & Nutrition - Meals from fast food or pizza place (#/week)
Diet Behavior & Nutrition - Ready-to-eat foods (#/month)
Diet Behavior & Nutrition - Frozen meals/pizza (#/month)
Drug Use - People that ever used marijuana or hashish (%)
Drug Use - Ever used hard drugs (%)
Drug Use - Ever used any form of cocaine (%)
Drug Use - Ever used heroin (%)
Drug Use - Ever used methamphetamine (%)
Health Insurance - People covered by health insurance (%)
Kidney Conditions-Urology - Avg. # of times urinating at night
Medical Conditions - People with asthma (%)
Medical Conditions - People with anemia (%)
Medical Conditions - People with psoriasis (%)
Medical Conditions - People with overweight (%)
Medical Conditions - Elderly people having difficulties in thinking or remembering (%)
Medical Conditions - People who ever received blood transfusion (%)
Medical Conditions - People having trouble seeing even with glass/contacts (%)
Medical Conditions - People with arthritis (%)
Medical Conditions - People with gout (%)
Medical Conditions - People with congestive heart failure (%)
Medical Conditions - People with coronary heart disease (%)
Medical Conditions - People with angina pectoris (%)
Medical Conditions - People who ever had heart attack (%)
Medical Conditions - People who ever had stroke (%)
Medical Conditions - People with emphysema (%)
Medical Conditions - People with thyroid problem (%)
Medical Conditions - People with chronic bronchitis (%)
Medical Conditions - People with any liver condition (%)
Medical Conditions - People who ever had cancer or malignancy (%)
Mental Health - People who have little interest in doing things (%)
Mental Health - People feeling down, depressed, or hopeless (%)
Mental Health - People who have trouble sleeping or sleeping too much (%)
Mental Health - People feeling tired or having little energy (%)
Mental Health - People with poor appetite or overeating (%)
Mental Health - People feeling bad about themself (%)
Mental Health - People who have trouble concentrating on things (%)
Mental Health - People moving or speaking slowly or too fast (%)
Mental Health - People having thoughts they would be better off dead (%)
Oral Health - Average years since last visit a dentist
Oral Health - People embarrassed because of mouth (%)
Oral Health - People with gum disease (%)
Oral Health - General health of teeth and gums (%)
Oral Health - Average days a week using dental floss/device
Oral Health - Average days a week using mouthwash for dental problem
Oral Health - Average number of teeth
Pesticide Use - Households using pesticides to control insects (%)
Pesticide Use - Households using pesticides to kill weeds (%)
Physical Activity - People doing vigorous-intensity work activities (%)
Physical Activity - People doing moderate-intensity work activities (%)
Physical Activity - People walking or bicycling (%)
Physical Activity - People doing vigorous-intensity recreational activities (%)
Physical Activity - People doing moderate-intensity recreational activities (%)
Physical Activity - Average hours a day doing sedentary activities
Physical Activity - Average hours a day watching TV or videos
Physical Activity - Average hours a day using computer
Physical Functioning - People having limitations keeping them from working (%)
Physical Functioning - People limited in amount of work they can do (%)
Physical Functioning - People that need special equipment to walk (%)
Physical Functioning - People experiencing confusion/memory problems (%)
Physical Functioning - People requiring special healthcare equipment (%)
Prescription Medications - Average number of prescription medicines taking
Preventive Aspirin Use - Adults 40+ taking low-dose aspirin (%)
Reproductive Health - Vaginal deliveries (%)
Reproductive Health - Cesarean deliveries (%)
Reproductive Health - Deliveries resulted in a live birth (%)
Reproductive Health - Pregnancies resulted in a delivery (%)
Reproductive Health - Women breastfeeding newborns (%)
Reproductive Health - Women that had a hysterectomy (%)
Reproductive Health - Women that had both ovaries removed (%)
Reproductive Health - Women that have ever taken birth control pills (%)
Reproductive Health - Women taking birth control pills (%)
Reproductive Health - Women that have ever used Depo-Provera or injectables (%)
Reproductive Health - Women that have ever used female hormones (%)
Sexual Behavior - People 18+ that ever had sex (vaginal, anal, or oral) (%)
Sexual Behavior - Males 18+ that ever had vaginal sex with a woman (%)
Sexual Behavior - Males 18+ that ever performed oral sex on a woman (%)
Sexual Behavior - Males 18+ that ever had anal sex with a woman (%)
Sexual Behavior - Males 18+ that ever had any sex with a man (%)
Sexual Behavior - Females 18+ that ever had vaginal sex with a man (%)
Sexual Behavior - Females 18+ that ever performed oral sex on a man (%)
Sexual Behavior - Females 18+ that ever had anal sex with a man (%)
Sexual Behavior - Females 18+ that ever had any kind of sex with a woman (%)
Sexual Behavior - Average age people first had sex
Sexual Behavior - Average number of female sex partners in lifetime (males 18+)
Sexual Behavior - Average number of female vaginal sex partners in lifetime (males 18+)
Sexual Behavior - Average age people first performed oral sex on a woman (18+)
Sexual Behavior - Average number of woman performed oral sex on in lifetime (18+)
Sexual Behavior - Average number of male sex partners in lifetime (males 18+)
Sexual Behavior - Average number of male anal sex partners in lifetime (males 18+)
Sexual Behavior - Average age people first performed oral sex on a man (18+)
Sexual Behavior - Average number of male oral sex partners in lifetime (18+)
Sexual Behavior - People using protection when performing oral sex (%)
Sexual Behavior - Average number of times people have vaginal or anal sex a year
Sexual Behavior - People having sex without condom (%)
Sexual Behavior - Average number of male sex partners in lifetime (females 18+)
Sexual Behavior - Average number of male vaginal sex partners in lifetime (females 18+)
Sexual Behavior - Average number of female sex partners in lifetime (females 18+)
Sexual Behavior - Circumcised males 18+ (%)
Sleep Disorders - Average hours sleeping at night
Sleep Disorders - People that has trouble sleeping (%)
Smoking-Cigarette Use - People smoking cigarettes (%)
Taste & Smell - People 40+ having problems with smell (%)
Taste & Smell - People 40+ having problems with taste (%)
Taste & Smell - People 40+ that ever had wisdom teeth removed (%)
Taste & Smell - People 40+ that ever had tonsils teeth removed (%)
Taste & Smell - People 40+ that ever had a loss of consciousness because of a head injury (%)
Taste & Smell - People 40+ that ever had a broken nose or other serious injury to face or skull (%)
Taste & Smell - People 40+ that ever had two or more sinus infections (%)
Weight - Average height (inches)
Weight - Average weight (pounds)
Weight - Average BMI
Weight - People that are obese (%)
Weight - People that ever were obese (%)
Weight - People trying to lose weight (%)
15,351 50.4% Hispanic 9,958 32.7% White alone 2,161 7.1% Black alone 1,666 5.5% Asian alone 926 3.0% Two or more races 162 0.5% American Indian alone 77 0.3% Other race alone
Officers per 1,000 residents here:
1.05California average:
2.30
Latest news from Banning, CA collected exclusively by city-data.com from local newspapers, TV, and radio stations
Ancestries: English (7.1%), German (4.2%), American (2.5%), Italian (2.3%), Irish (2.2%), European (2.0%).
Current Local Time:
Land area: 23.1 square miles.
Population density: 1,331 people per square mile (low).
5,703 residents are foreign born (11.9% Latin America , 3.4% Asia , 2.7% Europe ).
This city:
18.7%California:
26.5%
Median real estate property taxes paid for housing units with mortgages in 2022: $2,724 (0.7%)Median real estate property taxes paid for housing units with no mortgage in 2022: $2,575 (0.7%)
Nearest city with pop. 50,000+: San Gorgonio Pass, CA
Nearest city with pop. 200,000+: Riverside, CA
Nearest city with pop. 1,000,000+: San Diego, CA
Nearest cities:
Latitude: 33.93 N, Longitude: 116.90 W
Daytime population change due to commuting: -2,734 (-9.0%)Workers who live and work in this city: 2,845 (25.8%)
Single-family new house construction building permits:
2022: 153 buildings , average cost: $136,3002021: 212 buildings , average cost: $159,8002020: 476 buildings , average cost: $298,8002019: 11 buildings , average cost: $202,7002018: 1 building , cost: $300,0002017: 2 buildings , average cost: $195,0002013: 1 building , cost: $144,4002009: 1 building , cost: $209,5002008: 1 building , cost: $209,5002007: 14 buildings , average cost: $192,4002006: 57 buildings , average cost: $161,2002005: 78 buildings , average cost: $121,1002004: 310 buildings , average cost: $119,3002003: 548 buildings , average cost: $115,8002002: 388 buildings , average cost: $132,0002001: 319 buildings , average cost: $120,0002000: 156 buildings , average cost: $135,8001999: 147 buildings , average cost: $129,4001998: 138 buildings , average cost: $120,2001997: 158 buildings , average cost: $111,100Unemployment in December 2023:
Population change in the 1990s: +2,437 (+11.5%).
Most common industries in Banning, CA (%)
Both Males Females
Construction (8.6%)
Educational services (7.7%)
Health care (7.2%)
Accommodation & food services (6.4%)
Arts, entertainment, recreation (6.1%)
Clothing & accessories, including shoe, stores (4.5%)
Public administration (4.5%)
Construction (15.3%)
Arts, entertainment, recreation (6.7%)
Accommodation & food services (6.0%)
Educational services (4.9%)
Repair & maintenance (4.4%)
Public administration (4.3%)
Administrative & support & waste management services (4.0%)
Health care (12.4%)
Educational services (10.8%)
Accommodation & food services (6.8%)
Clothing & accessories, including shoe, stores (6.1%)
Social assistance (5.6%)
Arts, entertainment, recreation (5.5%)
Professional, scientific, technical services (5.1%)
Most common occupations in Banning, CA (%)
Both Males Females
Other sales and related occupations, including supervisors (6.9%)
Retail sales workers, except cashiers (5.4%)
Cashiers (5.1%)
Building and grounds cleaning and maintenance occupations (4.6%)
Material recording, scheduling, dispatching, and distributing workers (3.9%)
Other production occupations, including supervisors (3.8%)
Driver/sales workers and truck drivers (3.6%)
Building and grounds cleaning and maintenance occupations (6.9%)
Driver/sales workers and truck drivers (6.8%)
Other sales and related occupations, including supervisors (6.8%)
Retail sales workers, except cashiers (5.1%)
Other production occupations, including supervisors (4.8%)
Metal workers and plastic workers (4.3%)
Construction traders workers except carpenters, electricians, painters, plumbers, and construction laborers (4.2%)
Cashiers (8.4%)
Other sales and related occupations, including supervisors (7.1%)
Retail sales workers, except cashiers (5.7%)
Other office and administrative support workers, including supervisors (5.1%)
Material recording, scheduling, dispatching, and distributing workers (4.4%)
Secretaries and administrative assistants (3.9%)
Information and record clerks, except customer service representatives (3.8%)
Earthquake activity:
Banning-area historical earthquake activity is significantly above California state average. It is 7211% greater than the overall U.S. average. On 6/28/1992 at 11:57:34, a magnitude 7.6 (6.2 MB, 7.6 MS, 7.3 MW, Depth: 0.7 mi, Class: Major, Intensity: VIII - XII) earthquake occurred 27.3 miles away from Banning center, causing 3 deaths ( 1 shaking deaths, 2 other deaths) and 400 injuries, causing $100,000,000 total damage and $40,000,000 insured lossesOn 10/16/1999 at 09:46:44, a magnitude 7.4 (6.3 MB, 7.4 MS, 7.2 MW, 7.3 ML) earthquake occurred 48.2 miles away from Banning center On 7/21/1952 at 11:52:14, a magnitude 7.7 (7.7 UK) earthquake occurred 140.8 miles away from Banning center, causing $50,000,000 total damage On 5/19/1940 at 04:36:40, a magnitude 7.2 (7.2 UK) earthquake occurred 84.8 miles away from the city center, causing $33,000,000 total damage On 6/28/1992 at 15:05:30, a magnitude 6.9 (6.3 MB, 6.7 MS, 6.5 MW, 6.9 ME, Depth: 3.1 mi, Class: Strong, Intensity: VII - IX) earthquake occurred 25.1 miles away from Banning center On 4/21/1918 at 22:32:30, a magnitude 6.8 (6.8 UK) earthquake occurred 32.2 miles away from the city center Magnitude types: body-wave magnitude (MB), energy magnitude (ME), local magnitude (ML), surface-wave magnitude (MS), moment magnitude (MW) Natural disasters: The number of natural disasters in Riverside County (46) is a lot greater than the US average (15).Major Disasters (Presidential) Declared: 27Emergencies Declared: 1Fires: 22, Floods: 20, Storms: 8, Winter Storms: 8, Landslides: 6, Mudslides: 5, Heavy Rains: 2, Earthquake: 1, Flash Flood: 1, Freeze: 1, Hurricane: 1, Tornado: 1, Tropical Storm: 1, Other: 1 (Note: some incidents may be assigned to more than one category). Hospitals and medical centers in Banning: INDEPENDENT OPTIONS INC/RED BLUFF HOUSE (3648 RED BLUFF LANE) SAN GORGONIO MEMORIAL HOSPITAL (Government - Hospital District or Authority, 600 NORTH HIGHLAND SPRINGS AVENUE) VISITING NURSE ASSN OF THE INLAND COUNTY-BRANCH (264 HIGHLAND SPRINGS AVE, BLDG 4 STE D) BANNING HEALTHCARE (3476 W. WILSON ST.)
CHERRY VALLEY HEALTHCARE (5800 WEST WILSON STREET)
BANNING DIALYSIS (6090 W. RAMSEY STREET)
Amtrak stations near Banning: 5 miles: BEAUMONT (550 BEAUMONT AVE.) - Bus Station Services: fully wheelchair accessible, public restrooms, full-service food facilities, free short-term parking.
15 miles: HEMET (COCOS REST., 3246 FLORIDA AVE.) - Bus Station Colleges/universities with over 2000 students nearest to Banning:
Mt San Jacinto Community College District (about 10 miles; San Jacinto, CA ; Full-time enrollment: 8,426)
Crafton Hills College (about 14 miles; Yucaipa, CA ; FT enrollment: 3,222)
University of Redlands (about 18 miles; Redlands, CA ; FT enrollment: 4,854)
Moreno Valley College (about 18 miles; Moreno Valley, CA ; FT enrollment: 4,650)
Loma Linda University (about 23 miles; Loma Linda, CA ; FT enrollment: 2,839)
The Art Institute of California-Argosy University Inland Empire (about 24 miles; San Bernardino, CA ; FT enrollment: 2,238)
University of California-Riverside (about 26 miles; Riverside, CA ; FT enrollment: 20,647)
Public high schools in Banning:
Private high school in Banning: CALVARY CHRISTIAN SCHOOL Students: 182, Location: 1325 MOUNTAIN AVE, Grades: PK-12)
Public elementary/middle schools in Banning:
Private elementary/middle school in Banning: MORONGO SCHOOL Students: 135, Location: 1213 SANITAGO RD, Grades: PK-8)
See full list of schools located in Banning Library in Banning: BANNING LIBRARY DISTRICT Operating income: $736,320; Location: 21 W. NICOLET ST.; 50,620 books ; 2,878 audio materials ; 3,040 video materials ; 1 local licensed databases ; 127 print serial subscriptions )
Notable locations in Banning: (A) , Sun Lakes Country Club and Golf Course (B) , Pine Powerhouse (C) , American Medical Response Banning (D) , Banning Public Library (E) , Riverside County Fire Department Station 89 Banning (F) . Display/hide their locations on the map
Shopping Centers: (1) , Beaumont Shopping Center (2) . Display/hide their locations on the map
Churches in Banning include: (A) , Banning Foursquare Church (B) , Banning United Methodist Church (C) , Calvary Chapel of the Pass (D) , Canaan Spanish Assembly of God Church (E) , Church of Christ (F) , Church of the Nazarene (G) , First Assembly of God Church (H) , First Christian Church (I) . Display/hide their locations on the map
Cemetery: (1) . Display/hide its location on the map
Creeks: (A) , Potrero Creek (B) . Display/hide their locations on the map
Parks in Banning include: (1) , Sylvan Park (2) , Gilman Ranch Historic Park (3) , Pass Valley Park (4) . Display/hide their locations on the map
Hotels: (1) , Country Inn (932 E Ramsey Street) (2) . Display/hide their approximate locations on the map
Birthplace of: John Moffet (swimmer) - Swimmer, Derek Brown (running back) - Football player.
Riverside County has a predicted average indoor radon screening level between 2 and 4 pCi/L (pico curies per liter) - Moderate Potential Drinking water stations with addresses in Banning and their reported violations in the past:
BANNING, CITY OF (Population served: 29,965, Groundwater):
Past monitoring violations:
Monitoring and Reporting (DBP) - Between OCT-2005 and DEC-2005, Contaminant: TTHM. Follow-up actions: St Violation/Reminder Notice (MAR-09-2006)
One routine major monitoring violation
Population served: 500, Surface water):
Past monitoring violations:
Initial Tap Sampling for Pb and Cu - In JUL-01-1993, Contaminant: Lead and Copper Rule. Follow-up actions: Fed Compliance achieved (SEP-30-2005)
Average household size: This city:
2.6 peopleCalifornia:
2.9 people
Percentage of family households: This city:
66.3%Whole state:
68.7%
Percentage of households with unmarried partners: This city:
7.2%Whole state:
7.2%
Likely homosexual households (counted as self-reported same-sex unmarried-partner households)
Lesbian couples: 0.4% of all households Gay men: 0.3% of all households
People in group quarters in Banning in 2010:
879 people in local jails and other municipal confinement facilities
177 people in nursing facilities/skilled-nursing facilities
158 people in other noninstitutional facilities
59 people in group homes intended for adults
32 people in workers' group living quarters and job corps centers
29 people in correctional residential facilities
22 people in group homes for juveniles (non-correctional)
5 people in residential treatment centers for adults
4 people in residential treatment centers for juveniles (non-correctional)
People in group quarters in Banning in 2000:
172 people in nursing homes
87 people in other noninstitutional group quarters
40 people in other group homes
13 people in homes for the mentally retarded
13 people in job corps and vocational training facilities
7 people in homes or halfway houses for drug/alcohol abuse
6 people in homes for abused, dependent, and neglected children
Banks with branches in Banning (2011 data):
Wells Fargo Bank, National Association: Albertsons Banning Branch at 300 South Highland Springs Avenue, branch established on 1997/04/21; Banning Branch at 1735 West Ramsey Street, branch established on 1982/05/26. Info updated 2011/04/05: Bank assets: $1,161,490.0 mil, Deposits: $905,653.0 mil, headquarters in Sioux Falls, SD, positive income , 6395 total offices , Holding Company: Wells Fargo & Company
U.S. Bank National Association: Highland Springs Avenue Albertsons B at 300 South Highland Springs, branch established on 2008/06/23; Banning Branch at 300 South Highland Springs Avenue, branch established on 1998/02/04. Info updated 2012/01/30: Bank assets: $330,470.8 mil, Deposits: $236,091.5 mil, headquarters in Cincinnati, OH, positive income , 3121 total offices , Holding Company: U.S. Bancorp
JPMorgan Chase Bank, National Association: 1118 W Ramsey St Branch at 1118 W Ramsey St, branch established on 1988/12/27. Info updated 2011/11/10: Bank assets: $1,811,678.0 mil, Deposits: $1,190,738.0 mil, headquarters in Columbus, OH, positive income , International Specialization, 5577 total offices , Holding Company: Jpmorgan Chase & Co.
Bank of America, National Association: Banning Branch at 1374 West Ramsey Street, branch established on 1960/02/19. Info updated 2009/11/18: Bank assets: $1,451,969.3 mil, Deposits: $1,077,176.8 mil, headquarters in Charlotte, NC, positive income , 5782 total offices , Holding Company: Bank Of America Corporation
Citibank, National Association: 3170 West Ramsey Street Branch at 3170 West Ramsey Street, branch established on 1890/01/01. Info updated 2012/01/10: Bank assets: $1,288,658.0 mil, Deposits: $882,541.0 mil, headquarters in Sioux Falls, SD, positive income , International Specialization, 1048 total offices , Holding Company: Citigroup Inc.
For population 15 years and over in Banning:
Never married: 30.6%Now married: 45.6%Separated: 1.8%Widowed: 10.4%Divorced: 11.6% For population 25 years and over in Banning:
High school or higher: 82.7%Bachelor's degree or higher: 16.8%Graduate or professional degree: 6.4%Unemployed: 9.0%Mean travel time to work (commute): 25.2 minutes
Education Gini index (Inequality in education) Here:
13.8California average:
15.5
Religion statistics for Banning, CA (based on Riverside County data)
Religion Adherents Congregations Catholic 602,765 51 Evangelical Protestant 240,306 741 Other 77,581 194 Mainline Protestant 29,535 103 Black Protestant 19,170 40 Orthodox 3,647 11 None 1,216,637 -
Source: Clifford Grammich, Kirk Hadaway, Richard Houseal, Dale E.Jones, Alexei Krindatch, Richie Stanley and Richard H.Taylor. 2012. 2010 U.S.Religion Census: Religious Congregations & Membership Study. Association of Statisticians of American Religious Bodies. Jones, Dale E., et al. 2002. Congregations and Membership in the United States 2000. Nashville, TN: Glenmary Research Center. Graphs represent county-level data
Food Environment Statistics: Number of grocery stores : 330Riverside County :
1.60 / 10,000 pop.California :
2.14 / 10,000 pop.
Number of supercenters and club stores : 11Here :
0.05 / 10,000 pop.California :
0.04 / 10,000 pop.
Number of convenience stores (no gas) : 91This county :
0.44 / 10,000 pop.California :
0.62 / 10,000 pop.
Number of convenience stores (with gas) : 311Here :
1.51 / 10,000 pop.California :
1.49 / 10,000 pop.
Number of full-service restaurants : 1,125Riverside County :
5.45 / 10,000 pop.State :
7.42 / 10,000 pop.
Adult diabetes rate : Riverside County :
7.7%California :
7.3%
Adult obesity rate : Riverside County :
24.5%State :
21.3%
Low-income preschool obesity rate : Health and Nutrition: Healthy diet rate : Banning:
50.3%California:
49.4%
Average overall health of teeth and gums : Here:
47.1%California:
48.0%
Average BMI : Banning:
28.5California:
28.1
People feeling badly about themselves : Here:
20.7%California:
20.2%
People not drinking alcohol at all : Here:
13.0%California:
11.2%
Average hours sleeping at night : Overweight people : Banning:
34.1%California:
31.5%
General health condition : Here:
53.3%California:
56.4%
Average condition of hearing : Here:
76.3%California:
80.9%
More about Health and Nutrition of Banning, CA Residents
Local government employment and payroll (March 2022)
Function
Full-time employees
Monthly full-time payroll
Average yearly full-time wage
Part-time employees
Monthly part-time payroll
Police Protection - Officers
32 $458,486 $171,932 0 $0 Electric Power
27 $322,562 $143,361 0 $0 Other and Unallocable
23 $167,107 $87,186 0 $0 Water Supply
17 $173,873 $122,734 0 $0 Financial Administration
15 $143,175 $114,540 1 $4,543 Police - Other
13 $103,344 $95,394 1 $1,486 Transit
9 $60,388 $80,517 2 $5,640 Other Government Administration
8 $87,737 $131,606 8 $3,301 Parks and Recreation
7 $56,243 $96,417 8 $19,254 Streets and Highways
6 $61,504 $123,008 1 $2,941 Solid Waste Management
4 $29,766 $89,298 0 $0 Housing and Community Development (Local)
3 $30,662 $122,648 0 $0 Sewerage
2 $15,217 $91,302 0 $0 Airports
0 $0 1 $2,007
Totals for Government
166 $1,710,063 $123,619 22 $39,171
Banning government finances - Expenditure in 2017 (per resident):
Construction - Housing and Community Development: $3,959,000 ($129.03)
Regular Highways: $2,863,000 ($93.31)Electric Utilities: $1,245,000 ($40.58)Police Protection: $244,000 ($7.95)Sewerage: $208,000 ($6.78)Transit Utilities: $192,000 ($6.26)Current Operations - Electric Utilities: $27,740,000 ($904.08)
Police Protection: $7,268,000 ($236.87)Water Utilities: $5,529,000 ($180.20)Solid Waste Management: $3,345,000 ($109.02)Transit Utilities: $2,976,000 ($96.99)Central Staff Services: $2,951,000 ($96.18)Local Fire Protection: $2,650,000 ($86.37)Sewerage: $2,060,000 ($67.14)Parks and Recreation: $1,115,000 ($36.34)Regular Highways: $918,000 ($29.92)Protective Inspection and Regulation - Other: $833,000 ($27.15)Financial Administration: $229,000 ($7.46)Health - Other: $137,000 ($4.47)Air Transportation: $133,000 ($4.33)Housing and Community Development: $7,000 ($0.23)Electric Utilities - Interest on Debt: $1,392,000 ($45.37)
General - Interest on Debt: $356,000 ($11.60)
Other Capital Outlay - Water Utilities: $3,060,000 ($99.73)
Electric Utilities: $2,614,000 ($85.19)Sewerage: $393,000 ($12.81)Protective Inspection and Regulation - Other: $38,000 ($1.24)Air Transportation: $24,000 ($0.78)Total Salaries and Wages: $2,827,000 ($92.14)
Water Utilities - Interest on Debt: $1,016,000 ($33.11)
Banning government finances - Revenue in 2017 (per resident):
Charges - Other: $4,197,000 ($136.79)
Sewerage: $3,611,000 ($117.69)Solid Waste Management: $3,486,000 ($113.61)Air Transportation: $163,000 ($5.31)Parks and Recreation: $104,000 ($3.39)Federal Intergovernmental - Other: $183,000 ($5.96)
Transit Utilities: $28,000 ($0.91)Housing and Community Development: $3,000 ($0.10)Local Intergovernmental - Transit Utilities: $1,392,000 ($45.37)
Water Utilities: $213,000 ($6.94)Other: $39,000 ($1.27)Miscellaneous - General Revenue - Other: $537,000 ($17.50)
Rents: $469,000 ($15.29)Interest Earnings: $449,000 ($14.63)Donations From Private Sources: $9,000 ($0.29)Sale of Property: $2,000 ($0.07)Revenue - Electric Utilities: $34,318,000 ($1118.47)
Water Utilities: $9,801,000 ($319.43)Transit Utilities: $264,000 ($8.60)State Intergovernmental - Transit Utilities: $2,308,000 ($75.22)
Other: $2,014,000 ($65.64)Highways: $605,000 ($19.72)General Local Government Support: $27,000 ($0.88)Tax - Property: $4,732,000 ($154.22)
General Sales and Gross Receipts: $3,522,000 ($114.79)Public Utilities Sales: $917,000 ($29.89)Other Selective Sales: $857,000 ($27.93)Other License: $376,000 ($12.25)Occupation and Business License - Other: $174,000 ($5.67)Documentary and Stock Transfer: $84,000 ($2.74)Other: $75,000 ($2.44)
Banning government finances - Debt in 2017 (per resident):
Long Term Debt - Beginning Outstanding - Unspecified Public Purpose: $65,513,000 ($2135.16)
Outstanding Unspecified Public Purpose: $63,205,000 ($2059.94)Retired Unspecified Public Purpose: $2,542,000 ($82.85)Issue, Unspecified Public Purpose: $233,000 ($7.59)
Banning government finances - Cash and Securities in 2017 (per resident):
Bond Funds - Cash and Securities: $12,086,000 ($393.90)
Other Funds - Cash and Securities: $90,354,000 ($2944.76)
7.19% of this county's 2021 resident taxpayers lived in other counties in 2020 ($71,521 average adjusted gross income )
Here:
7.19%California average:
5.19%
0.03% of residents moved from foreign countries ($210 average AGI )Riverside County:
0.03%California average:
0.03%
Top counties from which taxpayers relocated into this county between 2020 and 2021:
6.28% of this county's 2020 resident taxpayers moved to other counties in 2021 ($64,593 average adjusted gross income )
Here:
6.28%California average:
6.14%
0.02% of residents moved to foreign countries ($200 average AGI )Riverside County:
0.02%California average:
0.02%
Top counties to which taxpayers relocated from this county between 2020 and 2021:
Businesses in Banning, CA
Name Count Name Count
Albertsons 1 Jack In The Box 2 AutoZone 1 KFC 1 Carl\s Jr. 2 Kmart 1 Chevrolet 1 McDonald's 1 Church's Chicken 1 Payless 1 Curves 1 Penske 1 Days Inn 1 Pizza Hut 1 Dennys 1 Rite Aid 2 Domino's Pizza 1 Sears 1 FedEx 3 Starbucks 2 GNC 1 Subway 2 H&R Block 1 Super 8 1 Hilton 1 Travelodge 1 Holiday Inn 1 U-Haul 2 IHOP 1 UPS 1
Strongest AM radio stations in Banning:
KMET (1490 AM; 1 kW; BANNING, CA; Owner: SUNSET BROADCASTING, INC.)
KPLS (830 AM; 50 kW; ORANGE, CA; Owner: CRN LICENSES, LLC)
KHPY (1670 AM; 10 kW; MORENO VALLEY, CA; Owner: DELBERT L. VAN VOORHIS)
KLAC (570 AM; 50 kW; LOS ANGELES, CA; Owner: AMFM RADIO LICENSES, L.L.C.)
KFI (640 AM; 50 kW; LOS ANGELES, CA; Owner: CAPSTAR TX LIMITED PARTNERSHIP)
KNWQ (1140 AM; 10 kW; PALM SPRINGS, CA; Owner: MCC RADIO, LLC)
KTNQ (1020 AM; 50 kW; LOS ANGELES, CA; Owner: KTNQ-AM LICENSE CORP.)
KXTA (1150 AM; 50 kW; LOS ANGELES, CA; Owner: CITICASTERS LICENSES, L.P.)
KFMB (760 AM; 50 kW; SAN DIEGO, CA; Owner: MIDWEST TELEVISION, INC.)
KDIS (1110 AM; 50 kW; PASADENA, CA; Owner: ABC,INC.)
KPSI (920 AM; 5 kW; PALM SPRINGS, CA; Owner: R & R RADIO CORPORATION)
KCAL (1410 AM; 5 kW; REDLANDS, CA; Owner: LAZER BROADCASTING CORPORATION)
KFWB (980 AM; 50 kW; LOS ANGELES, CA; Owner: INFINITY BROADCASTING OPERATIONS, INC.)
Strongest FM radio stations in Banning:
KLRD (90.1 FM; YUCAIPA, CA; Owner: EDUCATIONAL MEDIA FOUNDATION)
K201AR (88.1 FM; BANNING, CA; Owner: KSGN, INC.)
K232CX (94.3 FM; DESERT HOT SPRINGS, CA; Owner: MCC RADIO, LLC)
KWRP (96.1 FM; SAN JACINTO, CA; Owner: MAGIC BROADCASTING, INC.)
KPLM-FM2 (106.1 FM; SAN JACINTO, CA; Owner: RM BROADCASTING L.L.C.)
KAEH (100.9 FM; BEAUMONT, CA; Owner: MOON BROADCASTING RIVERSIDE, LLC)
KUOR-FM (89.1 FM; REDLANDS, CA; Owner: UNIVERSITY OF REDLANDS)
KATY-FM (101.3 FM; IDYLLWILD, CA; Owner: ALL PRO BROADCASTING, INC.)
KCXX (103.9 FM; LAKE ARROWHEAD, CA; Owner: ALL-PRO BROADCASTING, INC.)
KRTM (88.9 FM; TEMECULA, CA; Owner: PENFOLD COMMUNICATIONS, INC.)
KXSB (101.7 FM; BIG BEAR LAKE, CA; Owner: LAZER BROADCASTING CORPORATION)
KOLA (99.9 FM; SAN BERNARDINO, CA; Owner: INLAND EMPIRE BROADCASTING CORP.)
KVCR (91.9 FM; SAN BERNARDINO, CA; Owner: SAN BERNARDINO COMMUNITY COLLEGE DISTRICT)
KUCR (88.3 FM; RIVERSIDE, CA; Owner: THE REGENTS OF THE UNIV. OF CA)
KGGI (99.1 FM; RIVERSIDE, CA; Owner: AMFM RADIO LICENSES, L.L.C.)
KLYY (97.5 FM; RIVERSIDE, CA; Owner: ENTRAVISION HOLDINGS, LLC)
K201CD (88.1 FM; VICTORVILLE, CA; Owner: SAN BERNARDINO COMMNTY COLLEGE DIST.)
KXRS (105.7 FM; HEMET, CA; Owner: LAZER BROADCASTING CORPORATION)
K295AI (106.9 FM; MUSCOY, CA; Owner: ASSOCIATION FOR COMMUNITY EDUCATION, INC.)
KWVE (107.9 FM; SAN CLEMENTE, CA; Owner: CALVARY CHAPEL OF COSTA MESA)
TV broadcast stations around Banning:
KTRO-LP (Channel 50; LANCASTER, CA; Owner: ROBERT D. ADELMAN)
KHIZ (Channel 64; BARSTOW, CA; Owner: SUNBELT TELEVISION, INC.)
KESQ-TV (Channel 42; PALM SPRINGS, CA; Owner: GULF-CALIFORNIA BROADCAST COMPANY)
K27DS (Channel 27; YUCCA VALLEY, CA; Owner: GULF- CALIFORNIA BROADCAST COMPANY)
National Bridge Inventory (NBI) Statistics 26 Number of bridges138ft / 41.6m Total length $1,229,000 Total costs1,013,892 Total average daily traffic152,196 Total average daily truck traffic
New bridges - historical statistics
1 1920-1929 3 1930-1939 1 1940-1949 7 1950-1959 7 1960-1969 3 1970-1979 2 1980-1989 2 1990-1999
See full National Bridge Inventory statistics for Banning, CA
Home Mortgage Disclosure Act Aggregated Statistics For Year 2009(Based on 3 full and 4 partial tracts) A) FHA, FSA/RHS & VA B) Conventional C) Refinancings D) Home Improvement Loans E) Loans on Dwellings For 5+ Families F) Non-occupant Loans on G) Loans On Manufactured Number Average Value Number Average Value Number Average Value Number Average Value Number Average Value Number Average Value Number Average Value
LOANS ORIGINATED 146 $132,224 53 $95,015 86 $150,610 9 $57,187 3 $534,333 31 $77,765 8 $109,748 APPLICATIONS APPROVED, NOT ACCEPTED 10 $174,002 10 $86,613 19 $161,014 6 $16,178 0 $0 5 $82,530 4 $105,065 APPLICATIONS DENIED 31 $115,212 25 $95,634 96 $151,624 16 $60,914 0 $0 16 $86,555 7 $90,111 APPLICATIONS WITHDRAWN 16 $129,959 15 $113,748 45 $155,745 7 $75,249 0 $0 8 $84,614 2 $125,100 FILES CLOSED FOR INCOMPLETENESS 4 $149,255 1 $84,280 10 $157,250 2 $42,110 0 $0 2 $47,805 0 $0
Aggregated Statistics For Year 2008(Based on 3 full and 4 partial tracts) A) FHA, FSA/RHS & VA B) Conventional C) Refinancings D) Home Improvement Loans E) Loans on Dwellings For 5+ Families F) Non-occupant Loans on G) Loans On Manufactured Number Average Value Number Average Value Number Average Value Number Average Value Number Average Value Number Average Value Number Average Value
LOANS ORIGINATED 112 $166,520 93 $132,857 105 $161,300 33 $78,449 0 $0 56 $103,338 13 $88,893 APPLICATIONS APPROVED, NOT ACCEPTED 10 $150,678 29 $142,406 40 $178,119 5 $77,938 0 $0 7 $126,061 11 $67,800 APPLICATIONS DENIED 26 $160,784 58 $135,823 240 $205,548 72 $66,918 7 $580,143 55 $166,377 9 $78,906 APPLICATIONS WITHDRAWN 24 $167,209 19 $148,378 61 $220,109 7 $135,116 1 $520,000 20 $123,280 2 $136,555 FILES CLOSED FOR INCOMPLETENESS 4 $131,460 12 $180,502 22 $233,947 2 $229,300 0 $0 9 $151,147 0 $0
Aggregated Statistics For Year 2007(Based on 3 full and 4 partial tracts) A) FHA, FSA/RHS & VA B) Conventional C) Refinancings D) Home Improvement Loans E) Loans on Dwellings For 5+ Families F) Non-occupant Loans on G) Loans On Manufactured Number Average Value Number Average Value Number Average Value Number Average Value Number Average Value Number Average Value Number Average Value
LOANS ORIGINATED 17 $321,375 211 $189,729 476 $200,185 81 $118,424 3 $701,680 127 $188,094 14 $97,711 APPLICATIONS APPROVED, NOT ACCEPTED 0 $0 71 $170,305 153 $202,952 24 $91,379 0 $0 26 $191,443 12 $126,611 APPLICATIONS DENIED 5 $232,472 158 $198,769 512 $231,212 119 $108,890 1 $397,000 108 $223,621 17 $98,514 APPLICATIONS WITHDRAWN 7 $315,537 36 $223,432 193 $227,468 27 $131,828 0 $0 31 $226,864 2 $314,890 FILES CLOSED FOR INCOMPLETENESS 0 $0 28 $188,096 72 $240,526 7 $116,911 0 $0 7 $236,073 2 $210,660
Aggregated Statistics For Year 2006(Based on 3 full and 4 partial tracts) A) FHA, FSA/RHS & VA B) Conventional C) Refinancings D) Home Improvement Loans E) Loans on Dwellings For 5+ Families F) Non-occupant Loans on G) Loans On Manufactured Number Average Value Number Average Value Number Average Value Number Average Value Number Average Value Number Average Value Number Average Value
LOANS ORIGINATED 14 $256,276 690 $174,856 873 $197,540 154 $125,119 2 $631,500 197 $176,893 15 $139,884 APPLICATIONS APPROVED, NOT ACCEPTED 2 $327,275 170 $172,276 181 $200,142 28 $80,883 0 $0 38 $163,496 7 $97,090 APPLICATIONS DENIED 4 $275,495 356 $177,842 518 $212,220 138 $104,821 0 $0 94 $182,916 16 $98,929 APPLICATIONS WITHDRAWN 3 $153,977 157 $184,146 352 $209,214 51 $132,643 1 $3,873,860 41 $203,920 3 $199,473 FILES CLOSED FOR INCOMPLETENESS 0 $0 45 $178,200 109 $204,220 9 $137,559 0 $0 27 $171,867 0 $0
Aggregated Statistics For Year 2005(Based on 3 full and 4 partial tracts) A) FHA, FSA/RHS & VA B) Conventional C) Refinancings D) Home Improvement Loans E) Loans on Dwellings For 5+ Families F) Non-occupant Loans on G) Loans On Manufactured Number Average Value Number Average Value Number Average Value Number Average Value Number Average Value Number Average Value Number Average Value
LOANS ORIGINATED 15 $197,401 798 $159,133 991 $172,037 167 $113,358 5 $544,294 247 $147,793 19 $100,395 APPLICATIONS APPROVED, NOT ACCEPTED 1 $155,260 142 $161,411 195 $165,577 29 $97,994 0 $0 47 $141,550 3 $133,353 APPLICATIONS DENIED 1 $169,000 315 $152,879 463 $164,448 127 $95,649 4 $551,250 88 $151,099 21 $90,280 APPLICATIONS WITHDRAWN 3 $220,280 160 $160,851 380 $174,340 51 $123,223 1 $470,000 58 $130,765 9 $124,271 FILES CLOSED FOR INCOMPLETENESS 0 $0 34 $185,990 120 $173,821 6 $112,298 2 $543,235 12 $197,817 2 $141,545
Aggregated Statistics For Year 2004(Based on 3 full and 4 partial tracts) A) FHA, FSA/RHS & VA B) Conventional C) Refinancings D) Home Improvement Loans E) Loans on Dwellings For 5+ Families F) Non-occupant Loans on G) Loans On Manufactured Number Average Value Number Average Value Number Average Value Number Average Value Number Average Value Number Average Value Number Average Value
LOANS ORIGINATED 50 $157,922 822 $130,629 815 $133,791 86 $98,940 5 $467,726 191 $117,054 18 $83,307 APPLICATIONS APPROVED, NOT ACCEPTED 4 $162,370 154 $128,603 193 $133,685 18 $86,949 0 $0 37 $116,902 15 $70,437 APPLICATIONS DENIED 7 $153,969 266 $122,243 401 $126,269 108 $65,665 1 $400,000 68 $115,214 16 $99,621 APPLICATIONS WITHDRAWN 10 $150,989 114 $130,639 307 $129,530 41 $86,874 1 $1,200,000 35 $120,900 3 $74,527 FILES CLOSED FOR INCOMPLETENESS 1 $139,000 22 $120,091 97 $133,675 3 $30,243 0 $0 12 $110,650 1 $171,050
Aggregated Statistics For Year 2003(Based on 3 full and 4 partial tracts) A) FHA, FSA/RHS & VA B) Conventional C) Refinancings D) Home Improvement Loans E) Loans on Dwellings For 5+ Families F) Non-occupant Loans on Number Average Value Number Average Value Number Average Value Number Average Value Number Average Value Number Average Value
LOANS ORIGINATED 126 $126,165 454 $104,849 876 $101,163 33 $42,784 4 $2,587,582 200 $83,528 APPLICATIONS APPROVED, NOT ACCEPTED 8 $120,006 99 $99,761 150 $104,024 9 $30,989 0 $0 41 $89,659 APPLICATIONS DENIED 23 $126,273 112 $90,564 394 $94,474 52 $27,916 2 $138,405 56 $76,861 APPLICATIONS WITHDRAWN 14 $113,044 81 $105,474 286 $105,562 15 $51,791 0 $0 47 $76,109 FILES CLOSED FOR INCOMPLETENESS 4 $116,480 13 $105,493 43 $95,719 1 $38,750 0 $0 5 $73,870
Aggregated Statistics For Year 2002(Based on 1 full and 1 partial tracts) A) FHA, FSA/RHS & VA B) Conventional C) Refinancings D) Home Improvement Loans E) Loans on Dwellings For 5+ Families F) Non-occupant Loans on Number Average Value Number Average Value Number Average Value Number Average Value Number Average Value Number Average Value
LOANS ORIGINATED 56 $87,143 77 $73,279 168 $77,764 12 $23,248 0 $0 39 $64,193 APPLICATIONS APPROVED, NOT ACCEPTED 4 $117,755 29 $80,394 37 $79,199 2 $23,025 0 $0 9 $64,409 APPLICATIONS DENIED 2 $62,955 38 $73,951 121 $74,580 13 $11,162 0 $0 19 $71,381 APPLICATIONS WITHDRAWN 8 $85,994 23 $82,759 71 $80,977 5 $26,348 1 $147,370 12 $78,481 FILES CLOSED FOR INCOMPLETENESS 1 $17,000 8 $104,601 29 $91,030 2 $48,245 0 $0 5 $54,186
Aggregated Statistics For Year 2001(Based on 1 full and 1 partial tracts) A) FHA, FSA/RHS & VA B) Conventional C) Refinancings D) Home Improvement Loans E) Loans on Dwellings For 5+ Families F) Non-occupant Loans on Number Average Value Number Average Value Number Average Value Number Average Value Number Average Value Number Average Value
LOANS ORIGINATED 73 $67,092 54 $72,283 88 $69,649 15 $20,634 1 $1,853,520 22 $59,951 APPLICATIONS APPROVED, NOT ACCEPTED 8 $73,248 8 $67,678 22 $68,020 1 $35,000 0 $0 12 $61,547 APPLICATIONS DENIED 5 $89,108 33 $76,057 120 $71,941 21 $13,401 0 $0 18 $62,544 APPLICATIONS WITHDRAWN 13 $65,224 11 $67,985 68 $69,013 10 $23,825 0 $0 6 $57,055 FILES CLOSED FOR INCOMPLETENESS 0 $0 2 $111,405 15 $80,927 0 $0 0 $0 1 $103,000
Aggregated Statistics For Year 2000(Based on 1 full and 1 partial tracts) A) FHA, FSA/RHS & VA B) Conventional C) Refinancings D) Home Improvement Loans E) Loans on Dwellings For 5+ Families F) Non-occupant Loans on Number Average Value Number Average Value Number Average Value Number Average Value Number Average Value Number Average Value
LOANS ORIGINATED 51 $68,938 38 $59,681 55 $59,907 14 $23,827 0 $0 22 $57,380 APPLICATIONS APPROVED, NOT ACCEPTED 5 $38,400 12 $50,356 13 $68,272 11 $19,735 0 $0 5 $54,562 APPLICATIONS DENIED 9 $84,857 25 $56,884 75 $55,782 19 $25,519 1 $65,000 27 $48,743 APPLICATIONS WITHDRAWN 9 $68,688 11 $59,273 37 $61,729 3 $24,620 0 $0 4 $60,500 FILES CLOSED FOR INCOMPLETENESS 0 $0 4 $60,512 17 $69,444 2 $20,500 0 $0 3 $59,000
Aggregated Statistics For Year 1999(Based on 1 full and 2 partial tracts) A) FHA, FSA/RHS & VA B) Conventional C) Refinancings D) Home Improvement Loans E) Loans on Dwellings For 5+ Families F) Non-occupant Loans on Number Average Value Number Average Value Number Average Value Number Average Value Number Average Value Number Average Value
LOANS ORIGINATED 122 $76,971 108 $69,609 126 $70,379 25 $21,653 1 $63,910 33 $54,506 APPLICATIONS APPROVED, NOT ACCEPTED 7 $72,607 19 $55,905 37 $71,695 16 $17,985 0 $0 10 $72,077 APPLICATIONS DENIED 14 $74,303 50 $54,228 159 $58,984 40 $17,366 0 $0 40 $52,510 APPLICATIONS WITHDRAWN 17 $101,435 34 $69,057 80 $67,179 3 $22,610 0 $0 15 $65,323 FILES CLOSED FOR INCOMPLETENESS 3 $69,087 9 $79,740 17 $62,779 2 $19,150 0 $0 2 $43,165
Detailed HMDA statistics for the following Tracts:
0438.09
, 0441.01 , 0441.02 , 0441.03 , 0441.04 , 0442.00 , 0443.00
Private Mortgage Insurance Companies Aggregated Statistics For Year 2009(Based on 3 full and 3 partial tracts) A) Conventional B) Refinancings C) Non-occupant Loans on Number Average Value Number Average Value Number Average Value
LOANS ORIGINATED 4 $163,775 2 $171,860 0 $0 APPLICATIONS APPROVED, NOT ACCEPTED 6 $135,288 2 $216,015 1 $78,000 APPLICATIONS DENIED 1 $111,000 1 $158,240 0 $0 APPLICATIONS WITHDRAWN 0 $0 0 $0 0 $0 FILES CLOSED FOR INCOMPLETENESS 3 $224,200 0 $0 0 $0
Aggregated Statistics For Year 2008(Based on 3 full and 4 partial tracts) A) Conventional B) Refinancings C) Non-occupant Loans on Number Average Value Number Average Value Number Average Value
LOANS ORIGINATED 36 $181,818 7 $227,049 6 $119,565 APPLICATIONS APPROVED, NOT ACCEPTED 32 $231,831 37 $288,276 0 $0 APPLICATIONS DENIED 2 $193,815 2 $126,225 0 $0 APPLICATIONS WITHDRAWN 2 $229,810 0 $0 0 $0 FILES CLOSED FOR INCOMPLETENESS 1 $279,300 1 $268,060 1 $268,060
Aggregated Statistics For Year 2007(Based on 3 full and 4 partial tracts) A) Conventional B) Refinancings C) Non-occupant Loans on D) Loans On Manufactured Number Average Value Number Average Value Number Average Value Number Average Value
LOANS ORIGINATED 48 $275,030 27 $280,430 4 $310,695 1 $132,300 APPLICATIONS APPROVED, NOT ACCEPTED 12 $288,933 11 $310,365 2 $369,940 2 $220,560 APPLICATIONS DENIED 8 $362,840 2 $295,335 4 $270,430 0 $0 APPLICATIONS WITHDRAWN 1 $332,000 5 $288,124 1 $381,820 0 $0 FILES CLOSED FOR INCOMPLETENESS 0 $0 0 $0 0 $0 0 $0
Aggregated Statistics For Year 2006(Based on 2 full and 4 partial tracts) A) Conventional B) Refinancings C) Non-occupant Loans on D) Loans On Manufactured Number Average Value Number Average Value Number Average Value Number Average Value
LOANS ORIGINATED 15 $231,034 14 $259,236 2 $131,940 1 $185,240 APPLICATIONS APPROVED, NOT ACCEPTED 6 $257,995 2 $335,030 2 $247,305 0 $0 APPLICATIONS DENIED 0 $0 2 $329,855 0 $0 0 $0 APPLICATIONS WITHDRAWN 0 $0 1 $385,590 0 $0 0 $0 FILES CLOSED FOR INCOMPLETENESS 0 $0 0 $0 0 $0 0 $0
Aggregated Statistics For Year 2005(Based on 3 full and 4 partial tracts) A) Conventional B) Refinancings C) Non-occupant Loans on Number Average Value Number Average Value Number Average Value
LOANS ORIGINATED 26 $207,100 21 $208,686 9 $142,484 APPLICATIONS APPROVED, NOT ACCEPTED 6 $211,702 6 $170,480 1 $111,640 APPLICATIONS DENIED 1 $306,970 0 $0 0 $0 APPLICATIONS WITHDRAWN 1 $243,300 2 $312,575 1 $247,690 FILES CLOSED FOR INCOMPLETENESS 0 $0 0 $0 0 $0
Aggregated Statistics For Year 2004(Based on 3 full and 4 partial tracts) A) Conventional B) Refinancings C) Non-occupant Loans on Number Average Value Number Average Value Number Average Value
LOANS ORIGINATED 63 $161,780 19 $139,298 21 $132,656 APPLICATIONS APPROVED, NOT ACCEPTED 13 $159,695 5 $160,216 3 $162,017 APPLICATIONS DENIED 1 $111,840 0 $0 0 $0 APPLICATIONS WITHDRAWN 6 $161,660 4 $114,760 0 $0 FILES CLOSED FOR INCOMPLETENESS 0 $0 0 $0 0 $0
Aggregated Statistics For Year 2003(Based on 3 full and 4 partial tracts) A) Conventional B) Refinancings C) Non-occupant Loans on Number Average Value Number Average Value Number Average Value
LOANS ORIGINATED 101 $122,420 48 $132,449 21 $105,595 APPLICATIONS APPROVED, NOT ACCEPTED 9 $118,467 14 $120,171 3 $124,667 APPLICATIONS DENIED 2 $107,540 2 $105,500 1 $110,690 APPLICATIONS WITHDRAWN 6 $156,370 1 $93,390 1 $51,750 FILES CLOSED FOR INCOMPLETENESS 1 $64,850 0 $0 0 $0
Aggregated Statistics For Year 2002(Based on 1 full and 1 partial tracts) A) Conventional B) Refinancings C) Non-occupant Loans on Number Average Value Number Average Value Number Average Value
LOANS ORIGINATED 20 $105,368 15 $106,981 6 $73,985 APPLICATIONS APPROVED, NOT ACCEPTED 4 $80,702 4 $116,888 2 $100,000 APPLICATIONS DENIED 0 $0 0 $0 0 $0 APPLICATIONS WITHDRAWN 0 $0 0 $0 0 $0 FILES CLOSED FOR INCOMPLETENESS 0 $0 0 $0 0 $0
Aggregated Statistics For Year 2001(Based on 1 full and 1 partial tracts) A) Conventional B) Refinancings C) Non-occupant Loans on Number Average Value Number Average Value Number Average Value
LOANS ORIGINATED 16 $88,621 8 $76,802 4 $62,438 APPLICATIONS APPROVED, NOT ACCEPTED 4 $75,232 2 $73,685 1 $69,300 APPLICATIONS DENIED 0 $0 0 $0 0 $0 APPLICATIONS WITHDRAWN 0 $0 3 $70,177 0 $0 FILES CLOSED FOR INCOMPLETENESS 0 $0 0 $0 0 $0
Aggregated Statistics For Year 2000(Based on 1 full and 1 partial tracts) A) Conventional B) Refinancings C) Non-occupant Loans on Number Average Value Number Average Value Number Average Value
LOANS ORIGINATED 19 $69,128 9 $64,333 6 $66,938 APPLICATIONS APPROVED, NOT ACCEPTED 4 $50,510 1 $62,000 0 $0 APPLICATIONS DENIED 1 $68,000 0 $0 0 $0 APPLICATIONS WITHDRAWN 2 $51,210 0 $0 1 $68,420 FILES CLOSED FOR INCOMPLETENESS 1 $63,000 0 $0 0 $0
Aggregated Statistics For Year 1999(Based on 1 full and 2 partial tracts) A) Conventional B) Refinancings C) Non-occupant Loans on Number Average Value Number Average Value Number Average Value
LOANS ORIGINATED 24 $76,180 18 $81,921 5 $70,342 APPLICATIONS APPROVED, NOT ACCEPTED 1 $51,010 3 $107,730 0 $0 APPLICATIONS DENIED 3 $81,663 1 $69,000 2 $76,810 APPLICATIONS WITHDRAWN 1 $45,970 0 $0 0 $0 FILES CLOSED FOR INCOMPLETENESS 0 $0 0 $0 0 $0
Detailed PMIC statistics for the following Tracts:
0438.09
, 0441.01 , 0441.02 , 0441.03 , 0441.04 , 0442.00 , 0443.00 Fire-safe hotels and motels in Banning, California:
Quality Inn I-10 Banning, 1690 W Ramsey St, Banning, California 92220 Phone: (951) 849-8888
Travelodge Banning, 1700 W Ramsey St, Banning, California 92220 Phone: (951) 849-1000, Fax: (951) 849-4071
Hampton Inn & Suites, 6071 Joshua Palmer Way, Banning, California 92220 Phone: (951) 922-1000, Fax: (951) 922-6552
Country Inn, 932 E Ramsey St, Banning, California 92220 Phone: (951) 849-6733, Fax: (951) 849-5996
Holiday Inn Express, 3020 W Ramsey St, Banning, California 92220 Phone: (951) 572-5550, Fax: (951) 849-5797
All 5 fire-safe hotels and motels in Banning, California
Most common first names in Banning, CA among deceased individuals Name Count Lived (average)
John 246 77.2 years Robert 194 74.7 years William 194 77.5 years James 171 73.6 years Mary 167 79.8 years Charles 134 76.3 years George 119 77.7 years Joseph 118 76.5 years Richard 90 71.8 years Margaret 84 79.6 years
Most common last names in Banning, CA among deceased individuals Last name Count Lived (average)
Johnson 95 78.1 years Smith 93 75.1 years Brown 60 76.7 years Miller 59 78.2 years Jones 53 78.8 years Williams 52 72.9 years Davis 39 72.2 years Taylor 38 77.7 years Anderson 35 78.2 years Jackson 34 76.6 years
Banning compared to California state average:
Median household income below state average. Median house value below state average. Unemployed percentage below state average. Black race population percentage above state average. Median age significantly above state average. Length of stay since moving in above state average. Institutionalized population percentage above state average. Percentage of population with a bachelor's degree or higher below state average.
#78 on the list of "Top 101 cities with the most residents born in Laos (population 500+)"
#100 on the list of "Top 101 cities with the largest percentage of people in job corps and vocational training facilities (population 1,000+)"
#47 (92230) on the list of "Top 101 zip codes with the lowest 2012 average taxable interest for individuals (pop 1,000+)"
#3 on the list of "Top 101 counties with the highest lead air pollution readings in 2012 (µg/m3 )"
#4 on the list of "Top 101 counties with the highest ground withdrawal of fresh water for public supply"
#11 on the list of "Top 101 counties with the most Catholic adherents"
#11 on the list of "Top 101 counties with the highest total withdrawal of fresh water for public supply"
#12 on the list of "Top 101 counties with the highest carbon monoxide air pollution readings in 2012 (ppm)"
Top Patent Applicants
Warner Olan Harris (4)
Scott Marcell (2)
Aaron A. Alexander (2)
Steve W. Downs (1)
Wolfgang Joe Kollmann (1)
Inthavong Nanthavongdouangsy (1)
Phillip Tarantino (1)
Lowell Bowles (1)
Albert James Evinger, Iii (1)
Robert Timothy Pearson (1)
Total of 16 patent applications in 2008-2024.
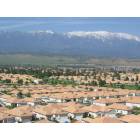
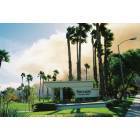
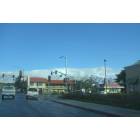
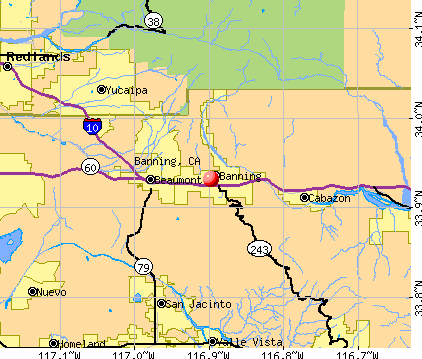


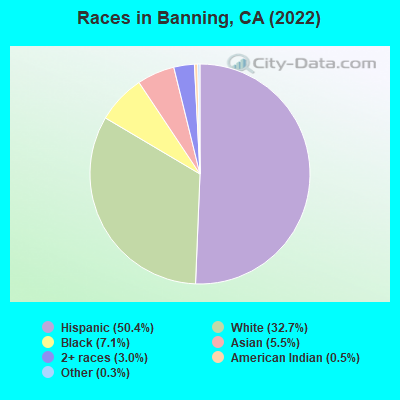
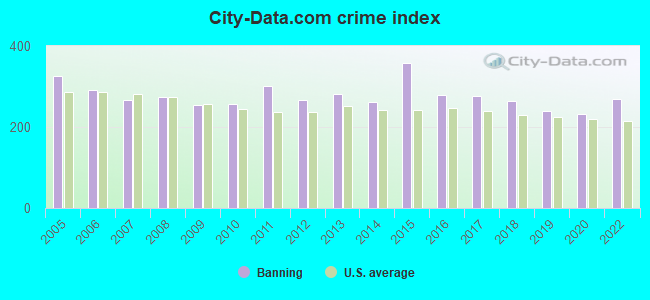
 Recent articles from our blog. Our writers, many of them Ph.D. graduates or candidates, create easy-to-read articles on a wide variety of topics.

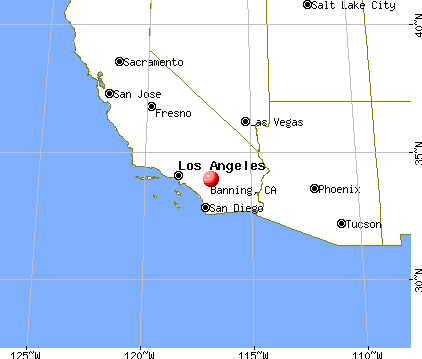
 (0.8 miles
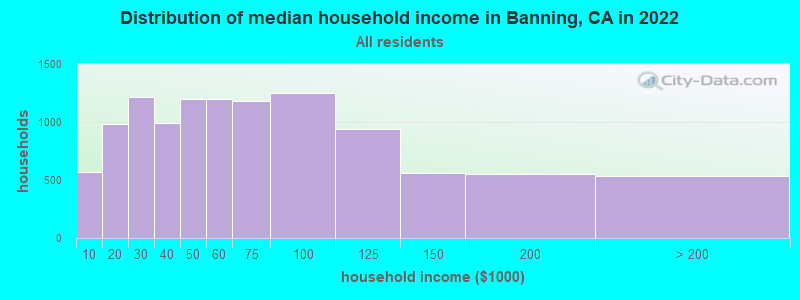
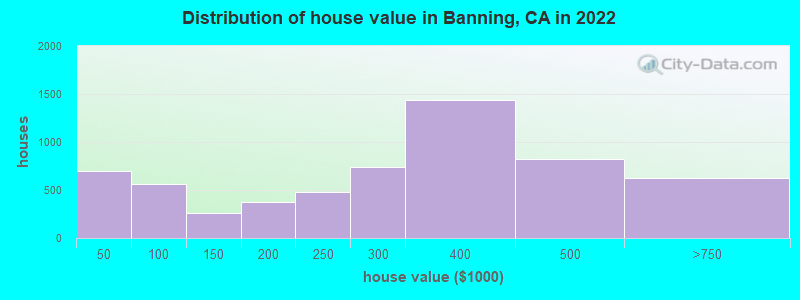

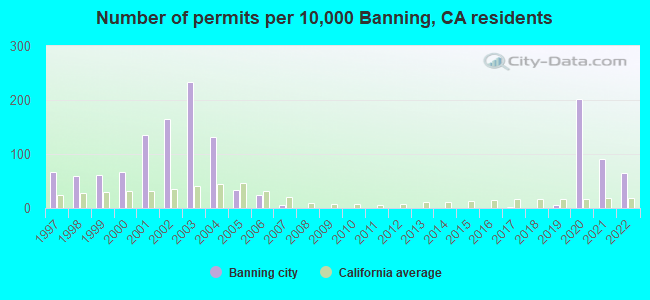
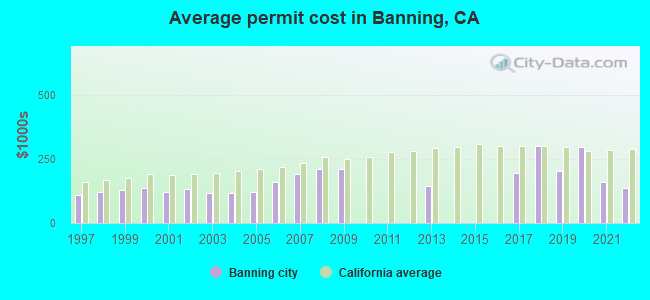
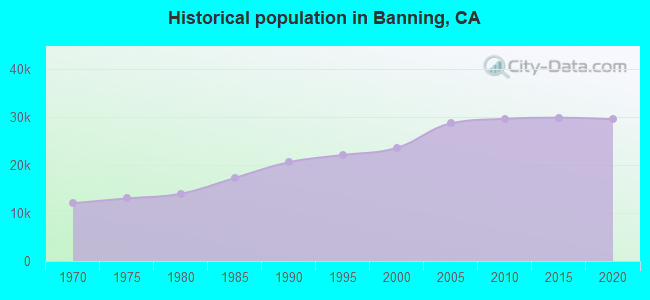
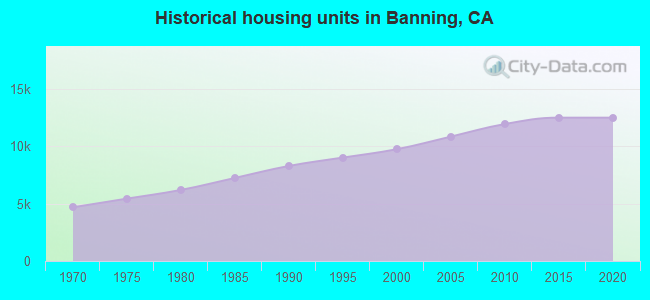
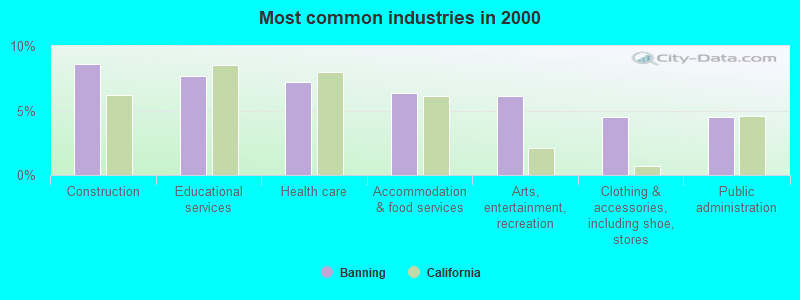
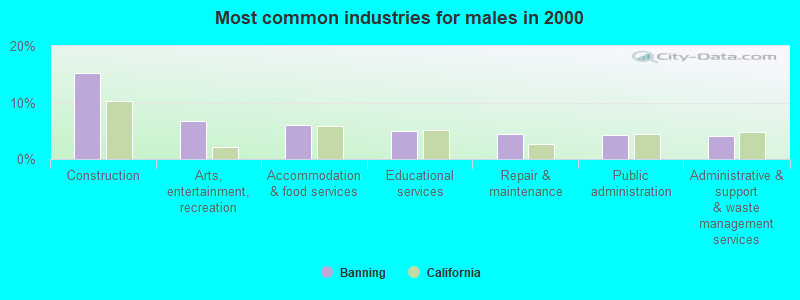
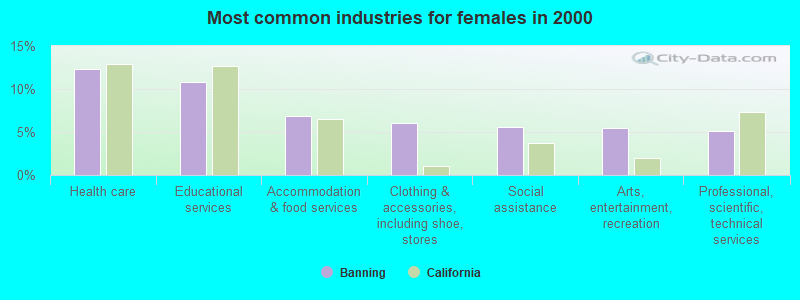
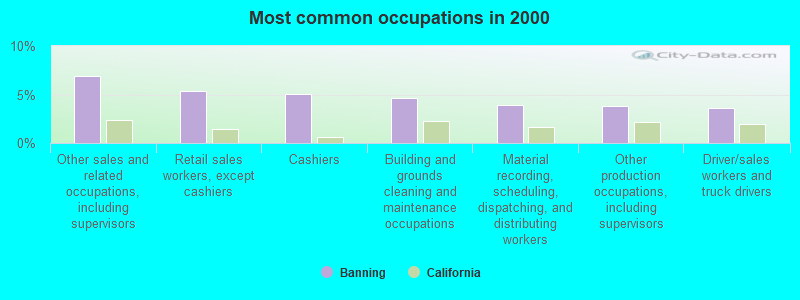
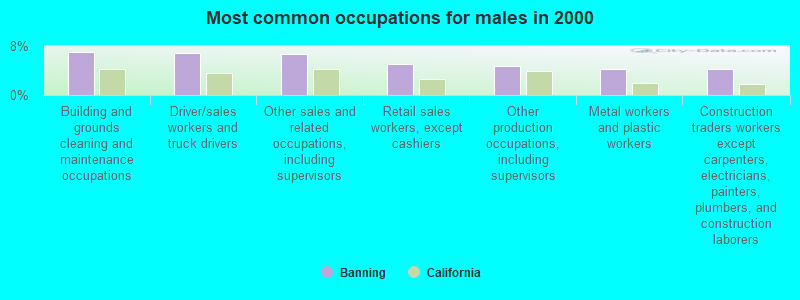
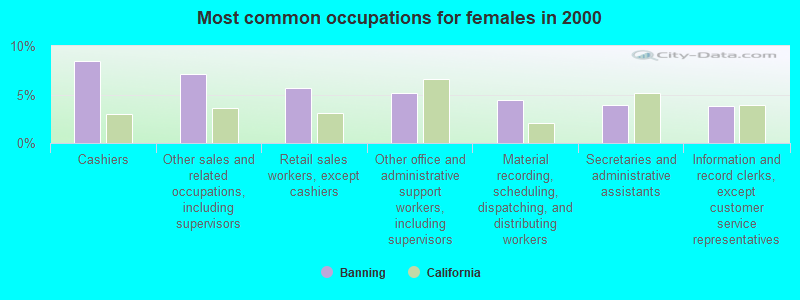
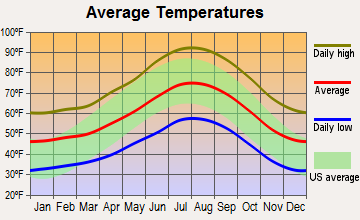
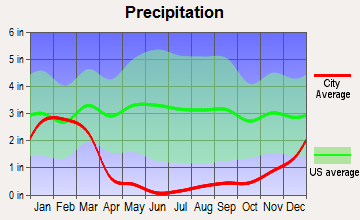
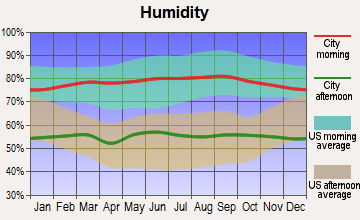
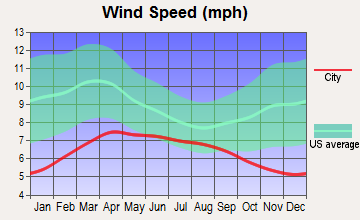
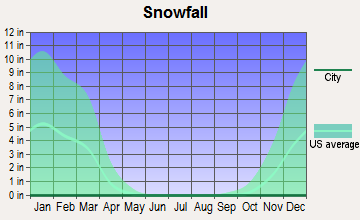
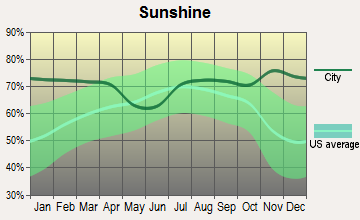
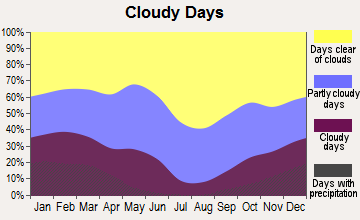


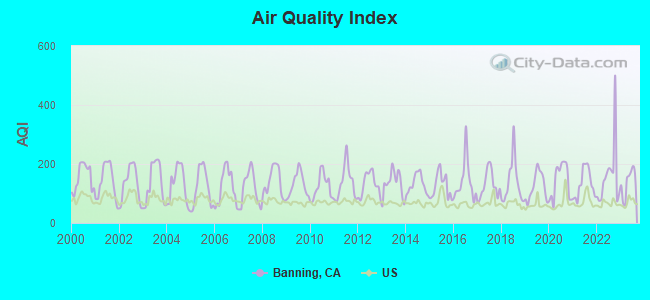
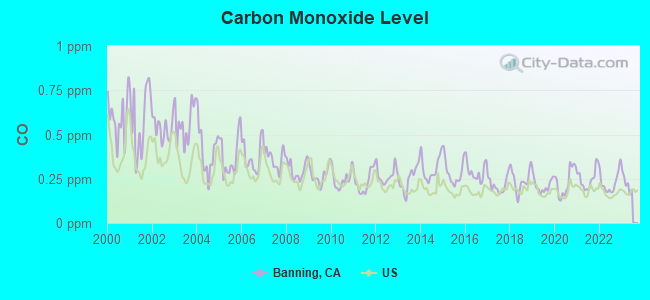
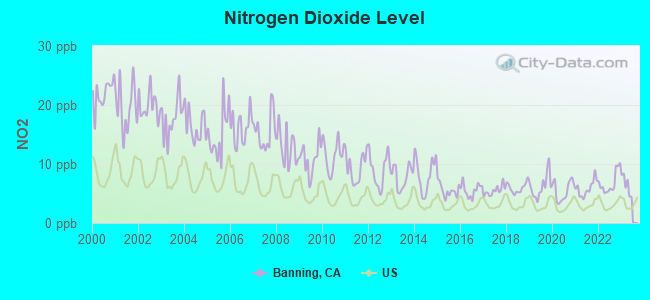
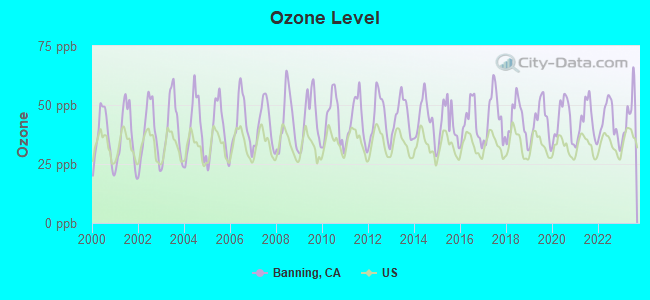
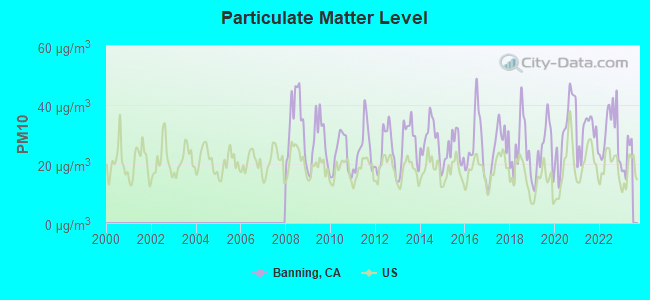
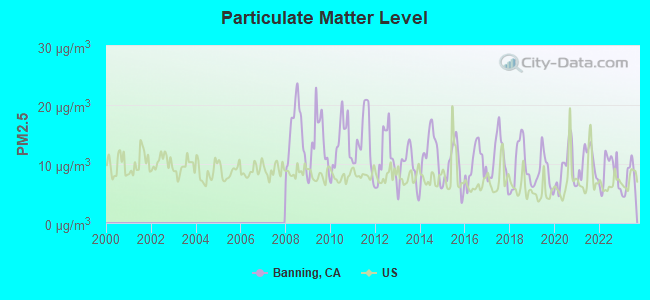
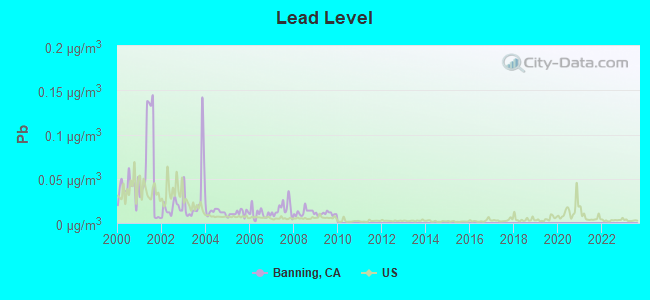

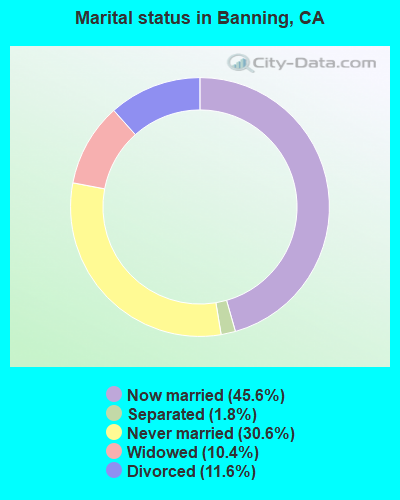
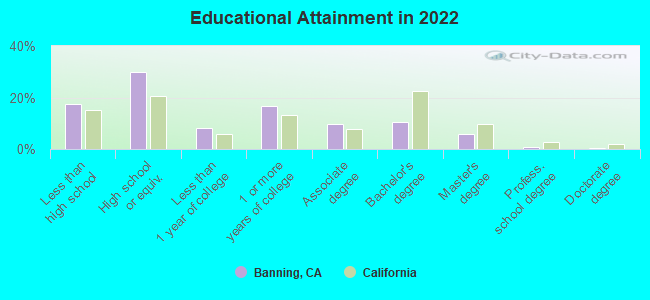
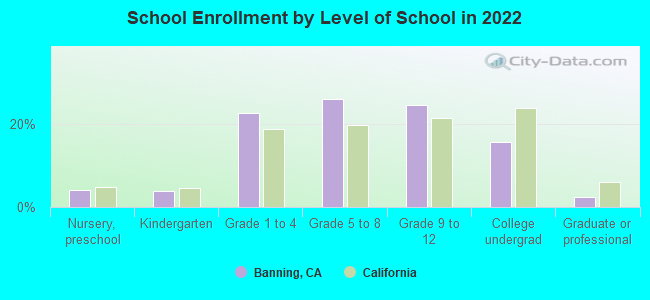
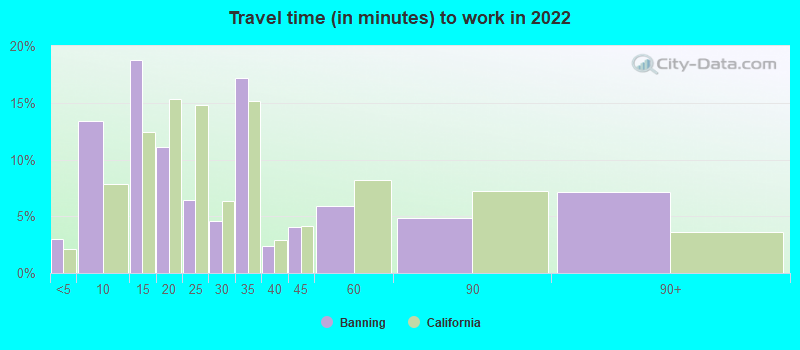
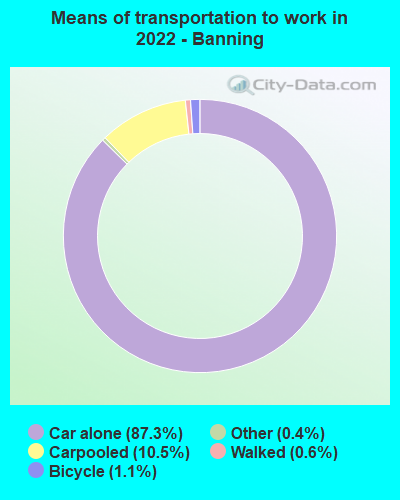


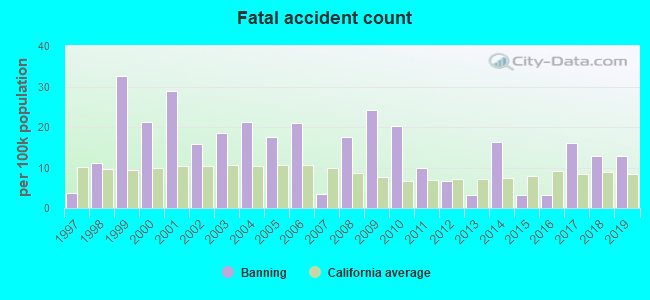
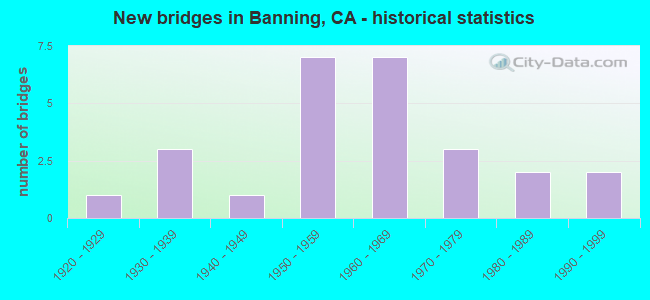
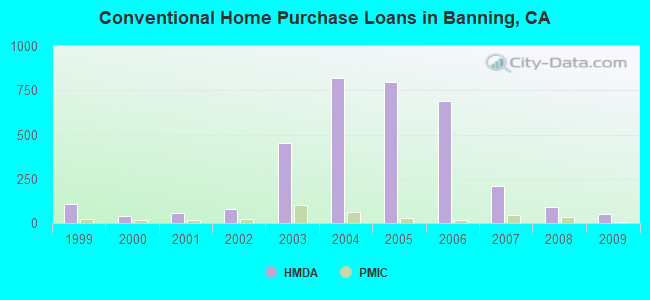
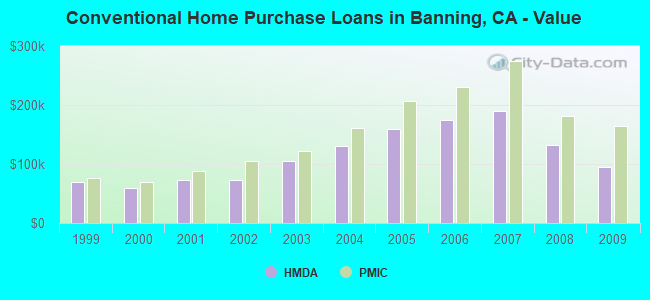
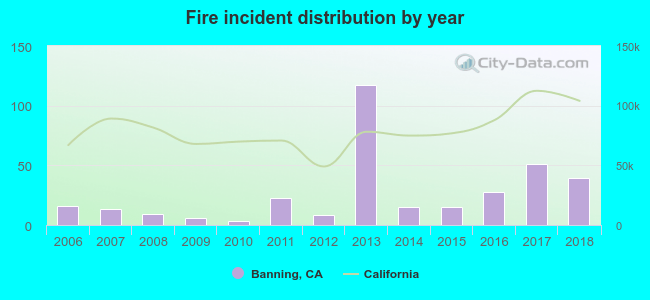 According to the data from the years 2006 - 2018 the average number of fires per year is 26. The highest number of fires - 117 took place in 2013, and the least - 3 in 2010. The data has a growing trend.
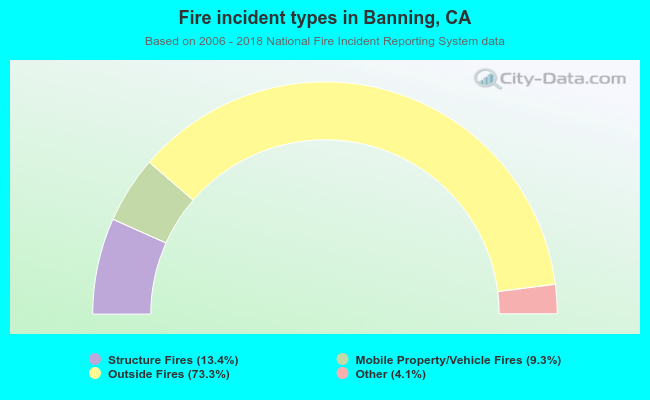 When looking into fire subcategories, the most reports belonged to: Outside Fires (73.3%), and Structure Fires (13.4%).