Bellevue, Kentucky Submit your own pictures of this city and show them to the world
OSM Map
General Map
Google Map
MSN Map
OSM Map
General Map
Google Map
MSN Map
OSM Map
General Map
Google Map
MSN Map
OSM Map
General Map
Google Map
MSN Map
Please wait while loading the map...
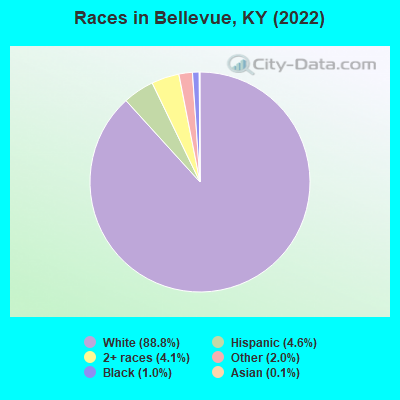
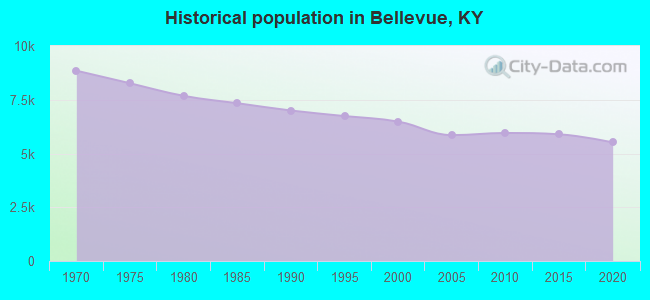
Population in 2022: 5,630 (100% urban, 0% rural). Population change since 2000: -13.1%Males: 2,876 Females: 2,754
March 2022 cost of living index in Bellevue: 88.3 (less than average, U.S. average is 100) Percentage of residents living in poverty in 2022: 15.4%for White Non-Hispanic residents , 48.3% for Black residents , 100.0% for other race residents , 20.1% for two or more races residents )
Profiles of local businesses
Business Search - 14 Million verified businesses
Data:
Median household income ($)
Median household income (% change since 2000)
Household income diversity
Ratio of average income to average house value (%)
Ratio of average income to average rent
Median household income ($) - White
Median household income ($) - Black or African American
Median household income ($) - Asian
Median household income ($) - Hispanic or Latino
Median household income ($) - American Indian and Alaska Native
Median household income ($) - Multirace
Median household income ($) - Other Race
Median household income for houses/condos with a mortgage ($)
Median household income for apartments without a mortgage ($)
Races - White alone (%)
Races - White alone (% change since 2000)
Races - Black alone (%)
Races - Black alone (% change since 2000)
Races - American Indian alone (%)
Races - American Indian alone (% change since 2000)
Races - Asian alone (%)
Races - Asian alone (% change since 2000)
Races - Hispanic (%)
Races - Hispanic (% change since 2000)
Races - Native Hawaiian and Other Pacific Islander alone (%)
Races - Native Hawaiian and Other Pacific Islander alone (% change since 2000)
Races - Two or more races (%)
Races - Two or more races (% change since 2000)
Races - Other race alone (%)
Races - Other race alone (% change since 2000)
Racial diversity
Unemployment (%)
Unemployment (% change since 2000)
Unemployment (%) - White
Unemployment (%) - Black or African American
Unemployment (%) - Asian
Unemployment (%) - Hispanic or Latino
Unemployment (%) - American Indian and Alaska Native
Unemployment (%) - Multirace
Unemployment (%) - Other Race
Population density (people per square mile)
Population - Males (%)
Population - Females (%)
Population - Males (%) - White
Population - Males (%) - Black or African American
Population - Males (%) - Asian
Population - Males (%) - Hispanic or Latino
Population - Males (%) - American Indian and Alaska Native
Population - Males (%) - Multirace
Population - Males (%) - Other Race
Population - Females (%) - White
Population - Females (%) - Black or African American
Population - Females (%) - Asian
Population - Females (%) - Hispanic or Latino
Population - Females (%) - American Indian and Alaska Native
Population - Females (%) - Multirace
Population - Females (%) - Other Race
Coronavirus confirmed cases (Apr 24, 2024)
Deaths caused by coronavirus (Apr 24, 2024)
Coronavirus confirmed cases (per 100k population) (Apr 24, 2024)
Deaths caused by coronavirus (per 100k population) (Apr 24, 2024)
Daily increase in number of cases (Apr 24, 2024)
Weekly increase in number of cases (Apr 24, 2024)
Cases doubled (in days) (Apr 24, 2024)
Hospitalized patients (Apr 18, 2022)
Negative test results (Apr 18, 2022)
Total test results (Apr 18, 2022)
COVID Vaccine doses distributed (per 100k population) (Sep 19, 2023)
COVID Vaccine doses administered (per 100k population) (Sep 19, 2023)
COVID Vaccine doses distributed (Sep 19, 2023)
COVID Vaccine doses administered (Sep 19, 2023)
Likely homosexual households (%)
Likely homosexual households (% change since 2000)
Likely homosexual households - Lesbian couples (%)
Likely homosexual households - Lesbian couples (% change since 2000)
Likely homosexual households - Gay men (%)
Likely homosexual households - Gay men (% change since 2000)
Cost of living index
Median gross rent ($)
Median contract rent ($)
Median monthly housing costs ($)
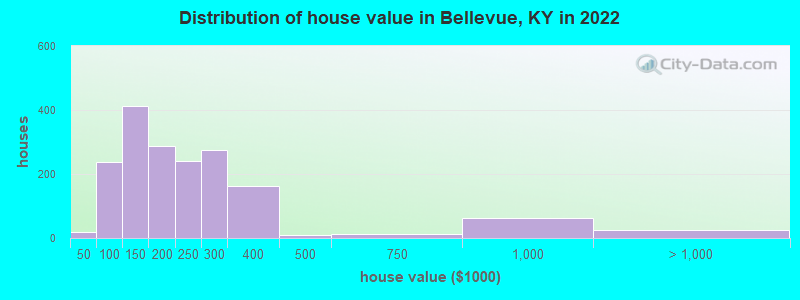
Median house or condo value ($)
Median house or condo value ($ change since 2000)
Mean house or condo value by units in structure - 1, detached ($)
Mean house or condo value by units in structure - 1, attached ($)
Mean house or condo value by units in structure - 2 ($)
Mean house or condo value by units in structure by units in structure - 3 or 4 ($)
Mean house or condo value by units in structure - 5 or more ($)
Mean house or condo value by units in structure - Boat, RV, van, etc. ($)
Mean house or condo value by units in structure - Mobile home ($)
Median house or condo value ($) - White
Median house or condo value ($) - Black or African American
Median house or condo value ($) - Asian
Median house or condo value ($) - Hispanic or Latino
Median house or condo value ($) - American Indian and Alaska Native
Median house or condo value ($) - Multirace
Median house or condo value ($) - Other Race
Median resident age
Resident age diversity
Median resident age - Males
Median resident age - Females
Median resident age - White
Median resident age - Black or African American
Median resident age - Asian
Median resident age - Hispanic or Latino
Median resident age - American Indian and Alaska Native
Median resident age - Multirace
Median resident age - Other Race
Median resident age - Males - White
Median resident age - Males - Black or African American
Median resident age - Males - Asian
Median resident age - Males - Hispanic or Latino
Median resident age - Males - American Indian and Alaska Native
Median resident age - Males - Multirace
Median resident age - Males - Other Race
Median resident age - Females - White
Median resident age - Females - Black or African American
Median resident age - Females - Asian
Median resident age - Females - Hispanic or Latino
Median resident age - Females - American Indian and Alaska Native
Median resident age - Females - Multirace
Median resident age - Females - Other Race
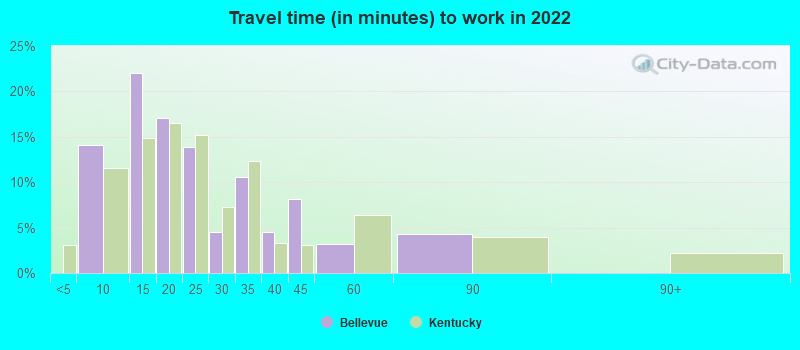
Commute - mean travel time to work (minutes)
Travel time to work - Less than 5 minutes (%)
Travel time to work - Less than 5 minutes (% change since 2000)
Travel time to work - 5 to 9 minutes (%)
Travel time to work - 5 to 9 minutes (% change since 2000)
Travel time to work - 10 to 19 minutes (%)
Travel time to work - 10 to 19 minutes (% change since 2000)
Travel time to work - 20 to 29 minutes (%)
Travel time to work - 20 to 29 minutes (% change since 2000)
Travel time to work - 30 to 39 minutes (%)
Travel time to work - 30 to 39 minutes (% change since 2000)
Travel time to work - 40 to 59 minutes (%)
Travel time to work - 40 to 59 minutes (% change since 2000)
Travel time to work - 60 to 89 minutes (%)
Travel time to work - 60 to 89 minutes (% change since 2000)
Travel time to work - 90 or more minutes (%)
Travel time to work - 90 or more minutes (% change since 2000)
Marital status - Never married (%)
Marital status - Now married (%)
Marital status - Separated (%)
Marital status - Widowed (%)
Marital status - Divorced (%)
Median family income ($)
Median family income (% change since 2000)
Median non-family income ($)
Median non-family income (% change since 2000)
Median per capita income ($)
Median per capita income (% change since 2000)
Median family income ($) - White
Median family income ($) - Black or African American
Median family income ($) - Asian
Median family income ($) - Hispanic or Latino
Median family income ($) - American Indian and Alaska Native
Median family income ($) - Multirace
Median family income ($) - Other Race
Median year house/condo built
Median year apartment built
Year house built - Built 2005 or later (%)
Year house built - Built 2000 to 2004 (%)
Year house built - Built 1990 to 1999 (%)
Year house built - Built 1980 to 1989 (%)
Year house built - Built 1970 to 1979 (%)
Year house built - Built 1960 to 1969 (%)
Year house built - Built 1950 to 1959 (%)
Year house built - Built 1940 to 1949 (%)
Year house built - Built 1939 or earlier (%)
Average household size
Household density (households per square mile)
Average household size - White
Average household size - Black or African American
Average household size - Asian
Average household size - Hispanic or Latino
Average household size - American Indian and Alaska Native
Average household size - Multirace
Average household size - Other Race
Occupied housing units (%)
Vacant housing units (%)
Owner occupied housing units (%)
Renter occupied housing units (%)
Vacancy status - For rent (%)
Vacancy status - For sale only (%)
Vacancy status - Rented or sold, not occupied (%)
Vacancy status - For seasonal, recreational, or occasional use (%)
Vacancy status - For migrant workers (%)
Vacancy status - Other vacant (%)
Residents with income below the poverty level (%)
Residents with income below 50% of the poverty level (%)
Children below poverty level (%)
Poor families by family type - Married-couple family (%)
Poor families by family type - Male, no wife present (%)
Poor families by family type - Female, no husband present (%)
Poverty status for native-born residents (%)
Poverty status for foreign-born residents (%)
Poverty among high school graduates not in families (%)
Poverty among people who did not graduate high school not in families (%)
Residents with income below the poverty level (%) - White
Residents with income below the poverty level (%) - Black or African American
Residents with income below the poverty level (%) - Asian
Residents with income below the poverty level (%) - Hispanic or Latino
Residents with income below the poverty level (%) - American Indian and Alaska Native
Residents with income below the poverty level (%) - Multirace
Residents with income below the poverty level (%) - Other Race
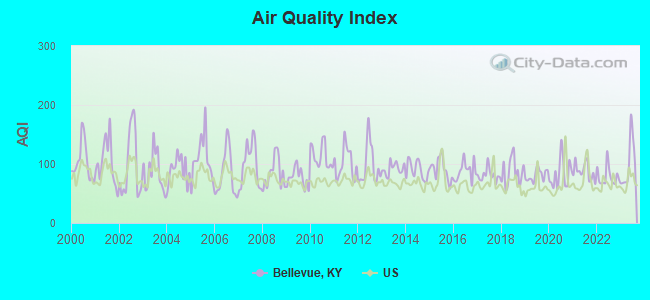
Air pollution - Air Quality Index (AQI)
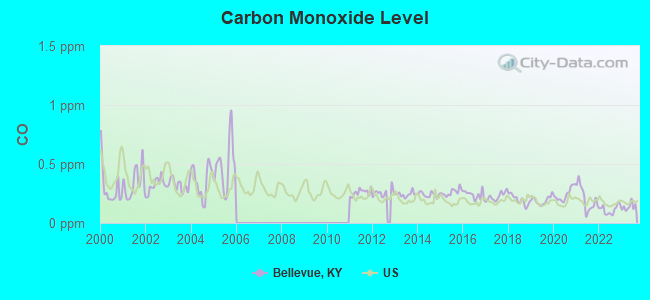
Air pollution - CO
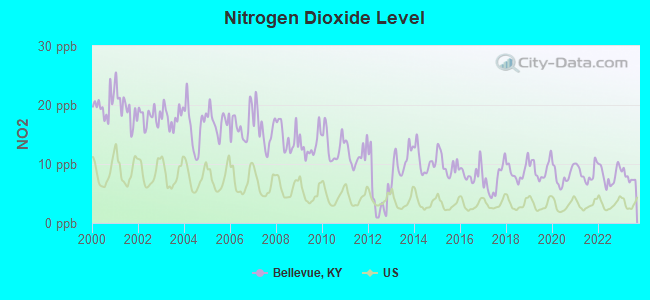
Air pollution - NO2
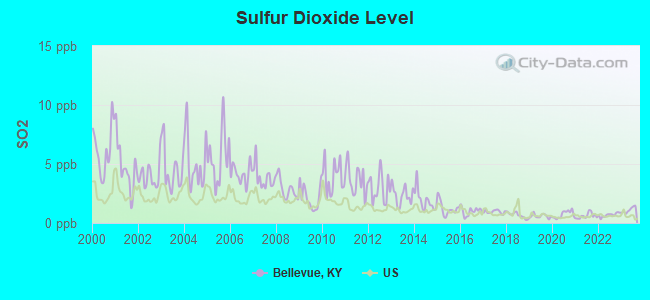
Air pollution - SO2
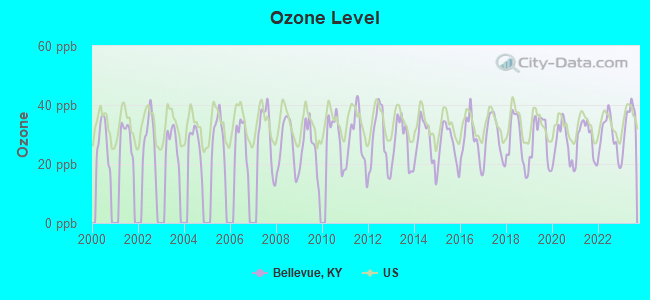
Air pollution - Ozone
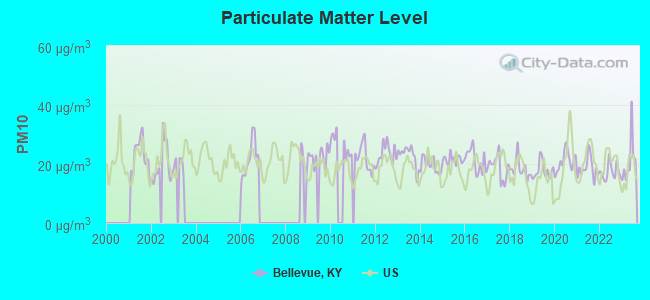
Air pollution - PM10
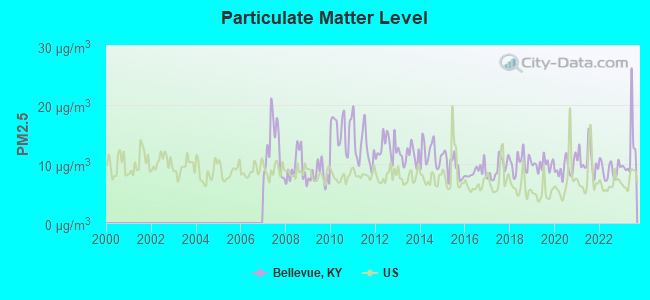
Air pollution - PM25
Air pollution - Pb
Crime - Murders per 100,000 population
Crime - Rapes per 100,000 population
Crime - Robberies per 100,000 population
Crime - Assaults per 100,000 population
Crime - Burglaries per 100,000 population
Crime - Thefts per 100,000 population
Crime - Auto thefts per 100,000 population
Crime - Arson per 100,000 population
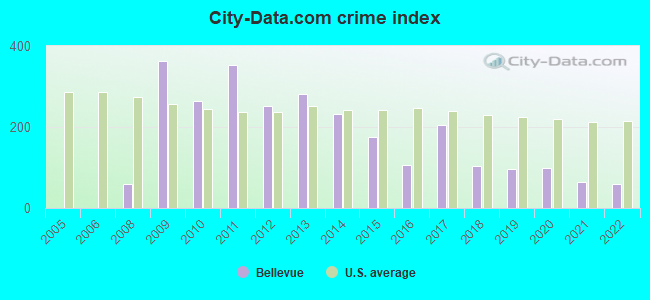
Crime - City-data.com crime index
Crime - Violent crime index
Crime - Property crime index
Crime - Murders per 100,000 population (5 year average)
Crime - Rapes per 100,000 population (5 year average)
Crime - Robberies per 100,000 population (5 year average)
Crime - Assaults per 100,000 population (5 year average)
Crime - Burglaries per 100,000 population (5 year average)
Crime - Thefts per 100,000 population (5 year average)
Crime - Auto thefts per 100,000 population (5 year average)
Crime - Arson per 100,000 population (5 year average)
Crime - City-data.com crime index (5 year average)
Crime - Violent crime index (5 year average)
Crime - Property crime index (5 year average)
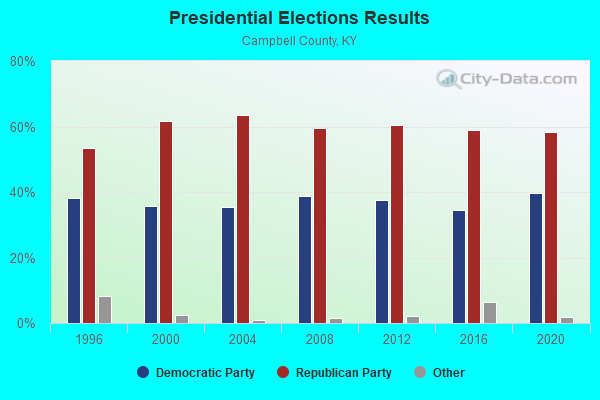
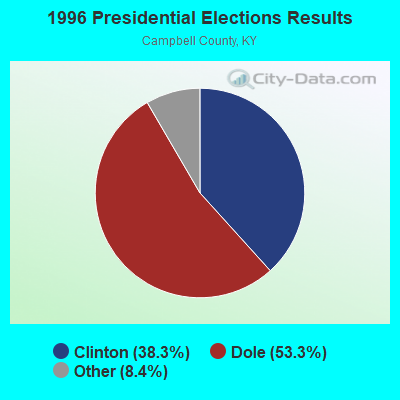
1996 Presidential Elections Results (%) - Democratic Party (Clinton)
1996 Presidential Elections Results (%) - Republican Party (Dole)
1996 Presidential Elections Results (%) - Other
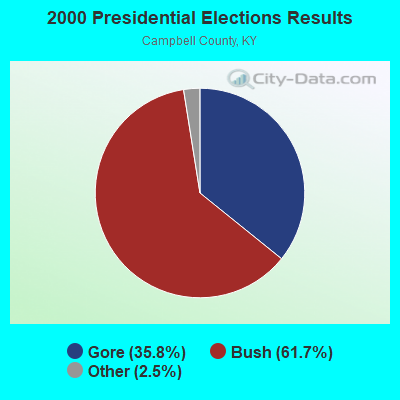
2000 Presidential Elections Results (%) - Democratic Party (Gore)
2000 Presidential Elections Results (%) - Republican Party (Bush)
2000 Presidential Elections Results (%) - Other
2004 Presidential Elections Results (%) - Democratic Party (Kerry)
2004 Presidential Elections Results (%) - Republican Party (Bush)
2004 Presidential Elections Results (%) - Other
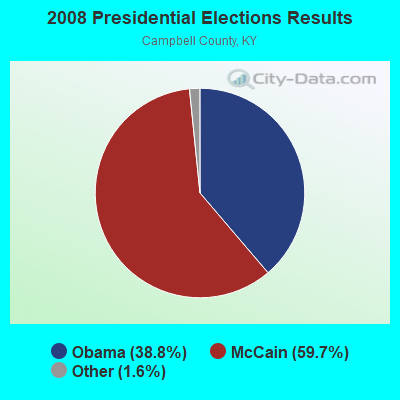
2008 Presidential Elections Results (%) - Democratic Party (Obama)
2008 Presidential Elections Results (%) - Republican Party (McCain)
2008 Presidential Elections Results (%) - Other
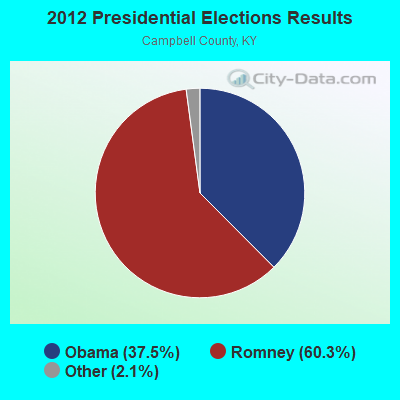
2012 Presidential Elections Results (%) - Democratic Party (Obama)
2012 Presidential Elections Results (%) - Republican Party (Romney)
2012 Presidential Elections Results (%) - Other
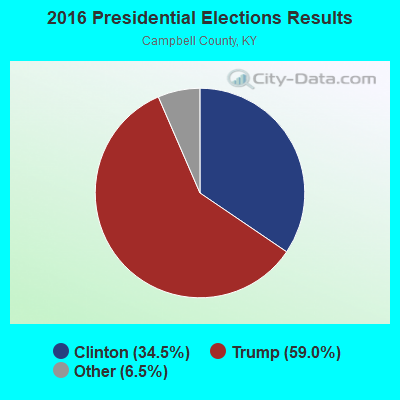
2016 Presidential Elections Results (%) - Democratic Party (Clinton)
2016 Presidential Elections Results (%) - Republican Party (Trump)
2016 Presidential Elections Results (%) - Other
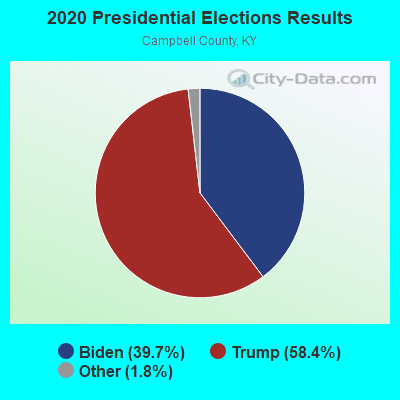
2020 Presidential Elections Results (%) - Democratic Party (Biden)
2020 Presidential Elections Results (%) - Republican Party (Trump)
2020 Presidential Elections Results (%) - Other
Ancestries Reported - Arab (%)
Ancestries Reported - Czech (%)
Ancestries Reported - Danish (%)
Ancestries Reported - Dutch (%)
Ancestries Reported - English (%)
Ancestries Reported - French (%)
Ancestries Reported - French Canadian (%)
Ancestries Reported - German (%)
Ancestries Reported - Greek (%)
Ancestries Reported - Hungarian (%)
Ancestries Reported - Irish (%)
Ancestries Reported - Italian (%)
Ancestries Reported - Lithuanian (%)
Ancestries Reported - Norwegian (%)
Ancestries Reported - Polish (%)
Ancestries Reported - Portuguese (%)
Ancestries Reported - Russian (%)
Ancestries Reported - Scotch-Irish (%)
Ancestries Reported - Scottish (%)
Ancestries Reported - Slovak (%)
Ancestries Reported - Subsaharan African (%)
Ancestries Reported - Swedish (%)
Ancestries Reported - Swiss (%)
Ancestries Reported - Ukrainian (%)
Ancestries Reported - United States (%)
Ancestries Reported - Welsh (%)
Ancestries Reported - West Indian (%)
Ancestries Reported - Other (%)
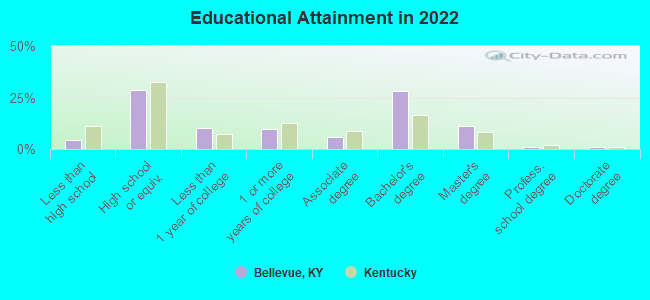
Educational Attainment - No schooling completed (%)
Educational Attainment - Less than high school (%)
Educational Attainment - High school or equivalent (%)
Educational Attainment - Less than 1 year of college (%)
Educational Attainment - 1 or more years of college (%)
Educational Attainment - Associate degree (%)
Educational Attainment - Bachelor's degree (%)
Educational Attainment - Master's degree (%)
Educational Attainment - Professional school degree (%)
Educational Attainment - Doctorate degree (%)
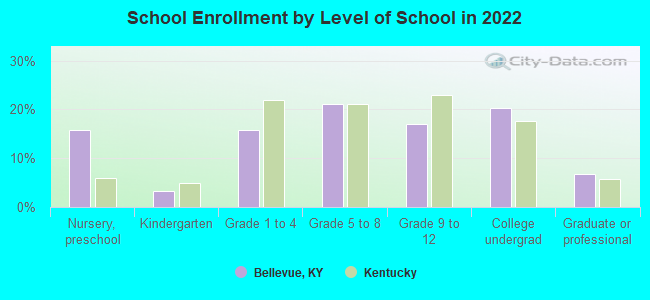
School Enrollment - Nursery, preschool (%)
School Enrollment - Kindergarten (%)
School Enrollment - Grade 1 to 4 (%)
School Enrollment - Grade 5 to 8 (%)
School Enrollment - Grade 9 to 12 (%)
School Enrollment - College undergrad (%)
School Enrollment - Graduate or professional (%)
School Enrollment - Not enrolled in school (%)
School enrollment - Public schools (%)
School enrollment - Private schools (%)
School enrollment - Not enrolled (%)
Median number of rooms in houses and condos
Median number of rooms in apartments
Housing units lacking complete plumbing facilities (%)
Housing units lacking complete kitchen facilities (%)
Density of houses
Urban houses (%)
Rural houses (%)
Households with people 60 years and over (%)
Households with people 65 years and over (%)
Households with people 75 years and over (%)
Households with one or more nonrelatives (%)
Households with no nonrelatives (%)
Population in households (%)
Family households (%)
Nonfamily households (%)
Population in families (%)
Family households with own children (%)
Median number of bedrooms in owner occupied houses
Mean number of bedrooms in owner occupied houses
Median number of bedrooms in renter occupied houses
Mean number of bedrooms in renter occupied houses
Median number of vehichles in owner occupied houses
Mean number of vehichles in owner occupied houses
Median number of vehichles in renter occupied houses
Mean number of vehichles in renter occupied houses
Mortgage status - with mortgage (%)
Mortgage status - with second mortgage (%)
Mortgage status - with home equity loan (%)
Mortgage status - with both second mortgage and home equity loan (%)
Mortgage status - without a mortgage (%)
Average family size
Average family size - White
Average family size - Black or African American
Average family size - Asian
Average family size - Hispanic or Latino
Average family size - American Indian and Alaska Native
Average family size - Multirace
Average family size - Other Race
Geographical mobility - Same house 1 year ago (%)
Geographical mobility - Moved within same county (%)
Geographical mobility - Moved from different county within same state (%)
Geographical mobility - Moved from different state (%)
Geographical mobility - Moved from abroad (%)
Place of birth - Born in state of residence (%)
Place of birth - Born in other state (%)
Place of birth - Native, outside of US (%)
Place of birth - Foreign born (%)
Housing units in structures - 1, detached (%)
Housing units in structures - 1, attached (%)
Housing units in structures - 2 (%)
Housing units in structures - 3 or 4 (%)
Housing units in structures - 5 to 9 (%)
Housing units in structures - 10 to 19 (%)
Housing units in structures - 20 to 49 (%)
Housing units in structures - 50 or more (%)
Housing units in structures - Mobile home (%)
Housing units in structures - Boat, RV, van, etc. (%)
House/condo owner moved in on average (years ago)
Renter moved in on average (years ago)
Year householder moved into unit - Moved in 1999 to March 2000 (%)
Year householder moved into unit - Moved in 1995 to 1998 (%)
Year householder moved into unit - Moved in 1990 to 1994 (%)
Year householder moved into unit - Moved in 1980 to 1989 (%)
Year householder moved into unit - Moved in 1970 to 1979 (%)
Year householder moved into unit - Moved in 1969 or earlier (%)
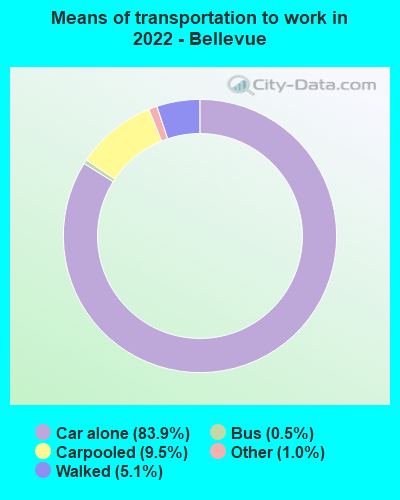
Means of transportation to work - Drove car alone (%)
Means of transportation to work - Carpooled (%)
Means of transportation to work - Public transportation (%)
Means of transportation to work - Bus or trolley bus (%)
Means of transportation to work - Streetcar or trolley car (%)
Means of transportation to work - Subway or elevated (%)
Means of transportation to work - Railroad (%)
Means of transportation to work - Ferryboat (%)
Means of transportation to work - Taxicab (%)
Means of transportation to work - Motorcycle (%)
Means of transportation to work - Bicycle (%)
Means of transportation to work - Walked (%)
Means of transportation to work - Other means (%)
Working at home (%)
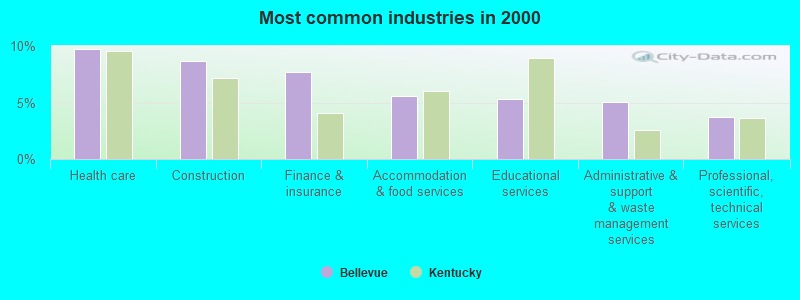
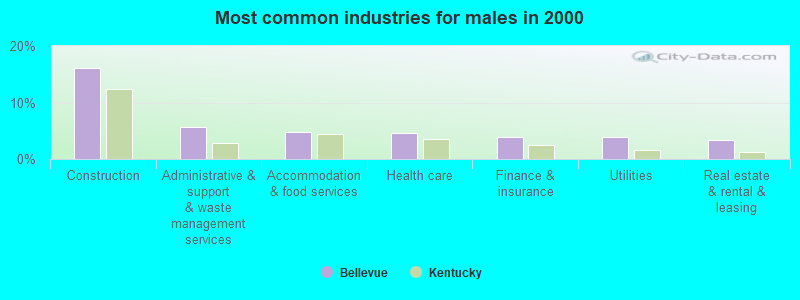
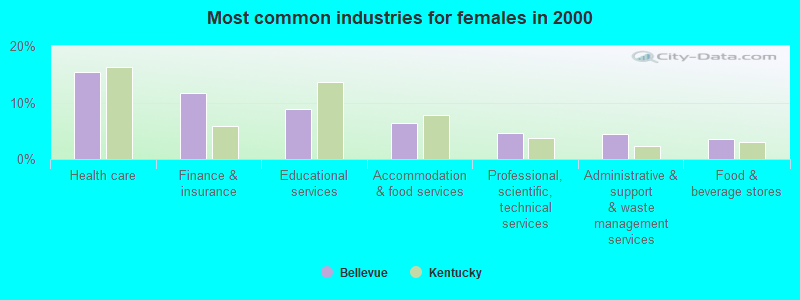
Industry diversity
Most Common Industries - Agriculture, forestry, fishing and hunting, and mining (%)
Most Common Industries - Agriculture, forestry, fishing and hunting (%)
Most Common Industries - Mining, quarrying, and oil and gas extraction (%)
Most Common Industries - Construction (%)
Most Common Industries - Manufacturing (%)
Most Common Industries - Wholesale trade (%)
Most Common Industries - Retail trade (%)
Most Common Industries - Transportation and warehousing, and utilities (%)
Most Common Industries - Transportation and warehousing (%)
Most Common Industries - Utilities (%)
Most Common Industries - Information (%)
Most Common Industries - Finance and insurance, and real estate and rental and leasing (%)
Most Common Industries - Finance and insurance (%)
Most Common Industries - Real estate and rental and leasing (%)
Most Common Industries - Professional, scientific, and management, and administrative and waste management services (%)
Most Common Industries - Professional, scientific, and technical services (%)
Most Common Industries - Management of companies and enterprises (%)
Most Common Industries - Administrative and support and waste management services (%)
Most Common Industries - Educational services, and health care and social assistance (%)
Most Common Industries - Educational services (%)
Most Common Industries - Health care and social assistance (%)
Most Common Industries - Arts, entertainment, and recreation, and accommodation and food services (%)
Most Common Industries - Arts, entertainment, and recreation (%)
Most Common Industries - Accommodation and food services (%)
Most Common Industries - Other services, except public administration (%)
Most Common Industries - Public administration (%)
Occupation diversity
Most Common Occupations - Management, business, science, and arts occupations (%)
Most Common Occupations - Management, business, and financial occupations (%)
Most Common Occupations - Management occupations (%)
Most Common Occupations - Business and financial operations occupations (%)
Most Common Occupations - Computer, engineering, and science occupations (%)
Most Common Occupations - Computer and mathematical occupations (%)
Most Common Occupations - Architecture and engineering occupations (%)
Most Common Occupations - Life, physical, and social science occupations (%)
Most Common Occupations - Education, legal, community service, arts, and media occupations (%)
Most Common Occupations - Community and social service occupations (%)
Most Common Occupations - Legal occupations (%)
Most Common Occupations - Education, training, and library occupations (%)
Most Common Occupations - Arts, design, entertainment, sports, and media occupations (%)
Most Common Occupations - Healthcare practitioners and technical occupations (%)
Most Common Occupations - Health diagnosing and treating practitioners and other technical occupations (%)
Most Common Occupations - Health technologists and technicians (%)
Most Common Occupations - Service occupations (%)
Most Common Occupations - Healthcare support occupations (%)
Most Common Occupations - Protective service occupations (%)
Most Common Occupations - Fire fighting and prevention, and other protective service workers including supervisors (%)
Most Common Occupations - Law enforcement workers including supervisors (%)
Most Common Occupations - Food preparation and serving related occupations (%)
Most Common Occupations - Building and grounds cleaning and maintenance occupations (%)
Most Common Occupations - Personal care and service occupations (%)
Most Common Occupations - Sales and office occupations (%)
Most Common Occupations - Sales and related occupations (%)
Most Common Occupations - Office and administrative support occupations (%)
Most Common Occupations - Natural resources, construction, and maintenance occupations (%)
Most Common Occupations - Farming, fishing, and forestry occupations (%)
Most Common Occupations - Construction and extraction occupations (%)
Most Common Occupations - Installation, maintenance, and repair occupations (%)
Most Common Occupations - Production, transportation, and material moving occupations (%)
Most Common Occupations - Production occupations (%)
Most Common Occupations - Transportation occupations (%)
Most Common Occupations - Material moving occupations (%)
People in Group quarters - Institutionalized population (%)
People in Group quarters - Correctional institutions (%)
People in Group quarters - Federal prisons and detention centers (%)
People in Group quarters - Halfway houses (%)
People in Group quarters - Local jails and other confinement facilities (including police lockups) (%)
People in Group quarters - Military disciplinary barracks (%)
People in Group quarters - State prisons (%)
People in Group quarters - Other types of correctional institutions (%)
People in Group quarters - Nursing homes (%)
People in Group quarters - Hospitals/wards, hospices, and schools for the handicapped (%)
People in Group quarters - Hospitals/wards and hospices for chronically ill (%)
People in Group quarters - Hospices or homes for chronically ill (%)
People in Group quarters - Military hospitals or wards for chronically ill (%)
People in Group quarters - Other hospitals or wards for chronically ill (%)
People in Group quarters - Hospitals or wards for drug/alcohol abuse (%)
People in Group quarters - Mental (Psychiatric) hospitals or wards (%)
People in Group quarters - Schools, hospitals, or wards for the mentally retarded (%)
People in Group quarters - Schools, hospitals, or wards for the physically handicapped (%)
People in Group quarters - Institutions for the deaf (%)
People in Group quarters - Institutions for the blind (%)
People in Group quarters - Orthopedic wards and institutions for the physically handicapped (%)
People in Group quarters - Wards in general hospitals for patients who have no usual home elsewhere (%)
People in Group quarters - Wards in military hospitals for patients who have no usual home elsewhere (%)
People in Group quarters - Juvenile institutions (%)
People in Group quarters - Long-term care (%)
People in Group quarters - Homes for abused, dependent, and neglected children (%)
People in Group quarters - Residential treatment centers for emotionally disturbed children (%)
People in Group quarters - Training schools for juvenile delinquents (%)
People in Group quarters - Short-term care, detention or diagnostic centers for delinquent children (%)
People in Group quarters - Type of juvenile institution unknown (%)
People in Group quarters - Noninstitutionalized population (%)
People in Group quarters - College dormitories (includes college quarters off campus) (%)
People in Group quarters - Military quarters (%)
People in Group quarters - On base (%)
People in Group quarters - Barracks, unaccompanied personnel housing (UPH), (Enlisted/Officer), ;and similar group living quarters for military personnel (%)
People in Group quarters - Transient quarters for temporary residents (%)
People in Group quarters - Military ships (%)
People in Group quarters - Group homes (%)
People in Group quarters - Homes or halfway houses for drug/alcohol abuse (%)
People in Group quarters - Homes for the mentally ill (%)
People in Group quarters - Homes for the mentally retarded (%)
People in Group quarters - Homes for the physically handicapped (%)
People in Group quarters - Other group homes (%)
People in Group quarters - Religious group quarters (%)
People in Group quarters - Dormitories (%)
People in Group quarters - Agriculture workers' dormitories on farms (%)
People in Group quarters - Job Corps and vocational training facilities (%)
People in Group quarters - Other workers' dormitories (%)
People in Group quarters - Crews of maritime vessels (%)
People in Group quarters - Other nonhousehold living situations (%)
People in Group quarters - Other noninstitutional group quarters (%)
Residents speaking English at home (%)
Residents speaking English at home - Born in the United States (%)
Residents speaking English at home - Native, born elsewhere (%)
Residents speaking English at home - Foreign born (%)
Residents speaking Spanish at home (%)
Residents speaking Spanish at home - Born in the United States (%)
Residents speaking Spanish at home - Native, born elsewhere (%)
Residents speaking Spanish at home - Foreign born (%)
Residents speaking other language at home (%)
Residents speaking other language at home - Born in the United States (%)
Residents speaking other language at home - Native, born elsewhere (%)
Residents speaking other language at home - Foreign born (%)
Class of Workers - Employee of private company (%)
Class of Workers - Self-employed in own incorporated business (%)
Class of Workers - Private not-for-profit wage and salary workers (%)
Class of Workers - Local government workers (%)
Class of Workers - State government workers (%)
Class of Workers - Federal government workers (%)
Class of Workers - Self-employed workers in own not incorporated business and Unpaid family workers (%)
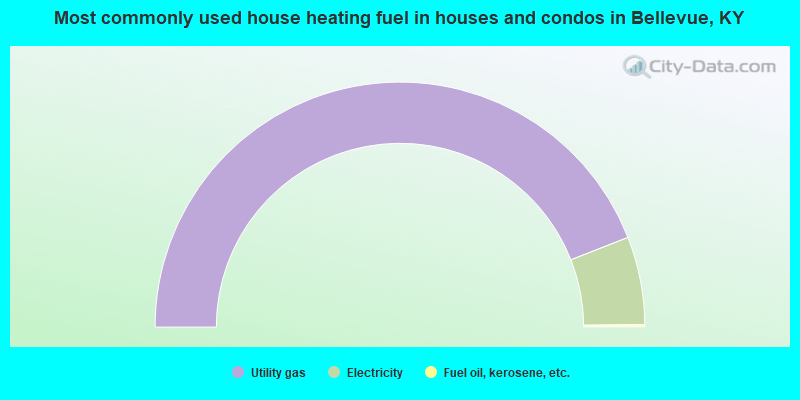
House heating fuel used in houses and condos - Utility gas (%)
House heating fuel used in houses and condos - Bottled, tank, or LP gas (%)
House heating fuel used in houses and condos - Electricity (%)
House heating fuel used in houses and condos - Fuel oil, kerosene, etc. (%)
House heating fuel used in houses and condos - Coal or coke (%)
House heating fuel used in houses and condos - Wood (%)
House heating fuel used in houses and condos - Solar energy (%)
House heating fuel used in houses and condos - Other fuel (%)
House heating fuel used in houses and condos - No fuel used (%)
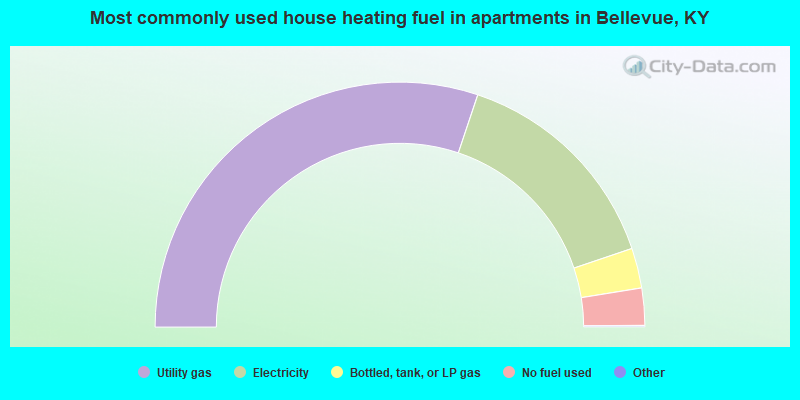
House heating fuel used in apartments - Utility gas (%)
House heating fuel used in apartments - Bottled, tank, or LP gas (%)
House heating fuel used in apartments - Electricity (%)
House heating fuel used in apartments - Fuel oil, kerosene, etc. (%)
House heating fuel used in apartments - Coal or coke (%)
House heating fuel used in apartments - Wood (%)
House heating fuel used in apartments - Solar energy (%)
House heating fuel used in apartments - Other fuel (%)
House heating fuel used in apartments - No fuel used (%)
Armed forces status - In Armed Forces (%)
Armed forces status - Civilian (%)
Armed forces status - Civilian - Veteran (%)
Armed forces status - Civilian - Nonveteran (%)
Fatal accidents locations in years 2005-2021
Fatal accidents locations in 2005
Fatal accidents locations in 2006
Fatal accidents locations in 2007
Fatal accidents locations in 2008
Fatal accidents locations in 2009
Fatal accidents locations in 2010
Fatal accidents locations in 2011
Fatal accidents locations in 2012
Fatal accidents locations in 2013
Fatal accidents locations in 2014
Fatal accidents locations in 2015
Fatal accidents locations in 2016
Fatal accidents locations in 2017
Fatal accidents locations in 2018
Fatal accidents locations in 2019
Fatal accidents locations in 2020
Fatal accidents locations in 2021
Alcohol use - People drinking some alcohol every month (%)
Alcohol use - People not drinking at all (%)
Alcohol use - Average days/month drinking alcohol
Alcohol use - Average drinks/week
Alcohol use - Average days/year people drink much
Audiometry - Average condition of hearing (%)
Audiometry - People that can hear a whisper from across a quiet room (%)
Audiometry - People that can hear normal voice from across a quiet room (%)
Audiometry - Ears ringing, roaring, buzzing (%)
Audiometry - Had a job exposure to loud noise (%)
Audiometry - Had off-work exposure to loud noise (%)
Blood Pressure & Cholesterol - Has high blood pressure (%)
Blood Pressure & Cholesterol - Checking blood pressure at home (%)
Blood Pressure & Cholesterol - Frequently checking blood cholesterol (%)
Blood Pressure & Cholesterol - Has high cholesterol level (%)
Consumer Behavior - Money monthly spent on food at supermarket/grocery store
Consumer Behavior - Money monthly spent on food at other stores
Consumer Behavior - Money monthly spent on eating out
Consumer Behavior - Money monthly spent on carryout/delivered foods
Consumer Behavior - Income spent on food at supermarket/grocery store (%)
Consumer Behavior - Income spent on food at other stores (%)
Consumer Behavior - Income spent on eating out (%)
Consumer Behavior - Income spent on carryout/delivered foods (%)
Current Health Status - General health condition (%)
Current Health Status - Blood donors (%)
Current Health Status - Has blood ever tested for HIV virus (%)
Current Health Status - Left-handed people (%)
Dermatology - People using sunscreen (%)
Diabetes - Diabetics (%)
Diabetes - Had a blood test for high blood sugar (%)
Diabetes - People taking insulin (%)
Diet Behavior & Nutrition - Diet health (%)
Diet Behavior & Nutrition - Milk product consumption (# of products/month)
Diet Behavior & Nutrition - Meals not home prepared (#/week)
Diet Behavior & Nutrition - Meals from fast food or pizza place (#/week)
Diet Behavior & Nutrition - Ready-to-eat foods (#/month)
Diet Behavior & Nutrition - Frozen meals/pizza (#/month)
Drug Use - People that ever used marijuana or hashish (%)
Drug Use - Ever used hard drugs (%)
Drug Use - Ever used any form of cocaine (%)
Drug Use - Ever used heroin (%)
Drug Use - Ever used methamphetamine (%)
Health Insurance - People covered by health insurance (%)
Kidney Conditions-Urology - Avg. # of times urinating at night
Medical Conditions - People with asthma (%)
Medical Conditions - People with anemia (%)
Medical Conditions - People with psoriasis (%)
Medical Conditions - People with overweight (%)
Medical Conditions - Elderly people having difficulties in thinking or remembering (%)
Medical Conditions - People who ever received blood transfusion (%)
Medical Conditions - People having trouble seeing even with glass/contacts (%)
Medical Conditions - People with arthritis (%)
Medical Conditions - People with gout (%)
Medical Conditions - People with congestive heart failure (%)
Medical Conditions - People with coronary heart disease (%)
Medical Conditions - People with angina pectoris (%)
Medical Conditions - People who ever had heart attack (%)
Medical Conditions - People who ever had stroke (%)
Medical Conditions - People with emphysema (%)
Medical Conditions - People with thyroid problem (%)
Medical Conditions - People with chronic bronchitis (%)
Medical Conditions - People with any liver condition (%)
Medical Conditions - People who ever had cancer or malignancy (%)
Mental Health - People who have little interest in doing things (%)
Mental Health - People feeling down, depressed, or hopeless (%)
Mental Health - People who have trouble sleeping or sleeping too much (%)
Mental Health - People feeling tired or having little energy (%)
Mental Health - People with poor appetite or overeating (%)
Mental Health - People feeling bad about themself (%)
Mental Health - People who have trouble concentrating on things (%)
Mental Health - People moving or speaking slowly or too fast (%)
Mental Health - People having thoughts they would be better off dead (%)
Oral Health - Average years since last visit a dentist
Oral Health - People embarrassed because of mouth (%)
Oral Health - People with gum disease (%)
Oral Health - General health of teeth and gums (%)
Oral Health - Average days a week using dental floss/device
Oral Health - Average days a week using mouthwash for dental problem
Oral Health - Average number of teeth
Pesticide Use - Households using pesticides to control insects (%)
Pesticide Use - Households using pesticides to kill weeds (%)
Physical Activity - People doing vigorous-intensity work activities (%)
Physical Activity - People doing moderate-intensity work activities (%)
Physical Activity - People walking or bicycling (%)
Physical Activity - People doing vigorous-intensity recreational activities (%)
Physical Activity - People doing moderate-intensity recreational activities (%)
Physical Activity - Average hours a day doing sedentary activities
Physical Activity - Average hours a day watching TV or videos
Physical Activity - Average hours a day using computer
Physical Functioning - People having limitations keeping them from working (%)
Physical Functioning - People limited in amount of work they can do (%)
Physical Functioning - People that need special equipment to walk (%)
Physical Functioning - People experiencing confusion/memory problems (%)
Physical Functioning - People requiring special healthcare equipment (%)
Prescription Medications - Average number of prescription medicines taking
Preventive Aspirin Use - Adults 40+ taking low-dose aspirin (%)
Reproductive Health - Vaginal deliveries (%)
Reproductive Health - Cesarean deliveries (%)
Reproductive Health - Deliveries resulted in a live birth (%)
Reproductive Health - Pregnancies resulted in a delivery (%)
Reproductive Health - Women breastfeeding newborns (%)
Reproductive Health - Women that had a hysterectomy (%)
Reproductive Health - Women that had both ovaries removed (%)
Reproductive Health - Women that have ever taken birth control pills (%)
Reproductive Health - Women taking birth control pills (%)
Reproductive Health - Women that have ever used Depo-Provera or injectables (%)
Reproductive Health - Women that have ever used female hormones (%)
Sexual Behavior - People 18+ that ever had sex (vaginal, anal, or oral) (%)
Sexual Behavior - Males 18+ that ever had vaginal sex with a woman (%)
Sexual Behavior - Males 18+ that ever performed oral sex on a woman (%)
Sexual Behavior - Males 18+ that ever had anal sex with a woman (%)
Sexual Behavior - Males 18+ that ever had any sex with a man (%)
Sexual Behavior - Females 18+ that ever had vaginal sex with a man (%)
Sexual Behavior - Females 18+ that ever performed oral sex on a man (%)
Sexual Behavior - Females 18+ that ever had anal sex with a man (%)
Sexual Behavior - Females 18+ that ever had any kind of sex with a woman (%)
Sexual Behavior - Average age people first had sex
Sexual Behavior - Average number of female sex partners in lifetime (males 18+)
Sexual Behavior - Average number of female vaginal sex partners in lifetime (males 18+)
Sexual Behavior - Average age people first performed oral sex on a woman (18+)
Sexual Behavior - Average number of woman performed oral sex on in lifetime (18+)
Sexual Behavior - Average number of male sex partners in lifetime (males 18+)
Sexual Behavior - Average number of male anal sex partners in lifetime (males 18+)
Sexual Behavior - Average age people first performed oral sex on a man (18+)
Sexual Behavior - Average number of male oral sex partners in lifetime (18+)
Sexual Behavior - People using protection when performing oral sex (%)
Sexual Behavior - Average number of times people have vaginal or anal sex a year
Sexual Behavior - People having sex without condom (%)
Sexual Behavior - Average number of male sex partners in lifetime (females 18+)
Sexual Behavior - Average number of male vaginal sex partners in lifetime (females 18+)
Sexual Behavior - Average number of female sex partners in lifetime (females 18+)
Sexual Behavior - Circumcised males 18+ (%)
Sleep Disorders - Average hours sleeping at night
Sleep Disorders - People that has trouble sleeping (%)
Smoking-Cigarette Use - People smoking cigarettes (%)
Taste & Smell - People 40+ having problems with smell (%)
Taste & Smell - People 40+ having problems with taste (%)
Taste & Smell - People 40+ that ever had wisdom teeth removed (%)
Taste & Smell - People 40+ that ever had tonsils teeth removed (%)
Taste & Smell - People 40+ that ever had a loss of consciousness because of a head injury (%)
Taste & Smell - People 40+ that ever had a broken nose or other serious injury to face or skull (%)
Taste & Smell - People 40+ that ever had two or more sinus infections (%)
Weight - Average height (inches)
Weight - Average weight (pounds)
Weight - Average BMI
Weight - People that are obese (%)
Weight - People that ever were obese (%)
Weight - People trying to lose weight (%)
According to our research of Kentucky and other state lists, there were 6 registered sex offenders living in Bellevue, Kentucky as of April 24, 2024 . The ratio of all residents to sex offenders in Bellevue is 985 to 1.The ratio of registered sex offenders to all residents in this city is lower than the state average.
Officers per 1,000 residents here:
1.91Kentucky average:
1.89
Latest news from Bellevue, KY collected exclusively by city-data.com from local newspapers, TV, and radio stations
Ancestries: German (42.8%), American (16.5%), English (8.9%), Irish (5.4%), Italian (2.4%), Scottish (2.3%).
Current Local Time:
Incorporated on 03/15/1870
Land area: 0.94 square miles.
Population density: 5,998 people per square mile (average).
70 residents are foreign born
This city:
1.2%Kentucky:
4.1%
Median real estate property taxes paid for housing units with mortgages in 2022: $2,435 (1.1%)Median real estate property taxes paid for housing units with no mortgage in 2022: $2,124 (1.6%)
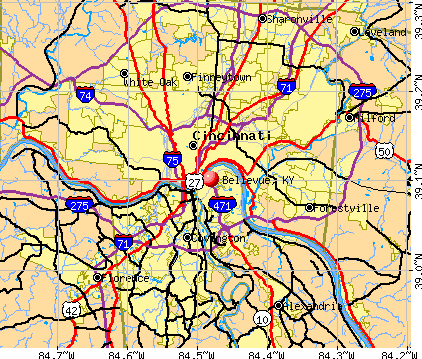
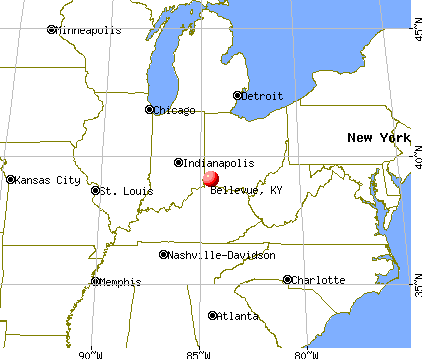
Nearest city with pop. 50,000+: Cincinnati, OH
Nearest city with pop. 1,000,000+: Chicago, IL
Nearest cities:
Latitude: 39.10 N, Longitude: 84.48 W
Daytime population change due to commuting: -1,568 (-28.0%)Workers who live and work in this city: 799 (24.3%)
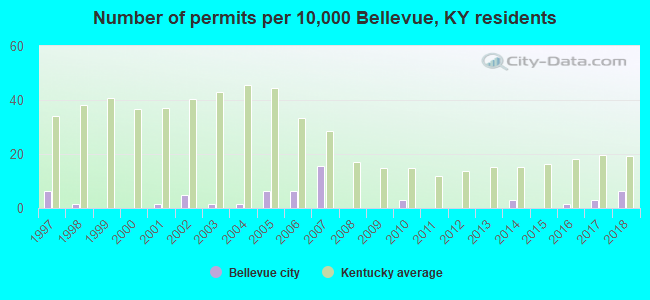
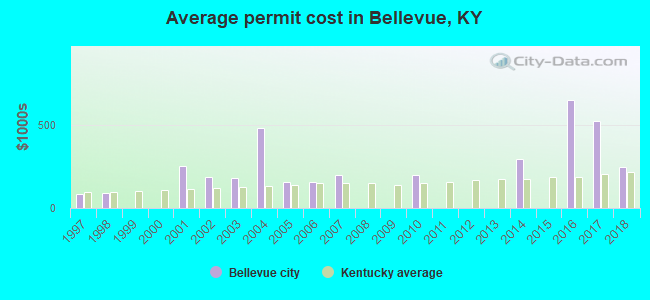
Single-family new house construction building permits:
2018: 4 buildings , average cost: $245,0002017: 2 buildings , average cost: $525,0002016: 1 building , cost: $650,0002014: 2 buildings , average cost: $294,8002010: 2 buildings , average cost: $200,0002007: 10 buildings , average cost: $200,0002006: 4 buildings , average cost: $158,4002005: 4 buildings , average cost: $159,2002004: 1 building , cost: $483,7002003: 1 building , cost: $183,0002002: 3 buildings , average cost: $186,7002001: 1 building , cost: $252,0001998: 1 building , cost: $92,0001997: 4 buildings , average cost: $86,600Unemployment in December 2023:
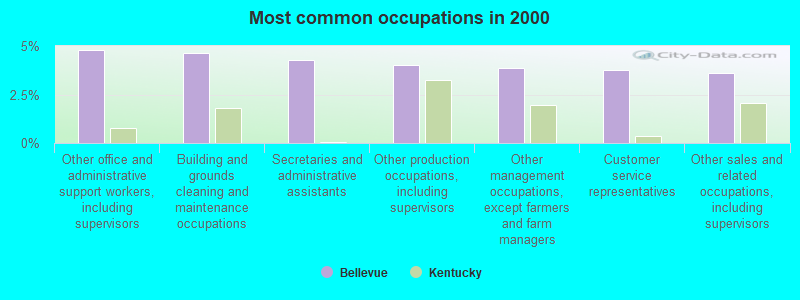
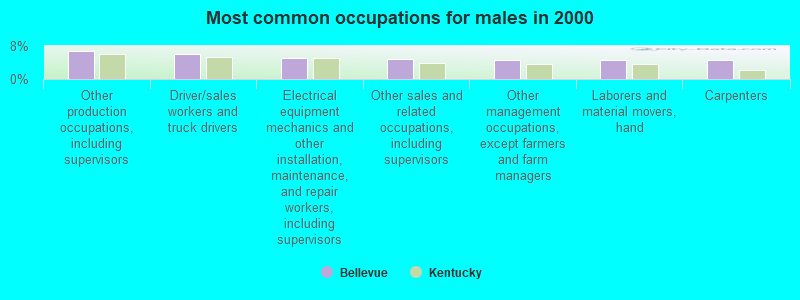
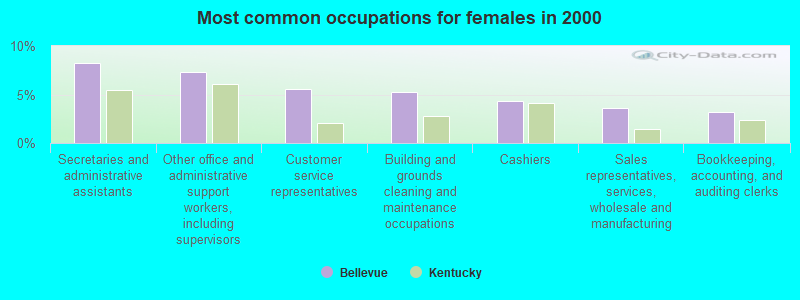
Most common occupations in Bellevue, KY (%)
Both Males Females
Other office and administrative support workers, including supervisors (4.8%)
Building and grounds cleaning and maintenance occupations (4.6%)
Secretaries and administrative assistants (4.3%)
Other production occupations, including supervisors (4.0%)
Other management occupations, except farmers and farm managers (3.9%)
Customer service representatives (3.8%)
Other sales and related occupations, including supervisors (3.6%)
Other production occupations, including supervisors (6.8%)
Driver/sales workers and truck drivers (6.1%)
Electrical equipment mechanics and other installation, maintenance, and repair workers, including supervisors (5.2%)
Other sales and related occupations, including supervisors (4.9%)
Other management occupations, except farmers and farm managers (4.7%)
Laborers and material movers, hand (4.7%)
Carpenters (4.7%)
Secretaries and administrative assistants (8.2%)
Other office and administrative support workers, including supervisors (7.3%)
Customer service representatives (5.6%)
Building and grounds cleaning and maintenance occupations (5.2%)
Cashiers (4.4%)
Sales representatives, services, wholesale and manufacturing (3.6%)
Bookkeeping, accounting, and auditing clerks (3.1%)
Tornado activity:
Bellevue-area historical tornado activity is slightly above Kentucky state average. It is 64% greater than the overall U.S. average.
On 4/3/1974, a category F5 (max. wind speeds 261-318 mph) tornado 11.4 miles away from the Bellevue city center killed 3 people and injured 210 people .
On 4/3/1974, a category F4 (max. wind speeds 207-260 mph) tornado 5.4 miles away from the city center killed 2 people and injured 39 people and caused between $50,000 and $500,000 in damages.
Earthquake activity:
Bellevue-area historical earthquake activity is significantly above Kentucky state average. It is 48% greater than the overall U.S. average. On 7/27/1980 at 18:52:21, a magnitude 5.2 (5.1 MB, 4.7 MS, 5.0 UK, 5.2 UK, Class: Moderate, Intensity: VI - VII) earthquake occurred 68.5 miles away from the city center On 4/18/2008 at 09:36:59, a magnitude 5.4 (5.1 MB, 4.8 MS, 5.4 MW, 5.2 MW) earthquake occurred 189.0 miles away from the city center On 4/18/2008 at 09:36:59, a magnitude 5.2 (5.2 MW, Depth: 8.9 mi) earthquake occurred 189.0 miles away from the city center On 9/7/1988 at 02:28:09, a magnitude 4.6 (4.5 MB, 4.6 LG, Class: Light, Intensity: IV - V) earthquake occurred 73.9 miles away from the city center On 6/10/1987 at 23:48:54, a magnitude 5.1 (4.9 MB, 4.4 MS, 4.6 MS, 5.1 LG) earthquake occurred 184.1 miles away from Bellevue center On 6/18/2002 at 17:37:15, a magnitude 5.0 (4.3 MB, 4.6 MW, 5.0 LG) earthquake occurred 194.4 miles away from the city center Magnitude types: regional Lg-wave magnitude (LG), body-wave magnitude (MB), surface-wave magnitude (MS), moment magnitude (MW) Natural disasters: The number of natural disasters in Campbell County (12) is smaller than the US average (15).Major Disasters (Presidential) Declared: 6Emergencies Declared: 3Floods: 6, Storms: 6, Tornadoes: 3, Winds: 3, Winter Storms: 3, Landslides: 2, Mudslides: 2, Blizzard: 1, Hurricane: 1, Snowfall: 1, Tropical Depression: 1, Other: 1 (Note: some incidents may be assigned to more than one category). Hospitals and medical centers near Bellevue: VISITING NURSE ASSOCIATION OF GREATER CINCINNATI AND (Home Health Center, about 1 miles away; NEWPORT, KY)
LEBRAUN CONV HM (Nursing Home, about 2 miles away; CINCINNATI, OH)
WINDSOR PARK NURSING HOME INC (Nursing Home, about 2 miles away; CINCINNATI, OH)
CHILDREN'S HOSPITAL HOME HEALTH (Home Health Center, about 2 miles away; CINCINNATI, OH)
BYRNES CONVALESCENT CENTER (Nursing Home, about 2 miles away; CINCINNATI, OH)
RES MGT SYSTEMS INC/FRANCISCO (Hospital, about 2 miles away; CINCINNATI, OH)
EMPRESS CONVALESCENT HOME 1 (Nursing Home, about 2 miles away; CINCINNATI, OH)
Amtrak station near Bellevue: 3 miles: CINCINNATI (1301 WESTERN AVE.) Services: ticket office, fully wheelchair accessible, enclosed waiting area, public restrooms, public payphones, full-service food facilities, free short-term parking, paid long-term parking, taxi stand.
College/University in Bellevue: Daymar College-Bellevue Full-time enrollment: 163; Location: 119 Fairfield Avenue; Private, for-profit; Website: www.daymarcollege.edu/)
Colleges/universities with over 2000 students nearest to Bellevue:
University of Cincinnati-Main Campus (about 3 miles; Cincinnati, OH ; Full-time enrollment: 28,747)
Xavier University (about 4 miles; Cincinnati, OH ; FT enrollment: 6,143)
Cincinnati State Technical and Community College (about 5 miles; Cincinnati, OH ; FT enrollment: 8,757)
Northern Kentucky University (about 6 miles; Highland Heights, KY ; FT enrollment: 12,059)
College of Mount St Joseph (about 9 miles; Cincinnati, OH ; FT enrollment: 2,073)
University of Cincinnati-Blue Ash College (about 11 miles; Blue Ash, OH ; FT enrollment: 3,711)
Gateway Community and Technical College (about 13 miles; Florence, KY ; FT enrollment: 2,422)
Public high school in Bellevue:
Public elementary/middle school in Bellevue:
Private elementary/middle school in Bellevue: HOLY TRINITY ELEMENTARY Students: 70, Location: 235 DIVISION ST, Grades: KG-5)
See full list of schools located in Bellevue
Notable location: (A) . Display/hide its location on the map
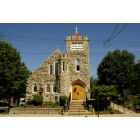
Churches in Bellevue include: (A) , Calvary Methodist Church (B) , Trinity Lutheran Church (C) , Saint John's United Church of Christ (D) , Bellevue Christian Church (E) , Sacred Heart Roman Catholic Church (F) . Display/hide their locations on the map
Hotel:
Birthplace of: Bobby Jones (basketball coach) - Basketball player-coach, Bob Dougherty - Football player, Ed Kennedy (infielder) - Baseball player, Eddie Hunter (baseball) - Baseball player.
Campbell County has a predicted average indoor radon screening level between 2 and 4 pCi/L (pico curies per liter) - Moderate Potential Average household size: This city:
2.2 peopleKentucky:
2.5 people
Percentage of family households: This city:
54.0%Whole state:
66.9%
Percentage of households with unmarried partners: This city:
9.5%Whole state:
6.4%
Likely homosexual households (counted as self-reported same-sex unmarried-partner households)
Lesbian couples: 0.3% of all households Gay men: 0.5% of all households
Banks with branches in Bellevue (2011 data):
Fifth Third Bank: Bellevue Bank Mart Branch at 53 Donnermeyer Drive, branch established on 1994/05/23; Bellevue Branch at 240 Fairfield Avenue, branch established on 1919/01/01. Info updated 2009/10/05: Bank assets: $114,540.4 mil, Deposits: $89,689.1 mil, headquarters in Cincinnati, OH, positive income , Commercial Lending Specialization, 1378 total offices , Holding Company: Fifth Third Bancorp
JPMorgan Chase Bank, National Association: Belleveue Branch at 90 Riviera Drive, branch established on 1959/09/25. Info updated 2011/11/10: Bank assets: $1,811,678.0 mil, Deposits: $1,190,738.0 mil, headquarters in Columbus, OH, positive income , International Specialization, 5577 total offices , Holding Company: Jpmorgan Chase & Co.
Citizens Bank of Northern Kentucky, Inc.: Bellevue Branch at 160 Fairfield Avenue, branch established on 1996/06/03. Info updated 2011/02/10: Bank assets: $255.9 mil, Deposits: $204.6 mil, headquarters in Newport, KY, positive income , Commercial Lending Specialization, 8 total offices , Holding Company: Farmers Capital Bank Corporation
PNC Bank, National Association: Bellevue Branch at 331 Fairfield Avenue, branch established on 1930/01/01. Info updated 2012/03/20: Bank assets: $263,309.6 mil, Deposits: $197,343.0 mil, headquarters in Wilmington, DE, positive income , Commercial Lending Specialization, 3085 total offices , Holding Company: Pnc Financial Services Group, Inc., The
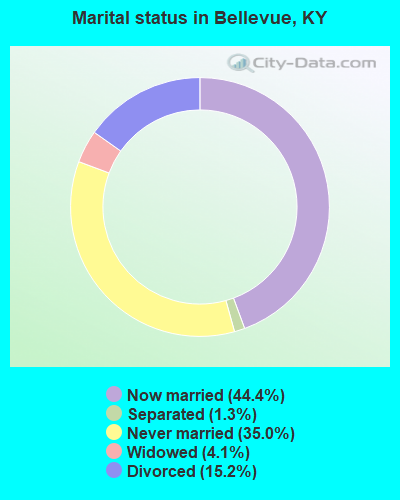
For population 15 years and over in Bellevue:
Never married: 35.0%Now married: 44.4%Separated: 1.3%Widowed: 4.1%Divorced: 15.2% For population 25 years and over in Bellevue:
High school or higher: 95.6%Bachelor's degree or higher: 41.8%Graduate or professional degree: 12.4%Unemployed: 5.4%Mean travel time to work (commute): 19.6 minutes
Education Gini index (Inequality in education) Here:
9.2Kentucky average:
11.7
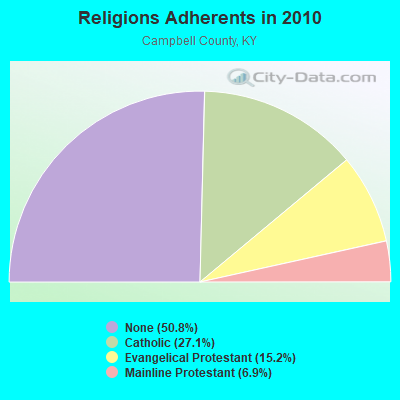
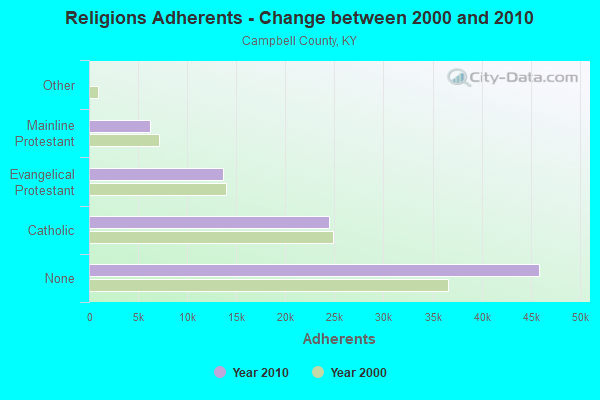
Religion statistics for Bellevue, KY (based on Campbell County data)
Religion Adherents Congregations Catholic 24,500 12 Evangelical Protestant 13,703 52 Mainline Protestant 6,231 23 Other 8 1 None 45,894 -
Source: Clifford Grammich, Kirk Hadaway, Richard Houseal, Dale E.Jones, Alexei Krindatch, Richie Stanley and Richard H.Taylor. 2012. 2010 U.S.Religion Census: Religious Congregations & Membership Study. Association of Statisticians of American Religious Bodies. Jones, Dale E., et al. 2002. Congregations and Membership in the United States 2000. Nashville, TN: Glenmary Research Center. Graphs represent county-level data
Food Environment Statistics: Number of grocery stores : 15Campbell County :
1.73 / 10,000 pop.State :
2.19 / 10,000 pop.
Number of supercenters and club stores : 1Campbell County :
0.12 / 10,000 pop.Kentucky :
0.25 / 10,000 pop.
Number of convenience stores (no gas) : 9Campbell County :
1.04 / 10,000 pop.Kentucky :
0.74 / 10,000 pop.
Number of convenience stores (with gas) : 30This county :
3.46 / 10,000 pop.State :
4.36 / 10,000 pop.
Number of full-service restaurants : 78This county :
8.99 / 10,000 pop.Kentucky :
5.74 / 10,000 pop.
Adult diabetes rate : Campbell County :
9.9%Kentucky :
11.0%
Low-income preschool obesity rate : Campbell County :
8.5%Kentucky :
15.9%
Health and Nutrition:
Average overall health of teeth and gums : This city:
61.4%Kentucky:
47.0%
People feeling badly about themselves : People not drinking alcohol at all : Average hours sleeping at night : Overweight people : This city:
36.0%State:
33.8%
General health condition : Average condition of hearing : Bellevue:
84.2%State:
78.9%
More about Health and Nutrition of Bellevue, KY Residents
Local government employment and payroll (March 2022)
Function
Full-time employees
Monthly full-time payroll
Average yearly full-time wage
Part-time employees
Monthly part-time payroll
Police Protection - Officers
11 $64,496 $70,359 0 $0 Other Government Administration
6 $29,784 $59,568 0 $0 Streets and Highways
4 $14,547 $43,641 0 $0 Police - Other
1 $3,846 $46,152 0 $0 Other and Unallocable
0 $0 1 $385
Totals for Government
22 $112,672 $61,457 1 $385
Bellevue government finances - Expenditure in 2021 (per resident):
Current Operations - Police Protection: $1,035,000 ($183.84)
Central Staff Services: $835,000 ($148.31)Solid Waste Management: $331,000 ($58.79)Regular Highways: $304,000 ($54.00)Housing and Community Development: $121,000 ($21.49)Parks and Recreation: $57,000 ($10.12)Public Welfare - Other: $17,000 ($3.02)General - Interest on Debt: $221,000 ($39.25)
Intergovernmental to Local - Other - General - Other: $1,054,000 ($187.21)
Other Capital Outlay - Regular Highways: $819,000 ($145.47)
Police Protection: $36,000 ($6.39)Total Salaries and Wages: $1,525,000 ($270.87)
Bellevue government finances - Revenue in 2021 (per resident):
Charges - Solid Waste Management: $430,000 ($76.38)
Other: $34,000 ($6.04)Federal Intergovernmental - Other: $172,000 ($30.55)
Highways: $23,000 ($4.09)Housing and Community Development: $7,000 ($1.24)Local Intergovernmental - Highways: $237,000 ($42.10)
Other: $6,000 ($1.07)Miscellaneous - Rents: $127,000 ($22.56)
Sale of Property: $111,000 ($19.72)Fines and Forfeits: $21,000 ($3.73)Interest Earnings: $6,000 ($1.07)State Intergovernmental - Other: $124,000 ($22.02)
Highways: $118,000 ($20.96)Health and Hospitals: $3,000 ($0.53)Tax - Property: $1,827,000 ($324.51)
Individual Income: $1,438,000 ($255.42)Insurance Premiums Sales: $960,000 ($170.52)Occupation and Business License - Other: $210,000 ($37.30)Public Utilities Sales: $209,000 ($37.12)Other License: $41,000 ($7.28)Alcoholic Beverage License: $21,000 ($3.73)
Bellevue government finances - Debt in 2021 (per resident):
Long Term Debt - Outstanding Unspecified Public Purpose: $7,994,000 ($1419.89)
Beginning Outstanding - Unspecified Public Purpose: $7,586,000 ($1347.42)Issue, Unspecified Public Purpose: $3,141,000 ($557.90)Retired Unspecified Public Purpose: $2,733,000 ($485.44)
Bellevue government finances - Cash and Securities in 2021 (per resident):
Other Funds - Cash and Securities: $4,236,000 ($752.40)
Businesses in Bellevue, KY
Name Count Name Count
Arby's 1 Holiday Inn 1 Burger King 1 Kroger 1 Cricket Wireless 1 McDonald's 1 Goodwill 1 Subway 1
Strongest AM radio stations in Bellevue:
WDBZ (1230 AM; 1 kW; CINCINNATI, OH; Owner: BLUE CHIP COMMUNICATIONS, INC.)
WSAI (1530 AM; 50 kW; CINCINNATI, OH; Owner: JACOR BROADCASTING CORPORATION)
WLW (700 AM; 50 kW; CINCINNATI, OH; Owner: JACOR BROADCASTING CORPORATION)
WKRC (550 AM; 5 kW; CINCINNATI, OH; Owner: JACOR BROADCASTING CORPORATION)
WTSJ (1050 AM; 1 kW; CINCINNATI, OH; Owner: CARON BROADCASTING, INC.)
WCIN (1480 AM; 5 kW; CINCINNATI, OH)
WNOP (740 AM; 1 kW; NEWPORT, KY; Owner: SACRED HEART RADIO, INC.)
WCKY (1360 AM; 5 kW; CINCINNATI, OH; Owner: JACOR BROADCASTING CORPORATION)
WCVG (1320 AM; 0 kW; COVINGTON, KY; Owner: RICHARD L. PLESSINGER SR.)
WBOB (1160 AM; 5 kW; FLORENCE, KY; Owner: CARON BROADCASTING, INC.)
WCNW (1560 AM; daytime; 5 kW; FAIRFIELD, OH)
WHAS (840 AM; 50 kW; LOUISVILLE, KY; Owner: CLEAR CHANNEL BROADCASTING LICENSES, INC.)
WTVN (610 AM; 50 kW; COLUMBUS, OH; Owner: CITICASTERS LICENSES, L.P.)
Strongest FM radio stations in Bellevue:
WKRQ (101.9 FM; CINCINNATI, OH; Owner: INFINITY RADIO OPERATIONS INC.)
WKFS (107.1 FM; MILFORD, OH; Owner: JACOR BROADCASTING CORPORATION)
WUBE-FM (105.1 FM; CINCINNATI, OH; Owner: INFINITY RADIO OPERATIONS INC.)
WVXU (91.7 FM; CINCINNATI, OH; Owner: XAVIER UNIVERSITY)
WGUC (90.9 FM; CINCINNATI, OH; Owner: CINCINNATI CLASSICAL PUBLIC RADIO, INC.)
WAIF (88.3 FM; CINCINNATI, OH; Owner: STEPCHILD RADIO OF CINCINNATI, INC.)
WOFX-FM (92.5 FM; CINCINNATI, OH; Owner: JACOR BROADCASTING CORPORATION)
WVMX (94.1 FM; CINCINNATI, OH; Owner: CITICASTERS LICENSES, L.P.)
WEBN (102.7 FM; CINCINNATI, OH; Owner: JACOR BROADCASTING CORPORATION)
WIZF (100.9 FM; ERLANGER, KY; Owner: BLUE CHIP BROADCASTING LICENSES II, LTD.)
WGRR (103.5 FM; HAMILTON, OH; Owner: INFINITY RADIO OPERATIONS INC.)
WRRM (98.5 FM; CINCINNATI, OH; Owner: WRRM LICO, INC)
WNKU (89.7 FM; HIGHLAND HEIGHTS, KY; Owner: BD. OF REGENTS ON N. KY UNIV.)
WAKW (93.3 FM; CINCINNATI, OH; Owner: PILLAR OF FIRE)
WMOJ (94.9 FM; FAIRFIELD, OH; Owner: WVAE LICO, INC.)
WYGY (96.5 FM; LEBANON, OH; Owner: WVAE LICO, INC.)
WMKV (89.3 FM; READING, OH; Owner: LIFESPHERE)
WLHS (89.9 FM; WEST CHESTER, OH; Owner: LAKOTA LOCAL SCHOOL DISTRICT)
WOBO (88.7 FM; BATAVIA, OH; Owner: WCNE EDUCATIONAL COMMUNITY RADIO,INC)
WAQZ (97.3 FM; FORT THOMAS, KY; Owner: INFINITY RADIO OPERATIONS INC.)
TV broadcast stations around Bellevue:
WKRC-TV (Channel 12; CINCINNATI, OH; Owner: CITICASTERS CO.)
WCPO-TV (Channel 9; CINCINNATI, OH; Owner: SCRIPPS HOWARD BROADCASTING COMPANY)
WLWT (Channel 5; CINCINNATI, OH; Owner: OHIO/OKLAHOMA HEARST-ARGYLE TV, INC)
WOTH-LP (Channel 35; CINCINNATI, OH; Owner: ELLIOTT B. BLOCK)
WBQC-CA (Channel 25; CINCINNATI, OH; Owner: ELLIOTT B. BLOCK)
WSTR-TV (Channel 64; CINCINNATI, OH; Owner: WSTR LICENSEE, INC.)
WCET (Channel 48; CINCINNATI, OH; Owner: THE GREATER CINCINNATI TV EDUC'L. FOUNDATION)
WXIX-TV (Channel 19; NEWPORT, KY; Owner: RAYCOM NATIONAL, INC.)
WCVN-TV (Channel 54; COVINGTON, KY; Owner: KENTUCKY AUTHORITY FOR EDUCATIONAL TV)
WPTO (Channel 14; OXFORD, OH; Owner: GREATER DAYTON PUBLIC TELEVISION, INC.)
WKOI (Channel 43; RICHMOND, IN; Owner: TRINITY BROADCASTING OF INDIANA, INC.)
WHIO-TV (Channel 7; DAYTON, OH; Owner: WHIO-TV HOLDINGS, INC.)
WPTD (Channel 16; DAYTON, OH; Owner: GREATER DAYTON PUBLIC TV, INC.)
WKEF (Channel 22; DAYTON, OH; Owner: WKEF LICENSEE L.P.)
WRGT-TV (Channel 45; DAYTON, OH; Owner: WRGT LICENSEE, LLC)
National Bridge Inventory (NBI) Statistics 18 Number of bridges607ft / 185m Total length $37,940,000 Total costs398,480 Total average daily traffic23,818 Total average daily truck traffic
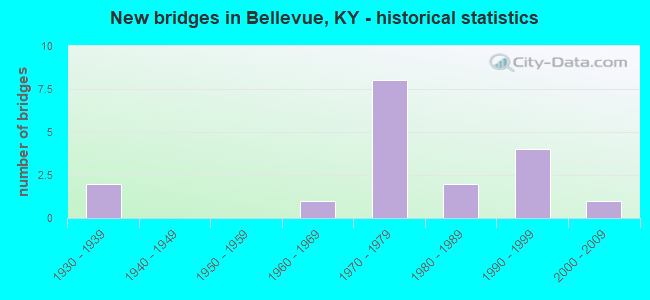
New bridges - historical statistics
2 1930-1939 1 1960-1969 8 1970-1979 2 1980-1989 4 1990-1999 1 2000-2009
See full National Bridge Inventory statistics for Bellevue, KY
FCC Registered Antenna Towers: 10 (
See the full list of FCC Registered Antenna Towers in Bellevue )
FCC Registered Private Land Mobile Towers: 1 (
See the full list of FCC Registered Private Land Mobile Towers in Bellevue, KY )
FCC Registered Broadcast Land Mobile Towers: 9 (
See the full list of FCC Registered Broadcast Land Mobile Towers )
FCC Registered Amateur Radio Licenses: 24 (
See the full list of FCC Registered Amateur Radio Licenses in Bellevue )
FAA Registered Aircraft: 1
Aircraft: EMBRAER-EMPRESA BRASILEIRA DE EMB-500 (Category: Land, Engines: 2, Seats: 6, Weight: Up to 12,499 Pounds), Engine: P&W CANADA PW617F-E (1820 Pounds of Thrust) (Turbo-fan)N-Number: 430TB, N430TB, N-430TB, Serial Number: 50000052, Year manufactured: 2009, Airworthiness Date: 08/24/2009, Certificate Issue Date: 04/09/2020Registrant (LLC): Lpgsc LLC, 301 Eden Ave Unit 4b, Bellevue, KY 41073
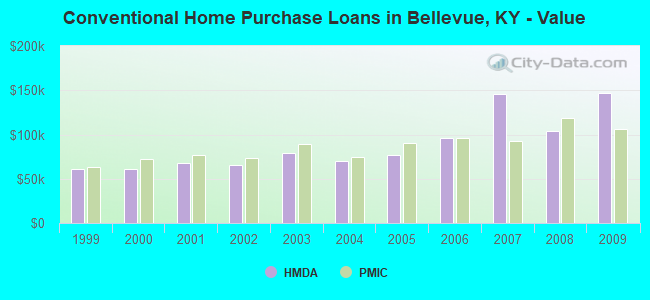
Home Mortgage Disclosure Act Aggregated Statistics For Year 2009(Based on 1 full and 1 partial tracts) A) FHA, FSA/RHS & VA B) Conventional C) Refinancings D) Home Improvement Loans E) Loans on Dwellings For 5+ Families F) Non-occupant Loans on G) Loans On Manufactured Number Average Value Number Average Value Number Average Value Number Average Value Number Average Value Number Average Value Number Average Value
LOANS ORIGINATED 50 $94,509 23 $147,408 119 $94,137 7 $27,129 1 $125,000 14 $95,415 0 $0 APPLICATIONS APPROVED, NOT ACCEPTED 3 $86,807 2 $112,910 10 $96,433 2 $12,000 0 $0 2 $111,845 0 $0 APPLICATIONS DENIED 3 $152,873 4 $209,745 63 $117,094 9 $26,384 0 $0 8 $181,295 1 $2,000 APPLICATIONS WITHDRAWN 1 $85,520 4 $68,472 22 $100,033 1 $13,000 0 $0 1 $71,490 0 $0 FILES CLOSED FOR INCOMPLETENESS 0 $0 0 $0 5 $88,624 1 $6,680 0 $0 0 $0 0 $0
Aggregated Statistics For Year 2008(Based on 1 full and 1 partial tracts) A) FHA, FSA/RHS & VA B) Conventional C) Refinancings D) Home Improvement Loans E) Loans on Dwellings For 5+ Families F) Non-occupant Loans on G) Loans On Manufactured Number Average Value Number Average Value Number Average Value Number Average Value Number Average Value Number Average Value Number Average Value
LOANS ORIGINATED 25 $115,624 41 $103,462 87 $104,289 11 $37,647 2 $122,930 19 $75,392 1 $4,680 APPLICATIONS APPROVED, NOT ACCEPTED 1 $67,480 4 $156,838 9 $174,711 2 $9,000 0 $0 1 $25,000 0 $0 APPLICATIONS DENIED 4 $109,005 7 $174,376 58 $111,665 4 $27,175 0 $0 6 $131,542 1 $14,700 APPLICATIONS WITHDRAWN 2 $114,395 6 $93,815 23 $98,529 1 $28,000 0 $0 0 $0 0 $0 FILES CLOSED FOR INCOMPLETENESS 0 $0 0 $0 2 $382,445 1 $1,340 0 $0 0 $0 0 $0
Aggregated Statistics For Year 2007(Based on 1 full and 1 partial tracts) A) FHA, FSA/RHS & VA B) Conventional C) Refinancings D) Home Improvement Loans E) Loans on Dwellings For 5+ Families F) Non-occupant Loans on G) Loans On Manufactured Number Average Value Number Average Value Number Average Value Number Average Value Number Average Value Number Average Value Number Average Value
LOANS ORIGINATED 13 $102,879 97 $145,697 98 $79,995 17 $47,601 0 $0 38 $84,472 1 $11,360 APPLICATIONS APPROVED, NOT ACCEPTED 2 $74,220 8 $161,192 14 $99,120 3 $47,847 0 $0 2 $101,550 0 $0 APPLICATIONS DENIED 2 $83,000 13 $139,522 73 $91,208 16 $41,728 1 $466,330 12 $92,772 2 $14,500 APPLICATIONS WITHDRAWN 3 $94,280 7 $99,694 23 $93,495 2 $30,680 0 $0 3 $107,440 0 $0 FILES CLOSED FOR INCOMPLETENESS 1 $88,000 0 $0 6 $117,112 1 $13,360 0 $0 0 $0 0 $0
Aggregated Statistics For Year 2006(Based on 1 full and 1 partial tracts) A) FHA, FSA/RHS & VA B) Conventional C) Refinancings D) Home Improvement Loans E) Loans on Dwellings For 5+ Families F) Non-occupant Loans on G) Loans On Manufactured Number Average Value Number Average Value Number Average Value Number Average Value Number Average Value Number Average Value Number Average Value
LOANS ORIGINATED 8 $92,341 115 $96,326 107 $76,633 27 $24,387 3 $311,553 30 $75,573 0 $0 APPLICATIONS APPROVED, NOT ACCEPTED 1 $124,930 16 $51,550 26 $79,060 3 $105,467 0 $0 2 $55,785 0 $0 APPLICATIONS DENIED 0 $0 17 $97,539 81 $90,461 15 $33,567 1 $146,980 5 $98,054 2 $13,525 APPLICATIONS WITHDRAWN 2 $73,725 10 $129,682 34 $87,140 2 $16,510 0 $0 7 $141,557 0 $0 FILES CLOSED FOR INCOMPLETENESS 1 $37,410 5 $115,620 8 $101,096 1 $23,000 0 $0 1 $26,720 0 $0
Aggregated Statistics For Year 2005(Based on 1 full and 1 partial tracts) A) FHA, FSA/RHS & VA B) Conventional C) Refinancings D) Home Improvement Loans F) Non-occupant Loans on G) Loans On Manufactured Number Average Value Number Average Value Number Average Value Number Average Value Number Average Value Number Average Value
LOANS ORIGINATED 16 $89,936 97 $76,474 138 $84,074 18 $38,313 29 $81,067 0 $0 APPLICATIONS APPROVED, NOT ACCEPTED 1 $26,060 14 $56,687 23 $78,624 6 $41,367 2 $82,940 1 $31,400 APPLICATIONS DENIED 2 $86,575 18 $64,883 82 $84,916 21 $30,715 6 $68,565 1 $22,050 APPLICATIONS WITHDRAWN 0 $0 8 $115,470 35 $102,948 3 $77,603 3 $51,220 0 $0 FILES CLOSED FOR INCOMPLETENESS 1 $40,090 4 $56,362 11 $87,029 1 $175,000 1 $34,740 0 $0
Aggregated Statistics For Year 2004(Based on 1 full and 1 partial tracts) A) FHA, FSA/RHS & VA B) Conventional C) Refinancings D) Home Improvement Loans E) Loans on Dwellings For 5+ Families F) Non-occupant Loans on G) Loans On Manufactured Number Average Value Number Average Value Number Average Value Number Average Value Number Average Value Number Average Value Number Average Value
LOANS ORIGINATED 13 $84,108 103 $70,189 157 $77,837 25 $39,474 2 $103,875 40 $72,642 0 $0 APPLICATIONS APPROVED, NOT ACCEPTED 1 $42,760 5 $75,362 25 $79,692 5 $23,974 0 $0 1 $97,540 1 $4,680 APPLICATIONS DENIED 2 $67,930 16 $61,478 80 $79,590 27 $31,791 1 $58,120 9 $44,070 1 $30,730 APPLICATIONS WITHDRAWN 0 $0 8 $89,856 63 $79,323 7 $26,120 0 $0 4 $44,148 0 $0 FILES CLOSED FOR INCOMPLETENESS 1 $52,110 4 $84,848 10 $92,732 1 $24,050 0 $0 1 $47,440 0 $0
Aggregated Statistics For Year 2003(Based on 1 full and 1 partial tracts) A) FHA, FSA/RHS & VA B) Conventional C) Refinancings D) Home Improvement Loans F) Non-occupant Loans on Number Average Value Number Average Value Number Average Value Number Average Value Number Average Value
LOANS ORIGINATED 29 $89,094 86 $78,540 257 $74,876 21 $20,211 42 $61,068 APPLICATIONS APPROVED, NOT ACCEPTED 2 $90,195 6 $78,962 30 $66,737 6 $36,537 3 $51,330 APPLICATIONS DENIED 1 $142,310 11 $89,383 84 $72,888 16 $30,365 7 $76,061 APPLICATIONS WITHDRAWN 4 $72,365 9 $84,414 35 $74,559 0 $0 3 $50,463 FILES CLOSED FOR INCOMPLETENESS 1 $91,000 2 $65,000 16 $81,342 1 $41,420 1 $62,130
Aggregated Statistics For Year 2002(Based on 1 full and 1 partial tracts) A) FHA, FSA/RHS & VA B) Conventional C) Refinancings D) Home Improvement Loans E) Loans on Dwellings For 5+ Families F) Non-occupant Loans on Number Average Value Number Average Value Number Average Value Number Average Value Number Average Value Number Average Value
LOANS ORIGINATED 33 $90,041 82 $65,909 187 $69,475 11 $17,878 2 $107,905 44 $56,332 APPLICATIONS APPROVED, NOT ACCEPTED 2 $97,090 12 $69,852 32 $76,055 1 $670 0 $0 3 $59,907 APPLICATIONS DENIED 3 $75,367 15 $52,922 72 $69,526 15 $14,081 0 $0 6 $46,030 APPLICATIONS WITHDRAWN 4 $94,722 7 $61,047 37 $78,238 2 $25,680 0 $0 3 $78,613 FILES CLOSED FOR INCOMPLETENESS 0 $0 1 $119,590 8 $75,731 1 $73,000 0 $0 0 $0
Aggregated Statistics For Year 2001(Based on 1 full and 1 partial tracts) A) FHA, FSA/RHS & VA B) Conventional C) Refinancings D) Home Improvement Loans F) Non-occupant Loans on Number Average Value Number Average Value Number Average Value Number Average Value Number Average Value
LOANS ORIGINATED 34 $88,719 73 $67,811 170 $67,667 18 $15,202 26 $56,347 APPLICATIONS APPROVED, NOT ACCEPTED 1 $74,830 5 $52,046 39 $59,241 10 $9,177 1 $24,720 APPLICATIONS DENIED 5 $97,200 19 $61,758 80 $63,062 18 $11,204 11 $50,129 APPLICATIONS WITHDRAWN 2 $59,705 7 $54,971 50 $72,178 3 $21,380 4 $50,222 FILES CLOSED FOR INCOMPLETENESS 1 $78,000 3 $65,667 8 $58,194 0 $0 0 $0
Aggregated Statistics For Year 2000(Based on 1 full and 1 partial tracts) A) FHA, FSA/RHS & VA B) Conventional C) Refinancings D) Home Improvement Loans E) Loans on Dwellings For 5+ Families F) Non-occupant Loans on Number Average Value Number Average Value Number Average Value Number Average Value Number Average Value Number Average Value
LOANS ORIGINATED 22 $74,342 71 $60,928 67 $60,585 28 $14,823 1 $179,720 16 $52,011 APPLICATIONS APPROVED, NOT ACCEPTED 1 $90,000 8 $67,635 24 $54,692 21 $12,260 0 $0 4 $40,138 APPLICATIONS DENIED 2 $60,795 21 $54,934 56 $61,369 44 $11,644 0 $0 2 $45,590 APPLICATIONS WITHDRAWN 2 $57,455 8 $60,694 21 $56,985 4 $25,035 0 $0 1 $17,370 FILES CLOSED FOR INCOMPLETENESS 0 $0 1 $49,440 9 $49,393 0 $0 0 $0 0 $0
Aggregated Statistics For Year 1999(Based on 1 full and 1 partial tracts) A) FHA, FSA/RHS & VA B) Conventional C) Refinancings D) Home Improvement Loans E) Loans on Dwellings For 5+ Families F) Non-occupant Loans on Number Average Value Number Average Value Number Average Value Number Average Value Number Average Value Number Average Value
LOANS ORIGINATED 26 $77,625 80 $61,284 137 $56,151 35 $20,209 1 $55,710 27 $51,428 APPLICATIONS APPROVED, NOT ACCEPTED 5 $79,770 11 $49,204 35 $60,903 10 $11,079 0 $0 3 $40,600 APPLICATIONS DENIED 3 $64,680 20 $49,715 65 $56,172 28 $10,890 0 $0 5 $46,720 APPLICATIONS WITHDRAWN 4 $76,415 12 $74,074 36 $54,683 2 $69,355 0 $0 2 $43,135 FILES CLOSED FOR INCOMPLETENESS 1 $45,760 1 $9,950 6 $75,645 1 $4,980 0 $0 0 $0
Detailed HMDA statistics for the following Tracts:
0521.00
, 0522.00
Private Mortgage Insurance Companies Aggregated Statistics For Year 2009(Based on 1 full and 1 partial tracts) A) Conventional B) Refinancings C) Non-occupant Loans on Number Average Value Number Average Value Number Average Value
LOANS ORIGINATED 5 $105,788 6 $94,530 0 $0 APPLICATIONS APPROVED, NOT ACCEPTED 0 $0 0 $0 0 $0 APPLICATIONS DENIED 0 $0 3 $108,653 1 $53,450 APPLICATIONS WITHDRAWN 1 $100,880 1 $136,000 0 $0 FILES CLOSED FOR INCOMPLETENESS 0 $0 0 $0 0 $0
Aggregated Statistics For Year 2008(Based on 1 full and 1 partial tracts) A) Conventional B) Refinancings Number Average Value Number Average Value
LOANS ORIGINATED 18 $118,527 10 $116,855 APPLICATIONS APPROVED, NOT ACCEPTED 3 $108,220 3 $99,827 APPLICATIONS DENIED 1 $70,150 0 $0 APPLICATIONS WITHDRAWN 2 $96,590 1 $131,000 FILES CLOSED FOR INCOMPLETENESS 1 $81,000 0 $0
Aggregated Statistics For Year 2007(Based on 1 full and 1 partial tracts) A) Conventional B) Refinancings C) Non-occupant Loans on Number Average Value Number Average Value Number Average Value
LOANS ORIGINATED 23 $92,554 7 $95,917 4 $76,828 APPLICATIONS APPROVED, NOT ACCEPTED 3 $88,793 1 $151,000 1 $50,110 APPLICATIONS DENIED 1 $43,430 1 $151,000 1 $43,430 APPLICATIONS WITHDRAWN 2 $109,500 3 $154,330 1 $79,000 FILES CLOSED FOR INCOMPLETENESS 0 $0 0 $0 0 $0
Aggregated Statistics For Year 2006(Based on 1 full and 1 partial tracts) A) Conventional B) Refinancings C) Non-occupant Loans on Number Average Value Number Average Value Number Average Value
LOANS ORIGINATED 34 $95,825 8 $96,571 3 $65,753 APPLICATIONS APPROVED, NOT ACCEPTED 2 $57,790 1 $110,900 1 $63,470 APPLICATIONS DENIED 1 $117,000 0 $0 0 $0 APPLICATIONS WITHDRAWN 1 $103,000 0 $0 0 $0 FILES CLOSED FOR INCOMPLETENESS 0 $0 0 $0 0 $0
Aggregated Statistics For Year 2005(Based on 1 full and 1 partial tracts) A) Conventional B) Refinancings C) Non-occupant Loans on Number Average Value Number Average Value Number Average Value
LOANS ORIGINATED 18 $90,638 10 $111,742 4 $122,392 APPLICATIONS APPROVED, NOT ACCEPTED 2 $75,000 6 $124,487 1 $58,790 APPLICATIONS DENIED 0 $0 0 $0 0 $0 APPLICATIONS WITHDRAWN 2 $87,500 1 $62,800 1 $72,000 FILES CLOSED FOR INCOMPLETENESS 0 $0 0 $0 0 $0
Aggregated Statistics For Year 2004(Based on 1 full and 1 partial tracts) A) Conventional B) Refinancings C) Non-occupant Loans on Number Average Value Number Average Value Number Average Value
LOANS ORIGINATED 26 $74,448 14 $84,198 6 $72,642 APPLICATIONS APPROVED, NOT ACCEPTED 2 $80,750 5 $77,696 1 $77,500 APPLICATIONS DENIED 0 $0 0 $0 0 $0 APPLICATIONS WITHDRAWN 0 $0 2 $80,430 1 $31,400 FILES CLOSED FOR INCOMPLETENESS 1 $83,510 0 $0 0 $0
Aggregated Statistics For Year 2003(Based on 1 full and 1 partial tracts) A) Conventional B) Refinancings C) Non-occupant Loans on Number Average Value Number Average Value Number Average Value
LOANS ORIGINATED 23 $89,274 30 $82,660 7 $60,190 APPLICATIONS APPROVED, NOT ACCEPTED 2 $89,770 14 $90,896 1 $40,090 APPLICATIONS DENIED 1 $44,090 2 $101,215 1 $149,650 APPLICATIONS WITHDRAWN 1 $76,000 2 $62,045 0 $0 FILES CLOSED FOR INCOMPLETENESS 0 $0 0 $0 0 $0
Aggregated Statistics For Year 2002(Based on 1 full and 1 partial tracts) A) Conventional B) Refinancings C) Non-occupant Loans on Number Average Value Number Average Value Number Average Value
LOANS ORIGINATED 30 $73,461 24 $84,299 8 $56,361 APPLICATIONS APPROVED, NOT ACCEPTED 5 $65,318 6 $73,110 1 $77,000 APPLICATIONS DENIED 1 $44,760 0 $0 0 $0 APPLICATIONS WITHDRAWN 1 $70,000 1 $56,790 0 $0 FILES CLOSED FOR INCOMPLETENESS 0 $0 1 $52,780 0 $0
Aggregated Statistics For Year 2001(Based on 1 full and 1 partial tracts) A) Conventional B) Refinancings C) Non-occupant Loans on Number Average Value Number Average Value Number Average Value
LOANS ORIGINATED 23 $77,000 23 $88,464 6 $61,973 APPLICATIONS APPROVED, NOT ACCEPTED 0 $0 8 $74,615 1 $78,840 APPLICATIONS DENIED 1 $112,000 1 $96,210 0 $0 APPLICATIONS WITHDRAWN 0 $0 2 $89,000 0 $0 FILES CLOSED FOR INCOMPLETENESS 0 $0 0 $0 0 $0
Aggregated Statistics For Year 2000(Based on 1 full and 1 partial tracts) A) Conventional B) Refinancings C) Non-occupant Loans on Number Average Value Number Average Value Number Average Value
LOANS ORIGINATED 25 $72,568 9 $74,012 3 $47,483 APPLICATIONS APPROVED, NOT ACCEPTED 5 $77,294 3 $87,677 1 $27,390 APPLICATIONS DENIED 0 $0 1 $42,090 0 $0 APPLICATIONS WITHDRAWN 1 $85,000 0 $0 0 $0 FILES CLOSED FOR INCOMPLETENESS 0 $0 0 $0 0 $0
Aggregated Statistics For Year 1999(Based on 1 full and 1 partial tracts) A) Conventional B) Refinancings C) Non-occupant Loans on Number Average Value Number Average Value Number Average Value
LOANS ORIGINATED 26 $62,961 9 $79,151 3 $51,870 APPLICATIONS APPROVED, NOT ACCEPTED 1 $56,750 4 $61,528 0 $0 APPLICATIONS DENIED 3 $61,713 0 $0 0 $0 APPLICATIONS WITHDRAWN 0 $0 1 $57,750 1 $57,750 FILES CLOSED FOR INCOMPLETENESS 1 $58,750 0 $0 1 $58,750
Detailed PMIC statistics for the following Tracts:
0521.00
, 0522.00
Most common first names in Bellevue, KY among deceased individuals Name Count Lived (average)
William 113 73.5 years John 83 73.3 years Mary 68 75.7 years Robert 62 70.6 years Charles 60 75.2 years George 51 73.5 years James 44 65.8 years Anna 42 81.7 years Margaret 41 81.3 years Edward 40 74.0 years
Most common last names in Bellevue, KY among deceased individuals Last name Count Lived (average)
Smith 15 76.6 years Miller 15 75.2 years Moore 14 76.5 years Schmidt 13 72.9 years Schneider 12 77.9 years Egan 12 70.8 years Meyer 10 77.2 years Weber 10 75.8 years Hartman 9 76.2 years Martin 9 74.0 years
Bellevue compared to Kentucky state average:
Unemployed percentage below state average. Black race population percentage significantly below state average. Foreign-born population percentage significantly below state average. Length of stay since moving in significantly above state average. House age significantly above state average. Percentage of population with a bachelor's degree or higher above state average.
#59 on the list of "Top 101 cities with largest percentage of females in occupations: office and administrative support occupations (population 5,000+)"
#60 on the list of "Top 101 cities with the most people walking to work (population 5,000+)"
#64 on the list of "Top 100 cities with oldest houses (pop. 5,000+)"
#95 on the list of "Top 100 cities with old houses but young residents (pop. 5,000+)"
#55 on the list of "Top 101 counties with the lowest Nitrogen Dioxide air pollution readings in 2012 (ppm)"
#93 on the list of "Top 101 counties with the largest decrease in the number of deaths per 1000 residents 2000-2006 to 2007-2013 (pop. 50,000+)"
#97 on the list of "Top 101 counties with the highest Particulate Matter (PM2.5 ) Annual air pollution readings in 2012 (µg/m3 )"
Top Patent Applicants
Michael A. Murray (33)
Hank J. Hundemer (20)
Jessica Elizabeth Leon (6)
John Kling (6)
John H. Kling (3)
Hank Hundemer (3)
Rebecca Ann Seger (3)
Theodore A. Catino (2)
Beverly A. Catino (2)
James R. Poynter (2)
Total of 88 patent applications in 2008-2024.


 Recent articles from our blog. Our writers, many of them Ph.D. graduates or candidates, create easy-to-read articles on a wide variety of topics.

 (2.7 miles
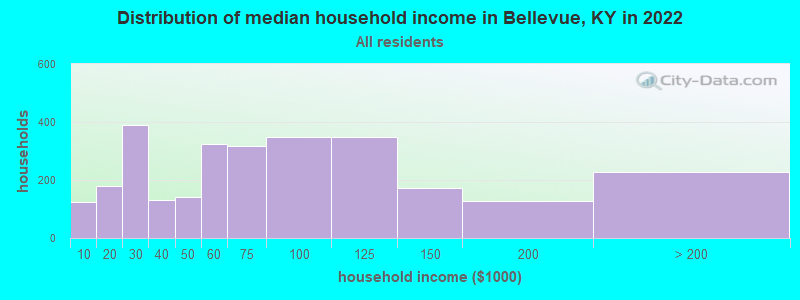


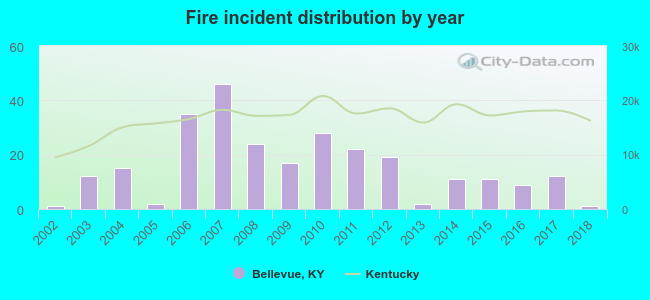 According to the data from the years 2002 - 2018 the average number of fires per year is 16. The highest number of fire incidents - 46 took place in 2007, and the least - 1 in 2002. The data has a constant trend.
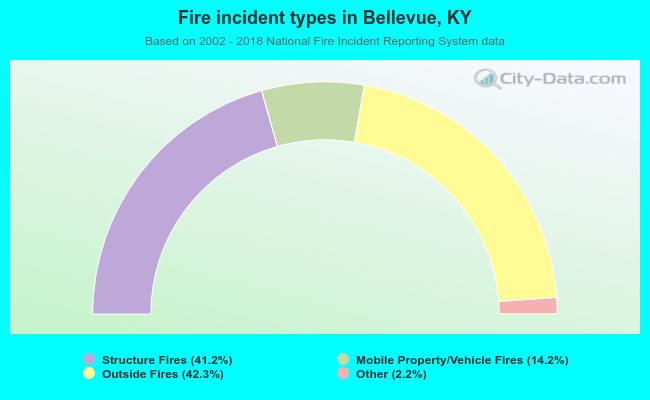 When looking into fire subcategories, the most reports belonged to: Outside Fires (42.3%), and Structure Fires (41.2%).