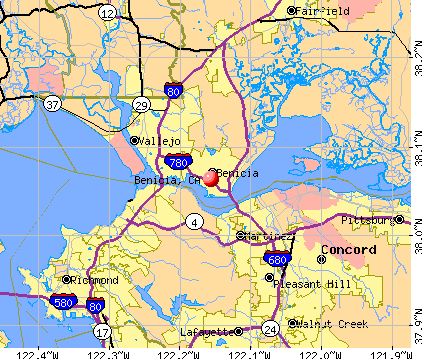
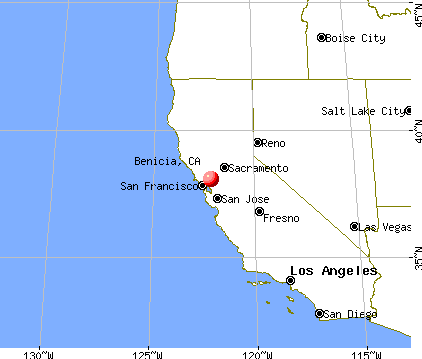
Benicia, California
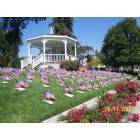
Benicia: Gazebo on First St. Benicia CA
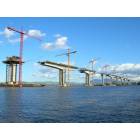
Benicia: Build A Bridge
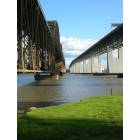
Benicia: New And Old
Benicia: Christmas in Benicia
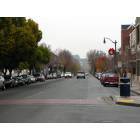
Benicia: Mainstreet, looking north towards Solano Square

Benicia: A look down mainstreet from the top of N Street
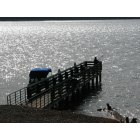
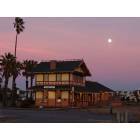
Benicia: Afternoon on the bay
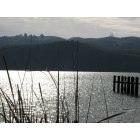
Benicia: High sun on bay.
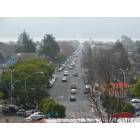
Benicia: First Street view from the top of N Street
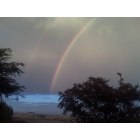
Benicia: This rainbow appeared in the east from my backyard
Benicia: Benicia Glass Blowers Tour
- see
19
more - add
your
Submit your own pictures of this city and show them to the world
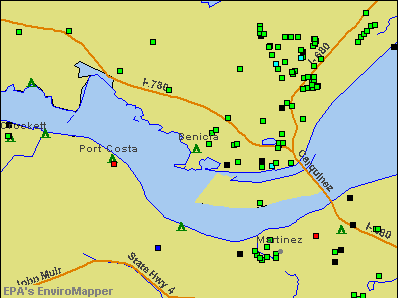
- OSM Map
- General Map
- Google Map
- MSN Map
Population change since 2000: -1.1%
 |
| Males: 12,896 | |
| Females: 13,671 |
| Median resident age: | 45.7 years |
| California median age: | 37.9 years |
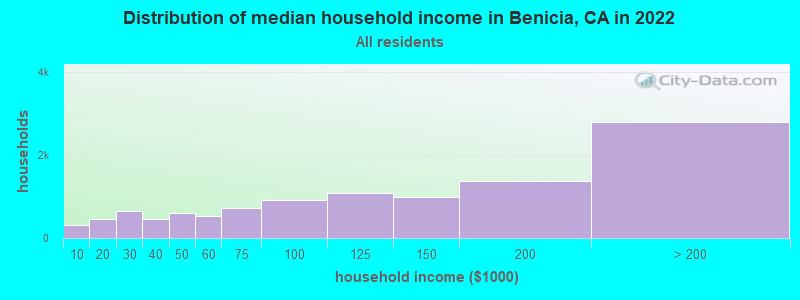
| Benicia: | $119,148 |
| CA: | $91,551 |
Estimated per capita income in 2022: $60,119 (it was $31,226 in 2000)
Benicia city income, earnings, and wages data
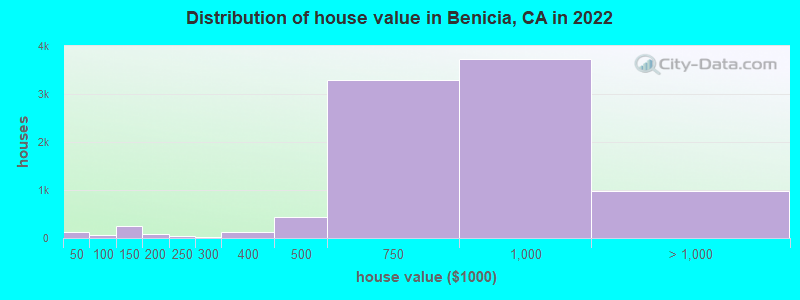
Estimated median house or condo value in 2022: $811,880 (it was $263,100 in 2000)
| Benicia: | $811,880 |
| CA: | $715,900 |
Mean prices in 2022: all housing units: $619,563; detached houses: $642,896; townhouses or other attached units: $488,370; in 2-unit structures: $525,157; in 3-to-4-unit structures: $375,409; in 5-or-more-unit structures: $312,659; mobile homes: $216,206; occupied boats, rvs, vans, etc.: $84,248
Median gross rent in 2022: $2,304.
(4.5% for White Non-Hispanic residents, 30.1% for Black residents, 4.0% for Hispanic or Latino residents, 40.0% for American Indian residents, 5.5% for other race residents, 4.1% for two or more races residents)
Detailed information about poverty and poor residents in Benicia, CA


Compare current foreclosures near Benicia, CA:
| Photo | Address | Area | Beds / Baths | Price | Details |
|---|---|---|---|---|---|

|
#1
Lansing
Benicia, CA 94510
|
- sq. feet
|
4 baths 5 beds |
show details | |

|
#2
Ofarrell Dr
Benicia, CA 94510
|
1,454 sq. feet
|
2 baths 3 beds |
show details | |

|
#3
Lansing Cir
Benicia, CA 94510
|
4,020 sq. feet
|
4 baths 4 beds |
show details | |

|
#4
Southampton Rd Apt 18
Benicia, CA 94510
|
1,226 sq. feet
|
1 baths 3 beds |
show details | |

|
#5
El Bonito Way
Benicia, CA 94510
|
832 sq. feet
|
1 baths 2 beds |
show details | |

|
#6
Saint Francis Ct
Benicia, CA 94510
|
2,923 sq. feet
|
3 baths 4 beds |
show details | |

|
#7
Lori Dr Apt 44
Benicia, CA 94510
|
873 sq. feet
|
2 baths 2 beds |
show details | |

|
#8
Buena Vis
Benicia, CA 94510
|
1,640 sq. feet
|
2 baths 3 beds |
show details | |

|
#9
Steven Cir
Benicia, CA 94510
|
2,052 sq. feet
|
2 baths 3 beds |
show details | |

|
#10
Lori Dr Apt 45
Benicia, CA 94510
|
873 sq. feet
|
2 baths 2 beds |
show details |
| Photo | Address | Area | Beds / Baths | Price | Details |
|---|---|---|---|---|---|

|
#11
Cambridge Dr
Benicia, CA 94510
|
1,346 sq. feet
|
2 baths 2 beds |
show details | |

|
#12
Cambridge Dr Unit 57
Benicia, CA 94510
|
1,087 sq. feet
|
1 baths 2 beds |
show details | |

|
#13
Stuart Ct
Benicia, CA 94510
|
- sq. feet
|
- baths - beds |
show details | |

|
#14
Alta Loma # 1
Benicia, CA 94510
|
- sq. feet
|
- baths - beds |
show details | |

|
#15
Military E
Benicia, CA 94510
|
- sq. feet
|
- baths - beds |
show details | |

|
#16
Riverview Ter Apt 228
Benicia, CA 94510
|
- sq. feet
|
- baths - beds |
show details | |

|
#17
Southampton Rd Ste B170
Benicia, CA 94510
|
- sq. feet
|
- baths - beds |
show details | |

|
#18
Southampton Rd Apt 10
Benicia, CA 94510
|
- sq. feet
|
- baths - beds |
show details | |

|
#19
Warwick Dr Apt 1
Benicia, CA 94510
|
- sq. feet
|
- baths - beds |
show details | |

|
#20
E N St
Benicia, CA 94510
|
- sq. feet
|
- baths - beds |
show details |
| Photo | Address | Area | Beds / Baths | Price | Details |
|---|---|---|---|---|---|

|
#21
Grove Cir
Benicia, CA 94510
|
- sq. feet
|
- baths - beds |
show details | |

|
#22
Shirley Dr
Benicia, CA 94510
|
- sq. feet
|
- baths - beds |
show details | |

|
#23
Limestone Dr
Vallejo, CA 94589
|
1,677 sq. feet
|
2 baths 4 beds |
$609,000
|
show details |

|
#24
Hastings Ave
Vallejo, CA 94589
|
1,104 sq. feet
|
2 baths 3 beds |
$529,000
|
show details |

|
#25
2nd St
Richmond, CA 94801
|
887 sq. feet
|
1 baths 3 beds |
$364,000
|
show details |

|
#26
E 12th St
Pittsburg, CA 94565
|
1,345 sq. feet
|
1 baths 2 beds |
$540,000
|
show details |

|
#27
Mohr Ln Apt C
Concord, CA 94518
|
870 sq. feet
|
1 baths 2 beds |
show details | |

|
#28
El Portal Dr Apt D
San Pablo, CA 94806
|
1,058 sq. feet
|
2 baths 2 beds |
show details | |

|
#29
Kelsey St
Richmond, CA 94801
|
1,080 sq. feet
|
3 baths 4 beds |
show details | |

|
#30
Caldecott Ln
Oakland, CA 94618
|
1,239 sq. feet
|
2 baths 2 beds |
show details |
| Photo | Address | Area | Beds / Baths | Price | Details |
|---|---|---|---|---|---|

|
#31
Mariner Dr
Vallejo, CA 94591
|
848 sq. feet
|
1 baths 2 beds |
show details | |

|
#32
Andrews Cir
Suisun City, CA 94585
|
2,216 sq. feet
|
3 baths 3 beds |
show details | |

|
#33
Dahlia St
Fairfield, CA 94533
|
1,403 sq. feet
|
2 baths 3 beds |
show details | |

|
#34
W Carolyn Dr
American Canyon, CA 94503
|
975 sq. feet
|
1 baths 3 beds |
show details | |

|
#35
Daniels Ave
Vallejo, CA 94590
|
1,782 sq. feet
|
2 baths 4 beds |
show details | |

|
#36
Georgia St
Vallejo, CA 94591
|
868 sq. feet
|
1 baths 2 beds |
show details | |

|
#37
Lincoln Ave
Richmond, CA 94804
|
795 sq. feet
|
1 baths 2 beds |
show details | |

|
#38
Whyte Park Ave
Walnut Creek, CA 94595
|
2,389 sq. feet
|
2 baths 3 beds |
show details | |

|
#39
Denkinger Rd
Concord, CA 94521
|
896 sq. feet
|
1 baths 2 beds |
show details | |

|
#40
Shasta Cir
Pittsburg, CA 94565
|
1,053 sq. feet
|
1 baths 3 beds |
show details |
| Photo | Address | Area | Beds / Baths | Price | Details |
|---|---|---|---|---|---|

|
#41
Steffan St
Vallejo, CA 94591
|
1,965 sq. feet
|
2 baths 3 beds |
show details | |

|
#42
Virginia St
Berkeley, CA 94702
|
1,690 sq. feet
|
2 baths 3 beds |
show details | |

|
#43
Leslie Ave
Martinez, CA 94553
|
1,006 sq. feet
|
1 baths 2 beds |
show details | |

|
#44
Golden Brook Ln
American Canyon, CA 94503
|
1,682 sq. feet
|
2 baths 3 beds |
show details | |

|
#45
Fernwood Ct
Pittsburg, CA 94565
|
1,781 sq. feet
|
2 baths 4 beds |
show details | |

|
#46
Hoover St
Fairfield, CA 94533
|
1,106 sq. feet
|
1 baths 1 beds |
show details | |

|
#47
Bridle Ridge Dr
Fairfield, CA 94534
|
5,067 sq. feet
|
4 baths 5 beds |
show details | |

|
#48
Wyoming St
Fairfield, CA 94533
|
1,254 sq. feet
|
2 baths 3 beds |
show details | |

|
#49
Heide Ct
El Sobrante, CA 94803
|
4,151 sq. feet
|
3 baths 5 beds |
show details | |

|
Check over 1 million property listings on Foreclosure.com!
|
browse all offers | |||


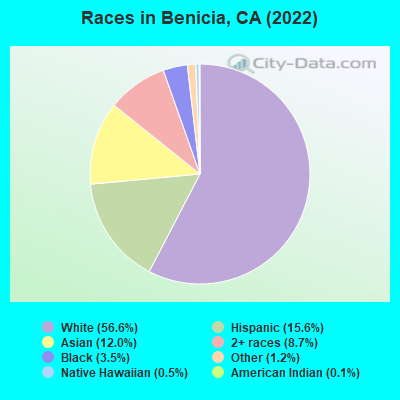
- 15,24156.6%White alone
- 4,20415.6%Hispanic
- 3,22812.0%Asian alone
- 2,3418.7%Two or more races
- 9383.5%Black alone
- 3341.2%Other race alone
- 1260.5%Native Hawaiian and Other
Pacific Islander alone - 360.1%American Indian alone
According to our research of California and other state lists, there were 9 registered sex offenders living in Benicia, California as of April 18, 2024.
The ratio of all residents to sex offenders in Benicia is 3,163 to 1.
The ratio of registered sex offenders to all residents in this city is much lower than the state average.
Type |
2009 |
2010 |
2011 |
2012 |
2013 |
2014 |
2015 |
2016 |
2017 |
2018 |
2019 |
2020 |
2022 |
|---|---|---|---|---|---|---|---|---|---|---|---|---|---|
| Murders (per 100,000) | 0 (0.0) | 1 (3.7) | 1 (3.7) | 0 (0.0) | 0 (0.0) | 0 (0.0) | 0 (0.0) | 0 (0.0) | 0 (0.0) | 0 (0.0) | 0 (0.0) | 0 (0.0) | 2 (7.5) |
| Rapes (per 100,000) | 5 (19.2) | 7 (25.9) | 6 (22.0) | 3 (10.9) | 4 (14.5) | 4 (14.4) | 7 (24.9) | 4 (14.1) | 6 (21.1) | 7 (24.5) | 1 (3.5) | 6 (21.1) | 8 (30.1) |
| Robberies (per 100,000) | 20 (76.7) | 15 (55.6) | 11 (40.3) | 14 (51.0) | 8 (29.0) | 8 (28.8) | 8 (28.4) | 8 (28.2) | 12 (42.3) | 17 (59.6) | 13 (45.7) | 6 (21.1) | 13 (48.9) |
| Assaults (per 100,000) | 23 (88.2) | 27 (100.0) | 22 (80.5) | 20 (72.8) | 18 (65.3) | 14 (50.4) | 14 (49.7) | 7 (24.6) | 10 (35.2) | 10 (35.0) | 2 (7.0) | 13 (45.8) | 20 (75.2) |
| Burglaries (per 100,000) | 140 (536.6) | 136 (503.8) | 144 (527.2) | 156 (568.1) | 134 (486.2) | 145 (522.2) | 112 (397.7) | 141 (496.5) | 129 (454.7) | 71 (248.8) | 72 (252.9) | 63 (222.0) | 67 (251.9) |
| Thefts (per 100,000) | 230 (881.6) | 268 (992.7) | 207 (757.9) | 180 (655.5) | 199 (722.1) | 283 (1,019) | 338 (1,200) | 299 (1,053) | 273 (962.3) | 229 (802.5) | 250 (878.1) | 289 (1,019) | 303 (1,139) |
| Auto thefts (per 100,000) | 47 (180.2) | 67 (248.2) | 58 (212.3) | 54 (196.7) | 50 (181.4) | 56 (201.7) | 62 (220.2) | 100 (352.1) | 70 (246.7) | 82 (287.4) | 55 (193.2) | 48 (169.2) | 63 (236.9) |
| Arson (per 100,000) | 8 (30.7) | 4 (14.8) | 11 (40.3) | 8 (29.1) | 8 (29.0) | 8 (28.8) | 8 (28.4) | 2 (7.0) | 1 (3.5) | 2 (7.0) | 2 (7.0) | 20 (70.5) | 0 (0.0) |
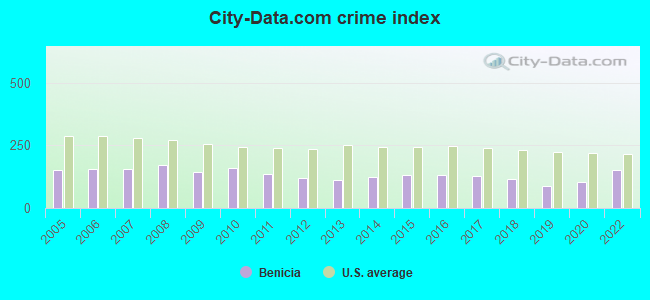
| City-Data.com crime index | 143.2 | 159.6 | 137.3 | 120.3 | 110.8 | 123.7 | 131.8 | 129.7 | 126.7 | 117.0 | 86.2 | 102.2 | 150.9 |
The City-Data.com crime index weighs serious crimes and violent crimes more heavily. Higher means more crime, U.S. average is 246.1. It adjusts for the number of visitors and daily workers commuting into cities.
Crime rate in Benicia detailed stats: murders, rapes, robberies, assaults, burglaries, thefts, arson
Full-time law enforcement employees in 2021, including police officers: 48 (29 officers - 23 male; 6 female).
| Officers per 1,000 residents here: | 1.03 |
| California average: | 2.30 |
 Recent articles from our blog. Our writers, many of them Ph.D. graduates or candidates, create easy-to-read articles on a wide variety of topics.

 | Benicia - an upcoming historic Bay Area town (23 replies) |
| Mispronounced places in California. (82 replies) |
| Best NorCal areas for family, criteria inside (125 replies) |
| Confused - Benicia or Pleasant Hill/Martinez home buyer (5 replies) |
| Relocating and Househunting (48 replies) |
| Tell me about Brentwood, CA (39 replies) |
Latest news from Benicia, CA collected exclusively by city-data.com from local newspapers, TV, and radio stations
Ancestries: Irish (7.1%), English (6.9%), German (5.5%), European (4.3%), Italian (3.8%), American (2.9%).
Current Local Time: PST time zone
Elevation: 33 feet
Land area: 12.9 square miles.
Population density: 2,059 people per square mile (low).
3,735 residents are foreign born (7.0% Asia, 4.6% Latin America, 1.6% Europe).
| This city: | 13.9% |
| California: | 26.5% |
Median real estate property taxes paid for housing units with mortgages in 2022: $5,990 (0.7%)
Median real estate property taxes paid for housing units with no mortgage in 2022: $3,409 (0.4%)
Nearest city with pop. 50,000+: Vallejo, CA  (5.5 miles , pop. 116,760).
Nearest city with pop. 200,000+: Central Contra Costa, CA (11.7 miles , pop. 459,252).
Nearest city with pop. 1,000,000+: Los Angeles, CA (346.8 miles , pop. 3,694,820).
Nearest cities:
), ), Latitude: 38.06 N, Longitude: 122.16 W
Daytime population change due to commuting: +1,515 (+5.6%)
Workers who live and work in this city: 5,040 (39.2%)
Area code: 707
Benicia, California accommodation & food services, waste management - Economy and Business Data
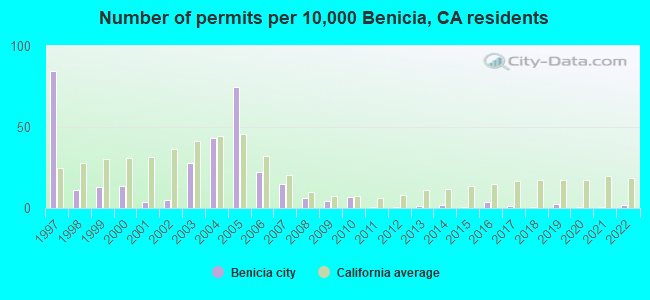
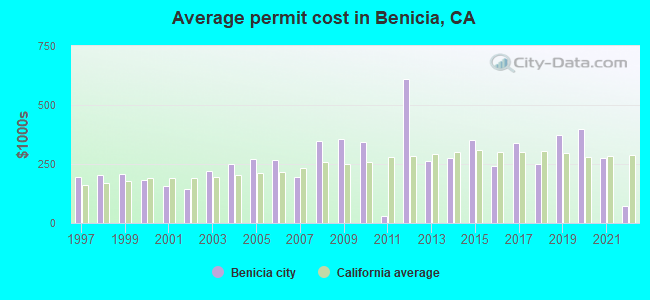
Single-family new house construction building permits:
- 2022: 5 buildings, average cost: $72,200
- 2021: 2 buildings, average cost: $275,900
- 2020: 1 building, cost: $400,000
- 2019: 6 buildings, average cost: $373,300
- 2018: 1 building, cost: $250,000
- 2017: 4 buildings, average cost: $338,800
- 2016: 10 buildings, average cost: $239,600
- 2015: 1 building, cost: $350,000
- 2014: 5 buildings, average cost: $276,000
- 2013: 3 buildings, average cost: $261,700
- 2012: 1 building, cost: $611,800
- 2011: 1 building, cost: $27,900
- 2010: 19 buildings, average cost: $345,200
- 2009: 11 buildings, average cost: $358,200
- 2008: 16 buildings, average cost: $346,500
- 2007: 39 buildings, average cost: $197,200
- 2006: 59 buildings, average cost: $267,700
- 2005: 200 buildings, average cost: $271,300
- 2004: 116 buildings, average cost: $250,100
- 2003: 74 buildings, average cost: $219,200
- 2002: 14 buildings, average cost: $146,000
- 2001: 10 buildings, average cost: $158,400
- 2000: 36 buildings, average cost: $184,100
- 1999: 35 buildings, average cost: $206,200
- 1998: 30 buildings, average cost: $202,100
- 1997: 228 buildings, average cost: $194,900
| Here: | 4.0% |
| California: | 5.1% |
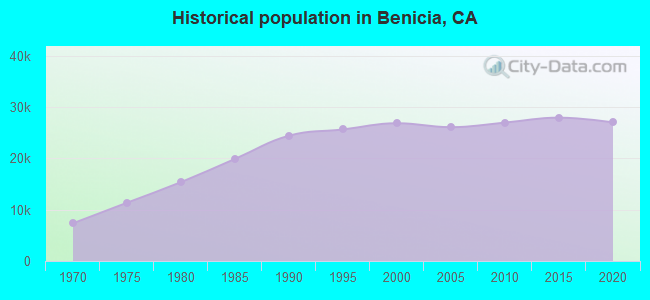
Population change in the 1990s: +2,119 (+8.6%).
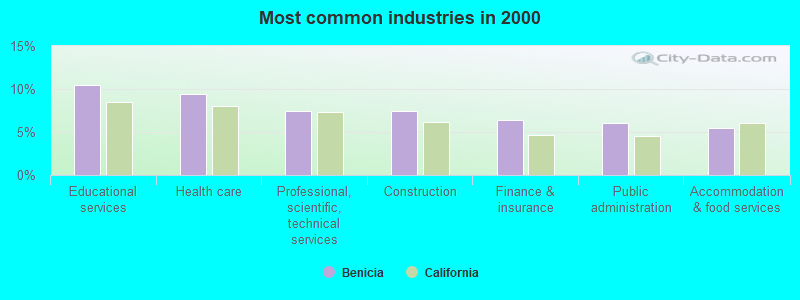
- Educational services (10.5%)
- Health care (9.4%)
- Professional, scientific, technical services (7.4%)
- Construction (7.4%)
- Finance & insurance (6.3%)
- Public administration (6.0%)
- Accommodation & food services (5.4%)
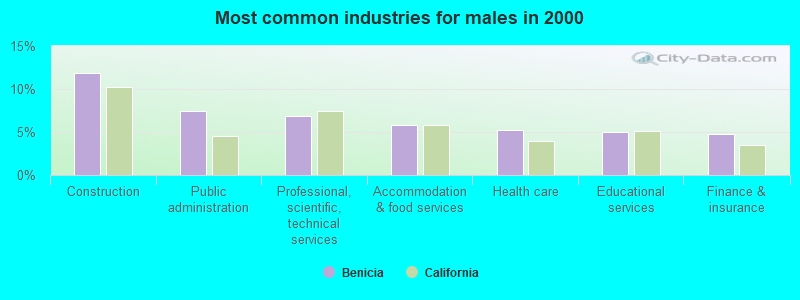
- Construction (11.9%)
- Public administration (7.5%)
- Professional, scientific, technical services (6.8%)
- Accommodation & food services (5.8%)
- Health care (5.2%)
- Educational services (4.9%)
- Finance & insurance (4.8%)
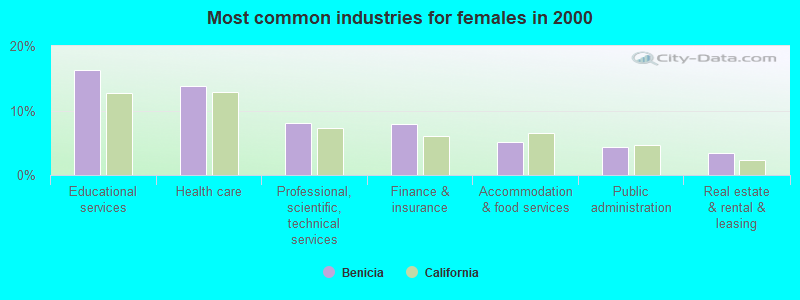
- Educational services (16.3%)
- Health care (13.8%)
- Professional, scientific, technical services (8.1%)
- Finance & insurance (7.9%)
- Accommodation & food services (5.0%)
- Public administration (4.4%)
- Real estate & rental & leasing (3.5%)
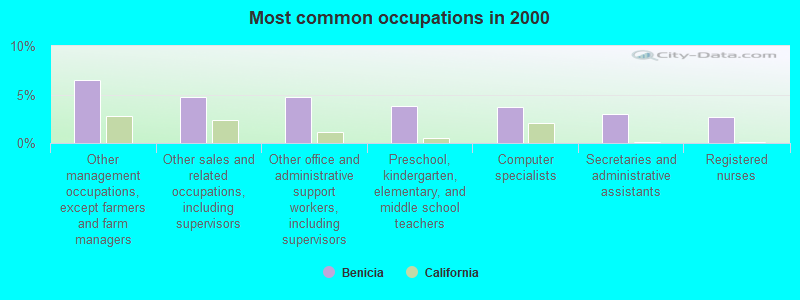
- Other management occupations, except farmers and farm managers (6.5%)
- Other sales and related occupations, including supervisors (4.8%)
- Other office and administrative support workers, including supervisors (4.7%)
- Preschool, kindergarten, elementary, and middle school teachers (3.8%)
- Computer specialists (3.7%)
- Secretaries and administrative assistants (3.0%)
- Registered nurses (2.7%)
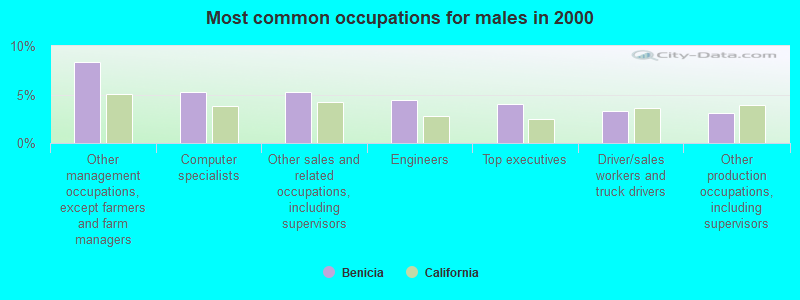
- Other management occupations, except farmers and farm managers (8.3%)
- Computer specialists (5.3%)
- Other sales and related occupations, including supervisors (5.3%)
- Engineers (4.4%)
- Top executives (4.0%)
- Driver/sales workers and truck drivers (3.3%)
- Other production occupations, including supervisors (3.1%)
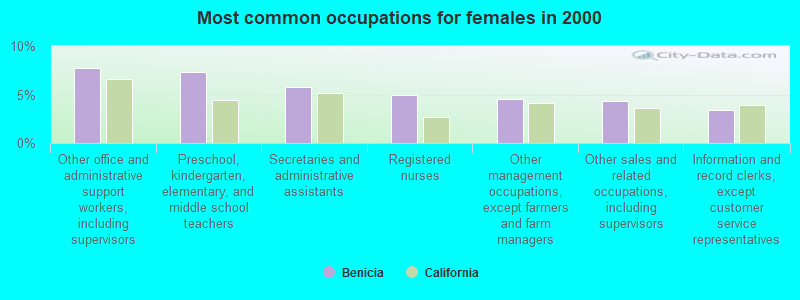
- Other office and administrative support workers, including supervisors (7.7%)
- Preschool, kindergarten, elementary, and middle school teachers (7.3%)
- Secretaries and administrative assistants (5.8%)
- Registered nurses (5.0%)
- Other management occupations, except farmers and farm managers (4.5%)
- Other sales and related occupations, including supervisors (4.3%)
- Information and record clerks, except customer service representatives (3.4%)
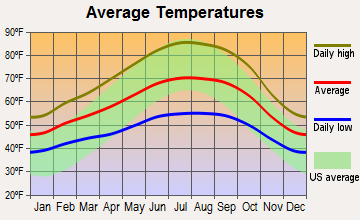
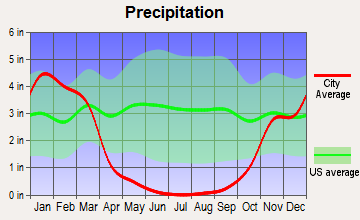
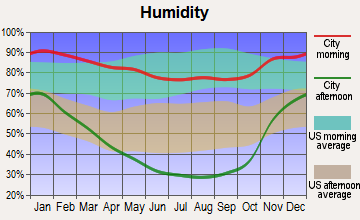
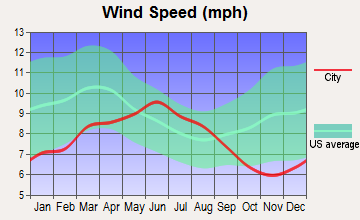
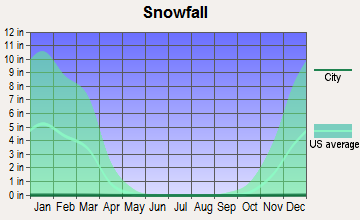
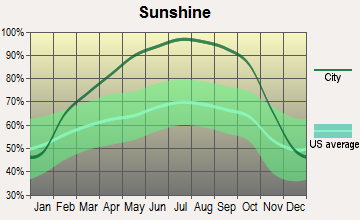
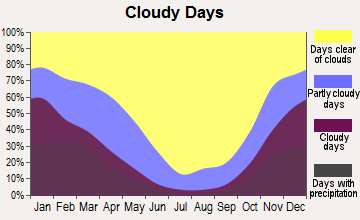
Average climate in Benicia, California
Based on data reported by over 4,000 weather stations
|
|

(lower is better)
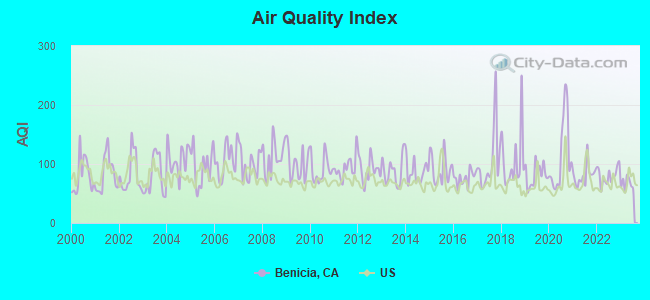
Air Quality Index (AQI) level in 2023 was 66.8. This is about average.
| City: | 66.8 |
| U.S.: | 72.6 |
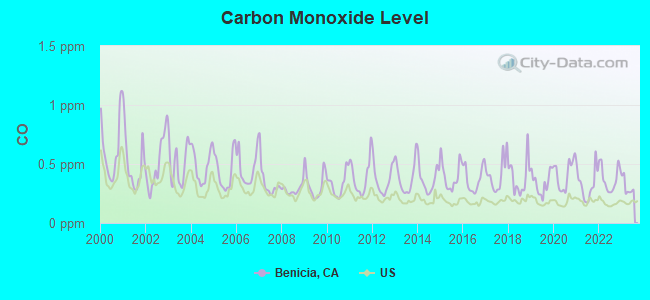
Carbon Monoxide (CO) [ppm] level in 2023 was 0.307. This is worse than average. Closest monitor was 0.3 miles away from the city center.
| City: | 0.307 |
| U.S.: | 0.251 |
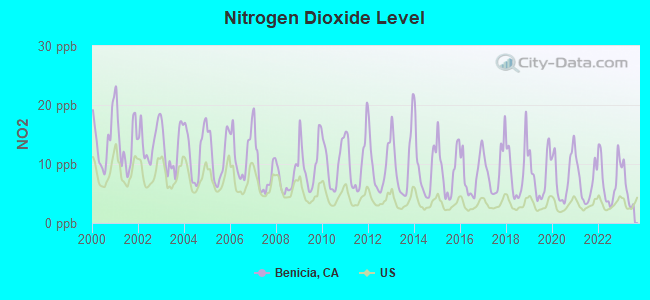
Nitrogen Dioxide (NO2) [ppb] level in 2023 was 5.78. This is about average. Closest monitor was 0.3 miles away from the city center.
| City: | 5.78 |
| U.S.: | 5.11 |
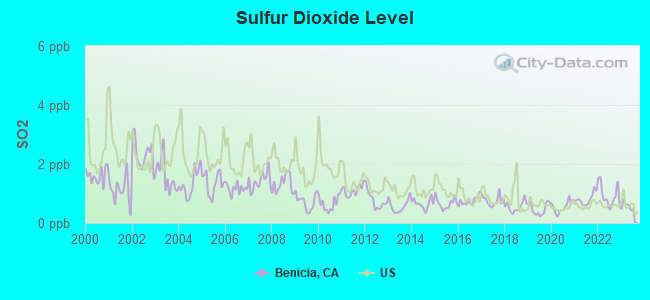
Sulfur Dioxide (SO2) [ppb] level in 2023 was 0.570. This is significantly better than average. Closest monitor was 0.3 miles away from the city center.
| City: | 0.570 |
| U.S.: | 1.515 |
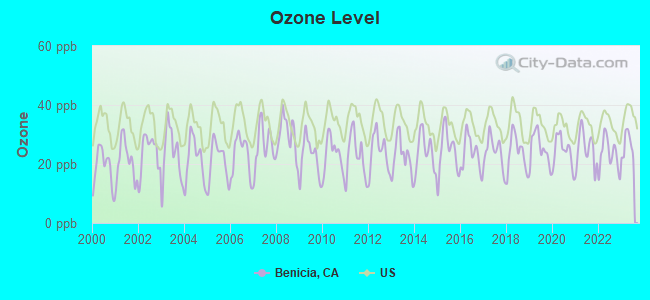
Ozone [ppb] level in 2023 was 26.4. This is better than average. Closest monitor was 0.3 miles away from the city center.
| City: | 26.4 |
| U.S.: | 33.3 |
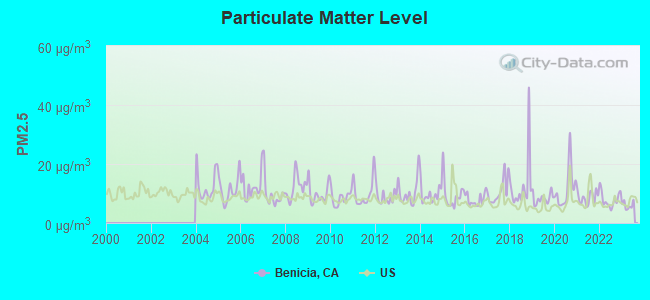
Particulate Matter (PM2.5) [µg/m3] level in 2023 was 5.98. This is better than average. Closest monitor was 5.2 miles away from the city center.
| City: | 5.98 |
| U.S.: | 8.11 |
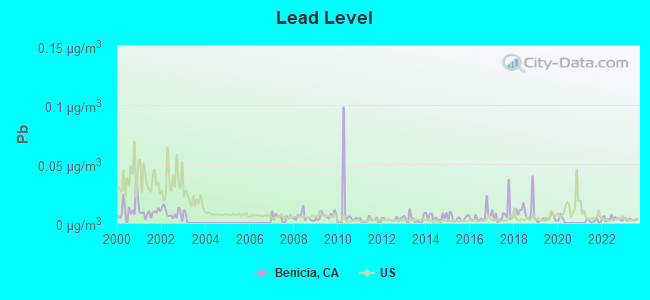
Lead (Pb) [µg/m3] level in 2023 was 0.00290. This is significantly better than average. Closest monitor was 0.3 miles away from the city center.
| City: | 0.00290 |
| U.S.: | 0.00931 |
Earthquake activity:
Benicia-area historical earthquake activity is significantly above California state average. It is 7636% greater than the overall U.S. average.On 4/18/1906 at 13:12:21, a magnitude 7.9 (7.9 UK, Class: Major, Intensity: VIII - XII) earthquake occurred 46.2 miles away from Benicia center, causing $524,000,000 total damage
On 10/18/1989 at 00:04:15, a magnitude 7.1 (6.5 MB, 7.1 MS, 6.9 MW, 7.0 ML) earthquake occurred 69.3 miles away from the city center, causing 62 deaths (62 shaking deaths) and 3757 injuries, causing $1,305,032,704 total damage
On 11/4/1927 at 13:51:53, a magnitude 7.5 (7.5 UK) earthquake occurred 226.6 miles away from Benicia center
On 7/21/1952 at 11:52:14, a magnitude 7.7 (7.7 UK) earthquake occurred 275.0 miles away from the city center, causing $50,000,000 total damage
On 1/31/1922 at 13:17:28, a magnitude 7.6 (7.6 UK) earthquake occurred 257.3 miles away from Benicia center
On 4/25/1992 at 18:06:04, a magnitude 7.2 (6.3 MB, 7.1 MS, 7.2 MW, 7.1 MW, Depth: 9.4 mi) earthquake occurred 188.4 miles away from Benicia center, causing $75,000,000 total damage
Magnitude types: body-wave magnitude (MB), local magnitude (ML), surface-wave magnitude (MS), moment magnitude (MW)
Natural disasters:
The number of natural disasters in Solano County (23) is greater than the US average (15).Major Disasters (Presidential) Declared: 15
Emergencies Declared: 2
Causes of natural disasters: Floods: 13, Storms: 7, Winter Storms: 5, Fires: 4, Mudslides: 4, Landslides: 3, Earthquakes: 2, Drought: 1, Freeze: 1, Heavy Rain: 1, Hurricane: 1, Tornado: 1, Other: 1 (Note: some incidents may be assigned to more than one category).

Hospitals and medical centers in Benicia:
Other hospitals and medical centers near Benicia:
- ALHAMBRA CONV HOSPITAL (Nursing Home, about 5 miles away; MARTINEZ, CA)
- MODIFIED HOME HEALTH SERVICES (Home Health Center, about 5 miles away; VALLEJO, CA)
- CONTRA COSTA REGIONAL MEDICAL CENTER Acute Care Hospitals (about 5 miles away; MARTINEZ, CA)
- HEARTWOOD AVENUE HEALTHCARE (Nursing Home, about 5 miles away; VALLEJO, CA)
- MARY'S HELP HOME HEALTH SERVICES, INC (Home Health Center, about 5 miles away; VALLEJO, CA)
- GREENFIELDS I ICF-DDN (Hospital, about 5 miles away; VALLEJO, CA)
- TWIN RESIDENTIAL (Hospital, about 5 miles away; VALLEJO, CA)
Amtrak stations near Benicia:
- 4 miles: MARTINEZ (401 FERRY ST.) . Services: ticket office, fully wheelchair accessible, enclosed waiting area, public restrooms, public payphones, full-service food facilities, free short-term parking, free long-term parking, call for taxi service, public transit connection.
- 7 miles: VALLEJO-MARINE WORLD (VALLEJO, 1000 FAIRGROUNDS DR.) - Bus Station . Services: fully wheelchair accessible, public restrooms, public payphones, snack bar, free short-term parking, free long-term parking, call for taxi service.
- 14 miles: RICHMOND (16TH ST. & MACDONALD AVE.) . Services: fully wheelchair accessible, enclosed waiting area, public restrooms, public payphones, free short-term parking, call for taxi service, public transit connection.
Colleges/universities with over 2000 students nearest to Benicia:
- Diablo Valley College (about 9 miles; Pleasant Hill, CA; Full-time enrollment: 13,015)
- Solano Community College (about 13 miles; Fairfield, CA; FT enrollment: 5,790)
- Contra Costa College (about 13 miles; San Pablo, CA; FT enrollment: 4,249)
- University of California-Berkeley (about 15 miles; Berkeley, CA; FT enrollment: 37,127)
- Berkeley City College (about 15 miles; Berkeley, CA; FT enrollment: 3,146)
- Saint Mary's College of California (about 16 miles; Moraga, CA; FT enrollment: 4,200)
- Napa Valley College (about 16 miles; Napa, CA; FT enrollment: 3,780)
Public high schools in Benicia:
- BENICIA HIGH (Students: 1,211, Location: 1101 MILITARY W., Grades: 9-12)
- COMMUNITY DAY (Students: 9, Location: 426 E. K ST., Grades: 7-12)
- LIBERTY HIGH (Location: 351 E. J ST., Grades: 9-12)
Public elementary/middle schools in Benicia:
- BENICIA MIDDLE (Students: 1,185, Location: 1100 S.AMPTON RD., Grades: 6-8)
- JOE HENDERSON ELEMENTARY (Students: 389, Location: 650 HASTINGS DR., Grades: KG-5)
- MATTHEW TURNER ELEMENTARY (Students: 327, Location: 540 ROSE DR., Grades: KG-5)
- MARY FARMAR ELEMENTARY (Students: 318, Location: 901 MILITARY W., Grades: KG-5)
- ROBERT SEMPLE ELEMENTARY (Students: 275, Location: 2015 E. THIRD ST., Grades: KG-5)
Private elementary/middle school in Benicia:
User-submitted facts and corrections:
- Mills School is closed
Points of interest:
Notable locations in Benicia: Port of Benicia (A), Johannsens Square (B), Benicia Industrial Park (C), Fischer-Hanlon House (D), Benicia Public Library (E), Benicia City Hall (F), Benicia Fire Department Station 2 (G), Valero Fire Department (H), Benicia Fire Department Station 1 (I), Benicia Capitol State Historical Monument (J). Display/hide their locations on the map
Shopping Centers: Solano Square Shopping Center (1), Parkway Plaza Shopping Center (2), Southampton Shopping Center (3). Display/hide their locations on the map
Churches in Benicia include: Saint Pauls Episcopal Church (A), King Solomon Missionary Baptist Church (B), Benicia Lutheran Church (C), Church of Christ (D), Community Congregational Church (E), First Baptist Church (F), Heritage Presbyterian Church (G), Kingdom Hall of Jehovahs Witnesses (H), Northgate Christian Church (I). Display/hide their locations on the map
Cemeteries: Benicia City Cemetery (1), Saint Dominics Cemetery (2), Military Cemetery (3). Display/hide their locations on the map
Reservoirs: Puddy Lake (A), Pine Lake (B), Lake Herman (C). Display/hide their locations on the map
Creek: Sulphur Springs Creek (A). Display/hide its location on the map
Parks in Benicia include: Benicia State Recreation Area (1), Duncan Graham Park (2), Francesca Terrace Park (3), Ninth Street Park (4), Southampton Park (5), Twelfth Street Park (6), Willow Park (7), Benicia Capitol State Historic Park (8), Fitzgerald Field (9). Display/hide their locations on the map
Tourist attraction: Benicia Volunteer Firemen (Museums; 900 East 2nd Street).
Hotel: Benicia Motel (808 East 5th Street).
Birthplace of: Edward Otho Cresap Ord, II - Indian Wars, Robert Arneson - Artist, Wilson Mizner - Dramatists and playwright, Billy Janniro - Speedway rider.
Drinking water stations with addresses in Benicia and their reported violations in the past:
MORADA CHEVRON FAST N EASY #60* (Population served: 200, Groundwater):Past health violations:Past monitoring violations:
- MCL, Monthly (TCR) - In AUG-2013, Contaminant: Coliform. Follow-up actions: St Public Notif requested (SEP-03-2013), St Compliance achieved (SEP-27-2013)
- MCL, Monthly (TCR) - In FEB-2012, Contaminant: Coliform. Follow-up actions: St Public Notif requested (FEB-01-2012), St Compliance achieved (FEB-01-2012)
- MCL, Monthly (TCR) - In JUL-2010, Contaminant: Coliform. Follow-up actions: St Public Notif requested (JUL-01-2010)
- MCL, Monthly (TCR) - In JUN-2010, Contaminant: Coliform. Follow-up actions: St Public Notif requested (JUL-10-2010)
- MCL, Monthly (TCR) - In NOV-2007, Contaminant: Coliform
- MCL, Monthly (TCR) - In NOV-2007, Contaminant: Coliform. Follow-up actions: St Public Notif requested (NOV-01-2007)
- 10 other older health violations
- 4 routine major monitoring violations
Drinking water stations with addresses in Benicia that have no violations reported:
- CITY OF BENICIA (Population served: 28,000, Primary Water Source Type: Surface water)
| This city: | 2.5 people |
| California: | 2.9 people |
| This city: | 69.4% |
| Whole state: | 68.7% |
| This city: | 6.4% |
| Whole state: | 7.2% |
Likely homosexual households (counted as self-reported same-sex unmarried-partner households)
- Lesbian couples: 0.5% of all households
- Gay men: 0.4% of all households
People in group quarters in Benicia in 2010:
- 17 people in residential treatment centers for adults
- 5 people in group homes intended for adults
- 4 people in maritime/merchant vessels
People in group quarters in Benicia in 2000:
- 27 people in nursing homes
- 23 people in homes or halfway houses for drug/alcohol abuse
- 4 people in other nonhousehold living situations
Banks with branches in Benicia (2011 data):
- Bank of America, National Association: Benicia Branch at 70 Solano Square, branch established on 1927/02/19. Info updated 2009/11/18: Bank assets: $1,451,969.3 mil, Deposits: $1,077,176.8 mil, headquarters in Charlotte, NC, positive income, 5782 total offices, Holding Company: Bank Of America Corporation
- Bank of the West: Benicia Branch at 1001 First Street, branch established on 1987/03/18. Info updated 2009/11/16: Bank assets: $62,408.3 mil, Deposits: $43,995.2 mil, headquarters in San Francisco, CA, positive income, 647 total offices, Holding Company: Bnp Paribas
- Umpqua Bank: Benicia Branch at 1395 East Second Street, branch established on 2000/07/19. Info updated 2011/09/02: Bank assets: $11,556.7 mil, Deposits: $9,325.3 mil, headquarters in Roseburg, OR, positive income, Commercial Lending Specialization, 193 total offices, Holding Company: Umpqua Holdings Corporation
- JPMorgan Chase Bank, National Association: Benicia Branch at 802 Southampton Rd, branch established on 2008/09/25. Info updated 2011/11/10: Bank assets: $1,811,678.0 mil, Deposits: $1,190,738.0 mil, headquarters in Columbus, OH, positive income, International Specialization, 5577 total offices, Holding Company: Jpmorgan Chase & Co.
- U.S. Bank National Association: Benicia Branch at 848 Southampton Road, branch established on 1975/10/31. Info updated 2012/01/30: Bank assets: $330,470.8 mil, Deposits: $236,091.5 mil, headquarters in Cincinnati, OH, positive income, 3121 total offices, Holding Company: U.S. Bancorp
- Wells Fargo Bank, National Association: Benica Branch at 890 Southampton Road, branch established on 1994/08/15. Info updated 2011/04/05: Bank assets: $1,161,490.0 mil, Deposits: $905,653.0 mil, headquarters in Sioux Falls, SD, positive income, 6395 total offices, Holding Company: Wells Fargo & Company
- Westamerica Bank: Benicia Branch at 20 Solano Square, branch established on 1969/09/30. Info updated 2011/06/21: Bank assets: $4,998.1 mil, Deposits: $4,253.2 mil, headquarters in San Rafael, CA, positive income, Commercial Lending Specialization, 98 total offices, Holding Company: Westamerica Bancorporation
For population 15 years and over in Benicia:
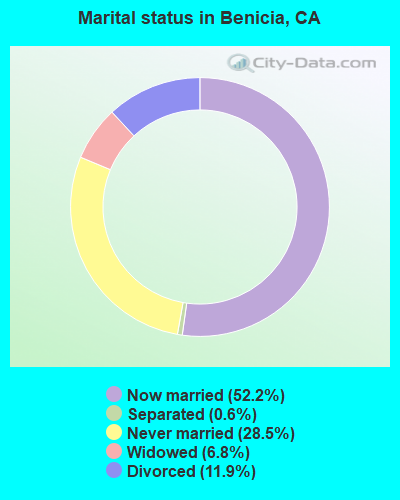
- Never married: 28.5%
- Now married: 52.2%
- Separated: 0.6%
- Widowed: 6.8%
- Divorced: 11.9%
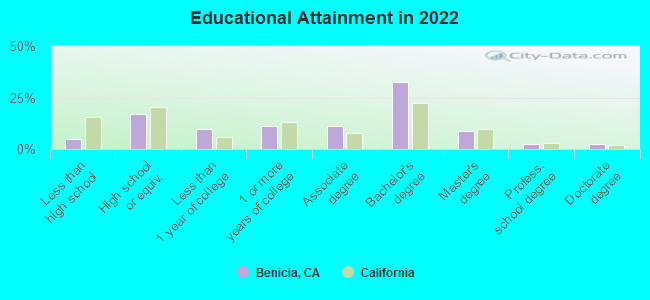
For population 25 years and over in Benicia:
- High school or higher: 95.4%
- Bachelor's degree or higher: 45.7%
- Graduate or professional degree: 14.7%
- Unemployed: 3.7%
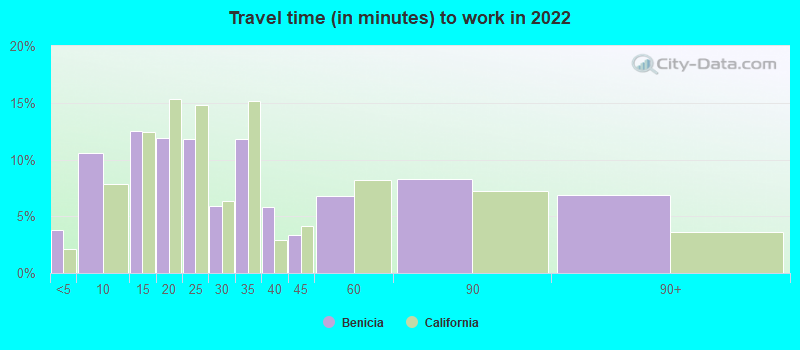
- Mean travel time to work (commute): 25.4 minutes
| Here: | 9.8 |
| California average: | 15.5 |
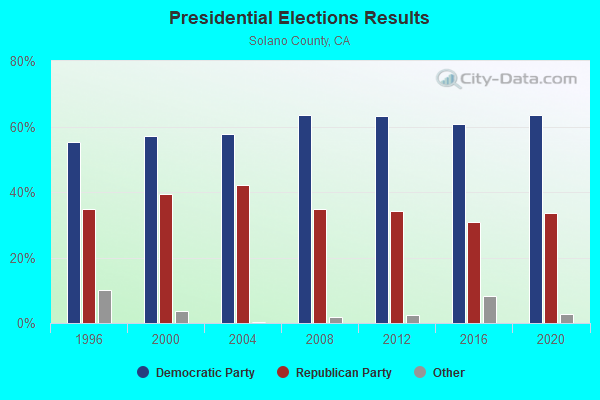
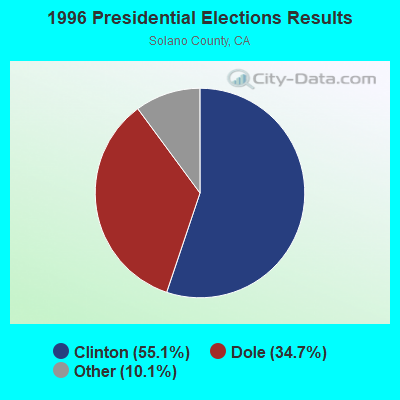
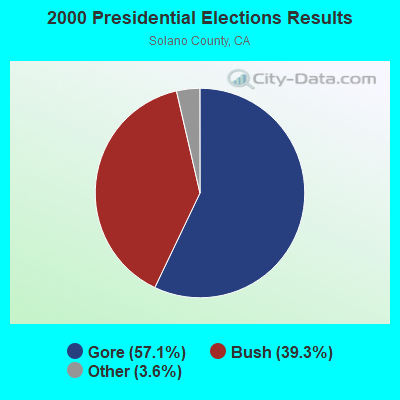
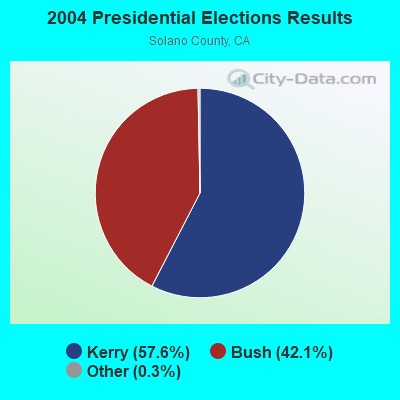
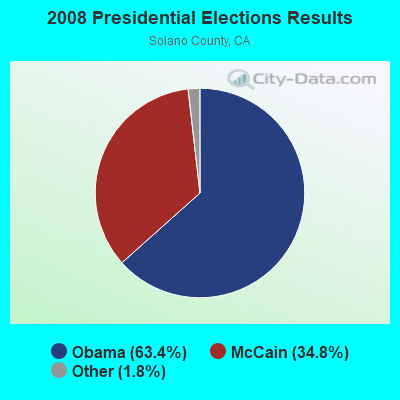
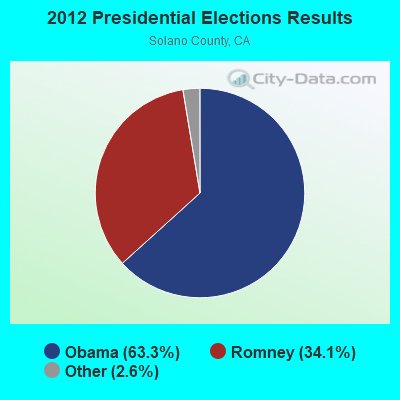
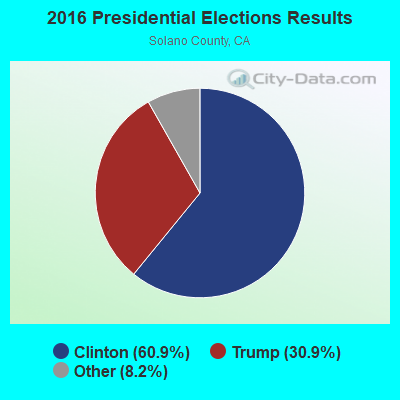
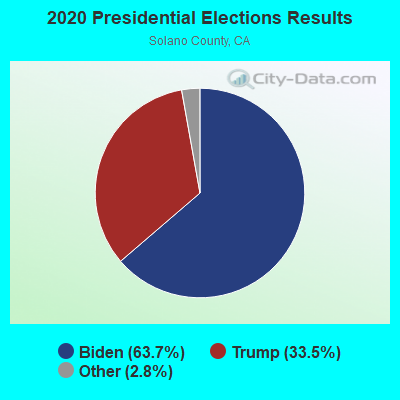
Graphs represent county-level data. Detailed 2008 Election Results
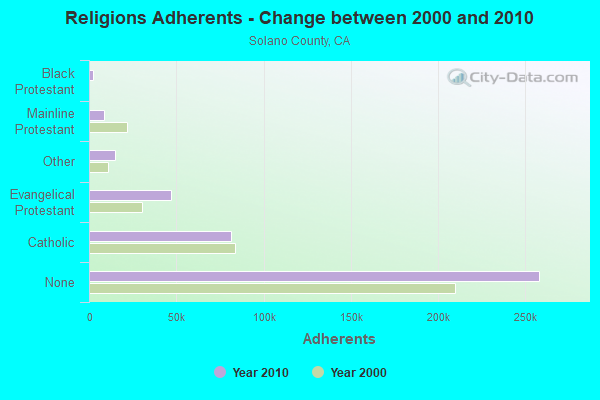
Religion statistics for Benicia, CA (based on Solano County data)
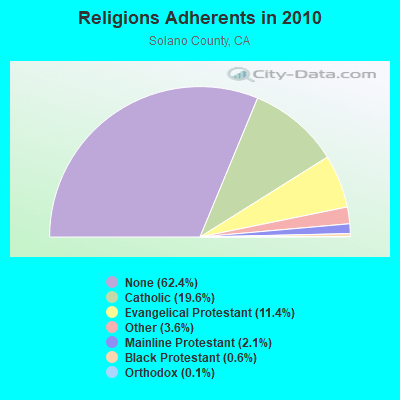
| Religion | Adherents | Congregations |
|---|---|---|
| Catholic | 81,158 | 10 |
| Evangelical Protestant | 47,081 | 181 |
| Other | 15,086 | 45 |
| Mainline Protestant | 8,849 | 40 |
| Black Protestant | 2,567 | 16 |
| Orthodox | 566 | 2 |
| None | 258,037 | - |
Food Environment Statistics:
| Solano County: | 1.92 / 10,000 pop. |
| California: | 2.14 / 10,000 pop. |
| This county: | 0.10 / 10,000 pop. |
| California: | 0.04 / 10,000 pop. |
| This county: | 0.52 / 10,000 pop. |
| California: | 0.62 / 10,000 pop. |
| Solano County: | 2.24 / 10,000 pop. |
| State: | 1.49 / 10,000 pop. |
| This county: | 5.43 / 10,000 pop. |
| California: | 7.42 / 10,000 pop. |
| Solano County: | 9.8% |
| California: | 7.3% |
| This county: | 25.1% |
| California: | 21.3% |
| This county: | 17.4% |
| California: | 17.9% |
Health and Nutrition:
| Benicia: | 52.7% |
| California: | 49.4% |
| This city: | 51.5% |
| California: | 48.0% |
| Here: | 28.4 |
| State: | 28.1 |
| Benicia: | 20.2% |
| California: | 20.2% |
| Benicia: | 10.2% |
| California: | 11.2% |
| This city: | 6.8 |
| California: | 6.8 |
| Here: | 34.8% |
| California: | 31.5% |
| Here: | 59.1% |
| California: | 56.4% |
| This city: | 80.7% |
| California: | 80.9% |
More about Health and Nutrition of Benicia, CA Residents
| Local government employment and payroll (March 2022) | |||||
| Function | Full-time employees | Monthly full-time payroll | Average yearly full-time wage | Part-time employees | Monthly part-time payroll |
|---|---|---|---|---|---|
| Police Protection - Officers | 32 | $436,329 | $163,623 | 0 | $0 |
| Firefighters | 30 | $375,748 | $150,299 | 0 | $0 |
| Other Government Administration | 28 | $208,006 | $89,145 | 0 | $0 |
| Parks and Recreation | 20 | $130,563 | $78,338 | 56 | $56,989 |
| Water Supply | 20 | $162,480 | $97,488 | 0 | $0 |
| Police - Other | 19 | $140,820 | $88,939 | 1 | $1,918 |
| Sewerage | 16 | $124,997 | $93,748 | 0 | $0 |
| Financial Administration | 16 | $119,557 | $89,668 | 0 | $0 |
| Local Libraries | 12 | $91,088 | $91,088 | 37 | $41,088 |
| Housing and Community Development (Local) | 8 | $63,525 | $95,288 | 1 | $2,096 |
| Fire - Other | 7 | $74,132 | $127,083 | 0 | $0 |
| Streets and Highways | 6 | $43,546 | $87,092 | 0 | $0 |
| Other and Unallocable | 4 | $31,350 | $94,050 | 0 | $0 |
| Totals for Government | 218 | $2,002,141 | $110,210 | 95 | $102,091 |
Benicia government finances - Expenditure in 2017 (per resident):
- Construction - Central Staff Services: $15,992,000 ($601.95)
Regular Highways: $2,140,000 ($80.55)
Water Utilities: $1,417,000 ($53.34)
Local Fire Protection: $380,000 ($14.30)
Police Protection: $167,000 ($6.29)
- Current Operations - Police Protection: $8,990,000 ($338.39)
Local Fire Protection: $7,211,000 ($271.43)
Water Utilities: $6,767,000 ($254.71)
Sewerage: $6,370,000 ($239.77)
Parks and Recreation: $5,335,000 ($200.81)
Central Staff Services: $5,011,000 ($188.62)
Protective Inspection and Regulation - Other: $2,919,000 ($109.87)
Libraries: $2,215,000 ($83.37)
Regular Highways: $1,831,000 ($68.92)
Financial Administration: $832,000 ($31.32)
General - Other: $331,000 ($12.46)
- General - Interest on Debt: $1,258,000 ($47.35)
- Intergovernmental to Local - Other - Water Utilities: $538,000 ($20.25)
- Other Capital Outlay - General - Other: $877,000 ($33.01)
Police Protection: $343,000 ($12.91)
Parks and Recreation: $169,000 ($6.36)
Housing and Community Development: $84,000 ($3.16)
Libraries: $44,000 ($1.66)
Central Staff Services: $5,000 ($0.19)
Protective Inspection and Regulation - Other: $3,000 ($0.11)
- Water Utilities - Interest on Debt: $951,000 ($35.80)
Benicia government finances - Revenue in 2017 (per resident):
- Charges - Sewerage: $9,005,000 ($338.95)
Other: $1,454,000 ($54.73)
Parks and Recreation: $1,236,000 ($46.52)
Miscellaneous Commercial Activities: $68,000 ($2.56)
- Federal Intergovernmental - Other: $166,000 ($6.25)
- Local Intergovernmental - Other: $352,000 ($13.25)
- Miscellaneous - General Revenue - Other: $768,000 ($28.91)
Rents: $502,000 ($18.90)
Donations From Private Sources: $172,000 ($6.47)
Interest Earnings: $157,000 ($5.91)
Fines and Forfeits: $73,000 ($2.75)
- Revenue - Water Utilities: $9,724,000 ($366.02)
- State Intergovernmental - Other: $900,000 ($33.88)
Highways: $548,000 ($20.63)
General Local Government Support: $125,000 ($4.71)
- Tax - Property: $16,878,000 ($635.30)
Public Utilities Sales: $6,664,000 ($250.84)
Other: $5,744,000 ($216.21)
General Sales and Gross Receipts: $5,439,000 ($204.73)
Occupation and Business License - Other: $534,000 ($20.10)
Other Selective Sales: $507,000 ($19.08)
Other License: $444,000 ($16.71)
Documentary and Stock Transfer: $164,000 ($6.17)
Benicia government finances - Debt in 2017 (per resident):
- Long Term Debt - Outstanding Unspecified Public Purpose: $59,722,000 ($2247.98)
Beginning Outstanding - Unspecified Public Purpose: $55,188,000 ($2077.31)
Issue, Unspecified Public Purpose: $11,008,000 ($414.35)
Retired Unspecified Public Purpose: $6,475,000 ($243.72)
Benicia government finances - Cash and Securities in 2017 (per resident):
- Bond Funds - Cash and Securities: $3,287,000 ($123.72)
- Other Funds - Cash and Securities: $56,746,000 ($2135.96)
- Sinking Funds - Cash and Securities: $738,000 ($27.78)
6.92% of this county's 2021 resident taxpayers lived in other counties in 2020 ($66,832 average adjusted gross income)
| Here: | 6.92% |
| California average: | 5.19% |
0.10% of residents moved from foreign countries ($924 average AGI)
Solano County: 0.10% California average: 0.03%
Top counties from which taxpayers relocated into this county between 2020 and 2021:
| from Contra Costa County, CA | |
| from Alameda County, CA | |
| from Sacramento County, CA |
7.45% of this county's 2020 resident taxpayers moved to other counties in 2021 ($71,700 average adjusted gross income)
| Here: | 7.45% |
| California average: | 6.14% |
0.08% of residents moved to foreign countries ($756 average AGI)
Solano County: 0.08% California average: 0.02%
Top counties to which taxpayers relocated from this county between 2020 and 2021:
| to Contra Costa County, CA | |
| to Sacramento County, CA | |
| to Alameda County, CA |
| Businesses in Benicia, CA | ||||
| Name | Count | Name | Count | |
|---|---|---|---|---|
| 7-Eleven | 1 | KFC | 1 | |
| Ace Hardware | 1 | MasterBrand Cabinets | 11 | |
| Baskin-Robbins | 1 | McDonald's | 2 | |
| Best Western | 1 | Quiznos | 1 | |
| Big O Tires | 1 | RadioShack | 1 | |
| Burger King | 2 | Rite Aid | 1 | |
| CVS | 1 | Ryder Rental & Truck Leasing | 1 | |
| Carl\s Jr. | 1 | Safeway | 1 | |
| Curves | 1 | Sears | 1 | |
| Decora Cabinetry | 1 | Starbucks | 4 | |
| FedEx | 6 | T-Mobile | 1 | |
| GameStop | 1 | Taco Bell | 1 | |
| H&R Block | 2 | U-Haul | 1 | |
| Holiday Inn | 1 | UPS | 7 | |
| Jack In The Box | 1 | Vons | 1 | |
| Jamba Juice | 1 | |||
Strongest AM radio stations in Benicia:
- KDYA (1190 AM; 10 kW; VALLEJO, CA; Owner: BAYBRIDGE COMMUNICATIONS, L.L.C.)
- KTRB (860 AM; 50 kW; MODESTO, CA; Owner: PAPPAS RADIO OF CALIFORNIA, A CALIFORNIA LIMITED PARTNERSHIP)
- KCBS (740 AM; 50 kW; SAN FRANCISCO, CA; Owner: INFINITY BROADCASTING OPERATIONS, INC.)
- KDIA (1640 AM; 10 kW; VALLEJO, CA; Owner: BAYBRIDGE COMMUNICATIONS, L.L.C.)
- KIQI (1010 AM; 35 kW; SAN FRANCISCO, CA; Owner: RADIO UNICA OF SAN FRANCISCO LICENSE CORP.)
- KNEW (910 AM; 20 kW; OAKLAND, CA; Owner: AMFM RADIO LICENSES, L.L.C.)
- KTCT (1050 AM; 50 kW; SAN MATEO, CA; Owner: SUSQUEHANNA RADIO CORP.)
- KFAX (1100 AM; 50 kW; SAN FRANCISCO, CA; Owner: GOLDEN GATE BROADCASTING CO, INC.)
- KNBR (680 AM; 50 kW; SAN FRANCISCO, CA; Owner: KNBR LICO, INC.)
- KABN (1480 AM; 5 kW; CONCORD, CA; Owner: CONCORD AREA BROADCASTING CORP.)
- KGO (810 AM; 50 kW; SAN FRANCISCO, CA; Owner: KGO-AM RADIO, INC.)
- KATD (990 AM; 10 kW; PITTSBURG, CA; Owner: RADIO UNICA OF SACRAMENTO LICENSE CORP.)
- KFRC (610 AM; 5 kW; SAN FRANCISCO, CA; Owner: INFINITY BROADCASTING CORPORATION OF LOS ANGELES)
Strongest FM radio stations in Benicia:
- KKSF-FM1 (103.7 FM; PLEASANTON, ETC., CA; Owner: AMFM RADIO LICENSES, L.L.C.)
- KBLX-FM2 (102.9 FM; PLEASANTON, CA; Owner: ICBC BROADCAST HOLDINGS -CA, INC.)
- KSOL-FM3 (98.9 FM; PLEASANTON, CA; Owner: TMS LICENSE CALIFORNIA, INC)
- KFRC-FM3 (99.7 FM; WALNUT CREEK, CA; Owner: INFINITY KFRC-FM, INC.)
- KZBR-FM1 (95.7 FM; WALNUT CREEK, CA; Owner: BONNEVILLE HOLDING COMPANY)
- KISQ-FM3 (98.1 FM; CONCORD, CA; Owner: AMFM RADIO LICENSES, L.L.C.)
- KMEL-FM1 (106.1 FM; CONCORD, CA; Owner: AMFM RADIO LICENSES, L.L.C.)
- KDFC-FM1 (102.1 FM; LAFAYETTE, CA; Owner: BONNEVILLE HOLDING COMPANY)
- KOIT-FM2 (96.5 FM; MARTINEZ, ETC., CA; Owner: BONNEVILLE HOLDING CO. C/O KOIT(FM))
- KIOI-FM1 (101.3 FM; WALNUT CREEK, CA; Owner: AMFM RADIO LICENSES, L.L.C.)
- KFJO (92.1 FM; WALNUT CREEK, CA; Owner: CHASE RADIO PROPERTIES, L.L.C.)
- KSFB-FM (100.7 FM; SAN RAFAEL, CA; Owner: GOLDEN GATE BROADCASTING COMPANY, INC.)
- KLLC (97.3 FM; SAN FRANCISCO, CA; Owner: INFINITY BROADCASTING OPERATIONS, INC.)
- KUIC (95.3 FM; VACAVILLE, CA; Owner: KUIC, INC.)
- K209BZ (89.7 FM; CONCORD, CA; Owner: YOUR CHRISTIAN COMPANION NETWORK, INC.)
- KVHS (90.5 FM; CONCORD, CA; Owner: CLAYTON VALLEY HIGH SCHOOL)
- KALX (90.7 FM; BERKELEY, CA; Owner: UNIVERSITY OF CALIFORNIA)
- KDFC-FM (102.1 FM; SAN FRANCISCO, CA; Owner: BONNEVILLE HOLDING COMPANY)
- KOIT-FM (96.5 FM; SAN FRANCISCO, CA; Owner: BONNEVILLE HOLDING COMPANY)
- KKSF (103.7 FM; SAN FRANCISCO, CA; Owner: AMFM RADIO LICENSES, L.L.C.)
TV broadcast stations around Benicia:
- KQED (Channel 9; SAN FRANCISCO, CA; Owner: KQED, INC.)
- KTNC-TV (Channel 42; CONCORD, CA; Owner: KTNC LICENSE, LLC)
- KSPX (Channel 29; SACRAMENTO, CA; Owner: PAXSON SACRAMENTO LICENSE, INC.)
- KOVR (Channel 13; STOCKTON, CA; Owner: SCI - SACRAMENTO LICENSEE, LLC)
- KXTV (Channel 10; SACRAMENTO, CA; Owner: KXTV, INC.)
- KCRA-TV (Channel 3; SACRAMENTO, CA; Owner: KCRA HEARST-ARGYLE TELEVISION, INC.)
- KGO-TV (Channel 7; SAN FRANCISCO, CA; Owner: KGO TELEVISION, INC.)
- KPIX-TV (Channel 5; SAN FRANCISCO, CA; Owner: CBS BROADCASTING INC.)
- KTXL (Channel 40; SACRAMENTO, CA; Owner: CHANNEL 40, INC.)
- KUVS (Channel 19; MODESTO, CA; Owner: KUVS LICENSE PARTNERSHIP, G.P.)
- KQCA (Channel 58; STOCKTON, CA; Owner: KCRA HEARST-ARGYLE TELEVISION, INC.)
- KVIE (Channel 6; SACRAMENTO, CA; Owner: KVIE, INC.)
- KMAX-TV (Channel 31; SACRAMENTO, CA; Owner: UPN STATIONS GROUP INC.)
- KTVU (Channel 2; OAKLAND, CA; Owner: KTVU PARTNERSHIP)
- KRON-TV (Channel 4; SAN FRANCISCO, CA; Owner: YOUNG BROADCASTING OF SAN FRANCISCO, INC.)
- KMTP-TV (Channel 32; SAN FRANCISCO, CA; Owner: MINORITY TELEVISION PROJECT)
- KBHK-TV (Channel 44; SAN FRANCISCO, CA; Owner: VIACOM TELEVISION STATIONS GROUP OF SAN FRANCISCO INC.)
- KBWB (Channel 20; SAN FRANCISCO, CA; Owner: KBWB LICENSE, INC.)
- KFSF (Channel 66; VALLEJO, CA; Owner: TELEFUTURA SAN FRANCISCO LLC)
- KCNS (Channel 38; SAN FRANCISCO, CA; Owner: WRAY, INC.)
- KCSM-TV (Channel 60; SAN MATEO, CA; Owner: SAN MATEO COUNTY COMMUNITY COLLEGE DISTRICT)
- KFTL (Channel 64; STOCKTON, CA; Owner: FAMILY STATIONS, INC.)
- National Bridge Inventory (NBI) Statistics
- 71Number of bridges
- 1,004ft / 306mTotal length
- $390,000Total costs
- 1,395,585Total average daily traffic
- 74,698Total average daily truck traffic
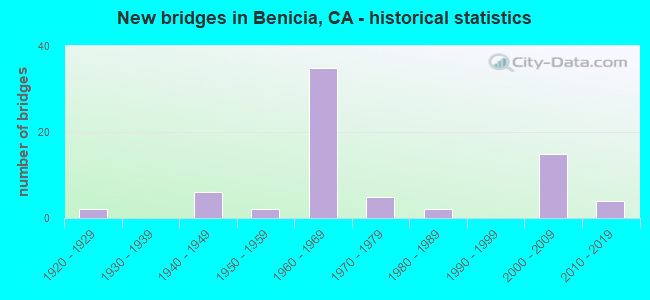
- New bridges - historical statistics
- 21920-1929
- 61940-1949
- 21950-1959
- 351960-1969
- 51970-1979
- 21980-1989
- 152000-2009
- 42010-2019
FCC Registered Antenna Towers: 17 (See the full list of FCC Registered Antenna Towers)
FCC Registered Private Land Mobile Towers: 5 (See the full list of FCC Registered Private Land Mobile Towers in Benicia, CA)
FCC Registered Broadcast Land Mobile Towers: 28 (See the full list of FCC Registered Broadcast Land Mobile Towers)
FCC Registered Microwave Towers: 21 (See the full list of FCC Registered Microwave Towers in this town)
FCC Registered Paging Towers: 1 (See the full list of FCC Registered Paging Towers)
FCC Registered Maritime Coast & Aviation Ground Towers: 6 (See the full list of FCC Registered Maritime Coast & Aviation Ground Towers)
FCC Registered Amateur Radio Licenses: 313 (See the full list of FCC Registered Amateur Radio Licenses in Benicia)
FAA Registered Aircraft Manufacturers and Dealers: 1 (See the full list of FAA Registered Manufacturers and Dealers in Benicia)
FAA Registered Aircraft: 15 (See the full list of FAA Registered Aircraft)
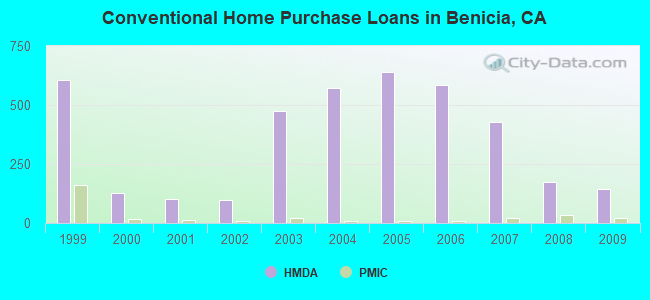
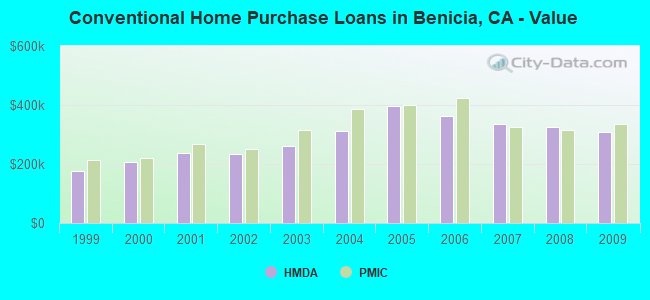
| Home Mortgage Disclosure Act Aggregated Statistics For Year 2009 (Based on 5 full and 2 partial tracts) | ||||||||||||
| A) FHA, FSA/RHS & VA Home Purchase Loans | B) Conventional Home Purchase Loans | C) Refinancings | D) Home Improvement Loans | F) Non-occupant Loans on < 5 Family Dwellings (A B C & D) | G) Loans On Manufactured Home Dwelling (A B C & D) | |||||||
|---|---|---|---|---|---|---|---|---|---|---|---|---|
| Number | Average Value | Number | Average Value | Number | Average Value | Number | Average Value | Number | Average Value | Number | Average Value | |
| LOANS ORIGINATED | 92 | $312,070 | 143 | $309,478 | 694 | $271,513 | 42 | $212,134 | 49 | $239,295 | 1 | $64,000 |
| APPLICATIONS APPROVED, NOT ACCEPTED | 12 | $333,813 | 17 | $267,606 | 75 | $308,287 | 4 | $225,758 | 9 | $165,616 | 0 | $0 |
| APPLICATIONS DENIED | 15 | $284,394 | 25 | $263,214 | 202 | $338,628 | 10 | $170,074 | 24 | $276,432 | 3 | $50,333 |
| APPLICATIONS WITHDRAWN | 9 | $251,182 | 24 | $226,280 | 128 | $294,837 | 7 | $145,124 | 14 | $202,069 | 0 | $0 |
| FILES CLOSED FOR INCOMPLETENESS | 3 | $317,777 | 4 | $304,802 | 36 | $347,495 | 1 | $75,000 | 2 | $165,370 | 0 | $0 |
Detailed HMDA statistics for the following Tracts: 2520.00 , 2521.02, 2521.04, 2521.05, 2521.06, 2521.07, 2521.08
| Private Mortgage Insurance Companies Aggregated Statistics For Year 2009 (Based on 5 full and 2 partial tracts) | ||||||
| A) Conventional Home Purchase Loans | B) Refinancings | C) Non-occupant Loans on < 5 Family Dwellings (A & B) | ||||
|---|---|---|---|---|---|---|
| Number | Average Value | Number | Average Value | Number | Average Value | |
| LOANS ORIGINATED | 22 | $334,361 | 6 | $362,443 | 0 | $0 |
| APPLICATIONS APPROVED, NOT ACCEPTED | 7 | $271,143 | 8 | $365,894 | 0 | $0 |
| APPLICATIONS DENIED | 2 | $582,000 | 2 | $235,620 | 0 | $0 |
| APPLICATIONS WITHDRAWN | 0 | $0 | 0 | $0 | 0 | $0 |
| FILES CLOSED FOR INCOMPLETENESS | 1 | $136,000 | 0 | $0 | 1 | $136,000 |
Detailed PMIC statistics for the following Tracts: 2520.00 , 2521.02, 2521.04, 2521.05, 2521.06, 2521.07, 2521.08
2005 - 2018 National Fire Incident Reporting System (NFIRS) incidents
- Fire incident types reported to NFIRS in Benicia, CA
- 47752.4%Outside Fires
- 24026.4%Structure Fires
- 15016.5%Mobile Property/Vehicle Fires
- 434.7%Other
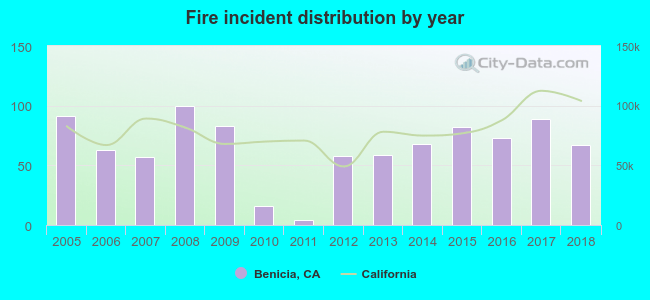 Based on the data from the years 2005 - 2018 the average number of fire incidents per year is 65. The highest number of reported fires - 100 took place in 2008, and the least - 4 in 2011. The data has a decreasing trend.
 When looking into fire subcategories, the most reports belonged to: Outside Fires (52.4%), and Structure Fires (26.4%).
Fire-safe hotels and motels in Benicia, California:
- Best Western Heritage Inn, Benicia, 1955 E Second St, Benicia, California 94510 , Phone: (707) 746-0401, Fax: (707) 745-0842
- Holiday Inn Express Benicia, 1375 E 5th St, Benicia, California 94510 , Phone: (707) 297-6873, Fax: (707) 297-6904
| Most common first names in Benicia, CA among deceased individuals | ||
| Name | Count | Lived (average) |
|---|---|---|
| John | 101 | 75.3 years |
| Mary | 94 | 79.2 years |
| William | 66 | 74.7 years |
| James | 64 | 72.9 years |
| Robert | 61 | 73.4 years |
| Charles | 59 | 74.8 years |
| George | 58 | 75.2 years |
| Helen | 53 | 82.0 years |
| Dorothy | 42 | 78.8 years |
| Frank | 42 | 75.0 years |
| Most common last names in Benicia, CA among deceased individuals | ||
| Last name | Count | Lived (average) |
|---|---|---|
| Brown | 23 | 71.7 years |
| Martin | 21 | 77.3 years |
| Smith | 19 | 71.6 years |
| Hall | 18 | 73.7 years |
| Miller | 17 | 75.0 years |
| Johnson | 17 | 75.2 years |
| Davis | 16 | 72.6 years |
| Williams | 16 | 73.2 years |
| Silva | 13 | 79.0 years |
| Lewis | 12 | 75.4 years |
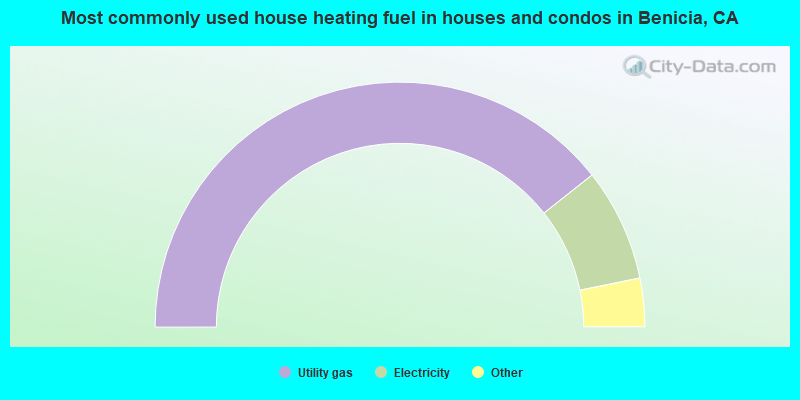
- 78.7%Utility gas
- 14.9%Electricity
- 3.2%Wood
- 2.0%Solar energy
- 0.4%Other fuel
- 0.4%Bottled, tank, or LP gas
- 0.3%No fuel used
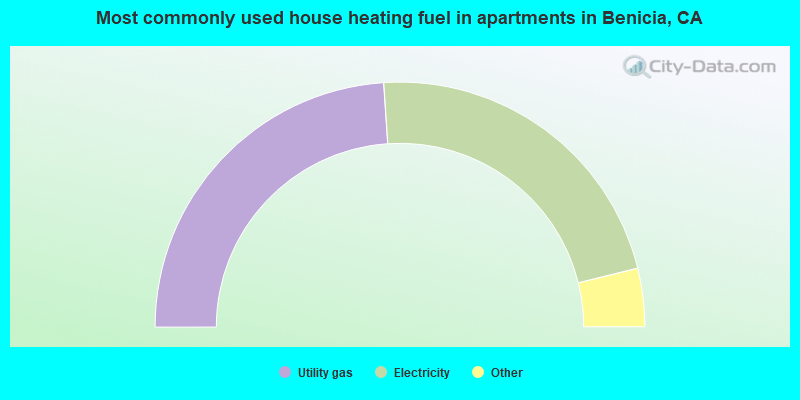
- 47.9%Utility gas
- 44.4%Electricity
- 3.2%Bottled, tank, or LP gas
- 2.6%No fuel used
- 1.8%Other fuel
Benicia compared to California state average:
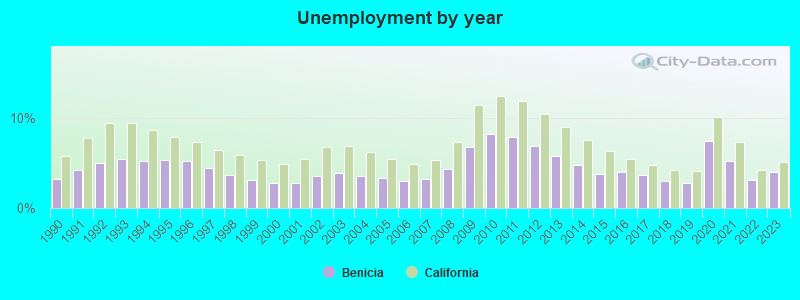
- Unemployed percentage significantly below state average.
- Hispanic race population percentage below state average.
- Median age significantly above state average.
- Foreign-born population percentage below state average.
- Length of stay since moving in above state average.
- Percentage of population with a bachelor's degree or higher above state average.
Benicia on our top lists:
- #64 on the list of "Top 101 cities with the most people taking a ferryboat to work (population 5,000+)"
- #1 on the list of "Top 101 counties with the largest increase in the number of infant deaths per 1000 residents 2000-2006 to 2007-2013 (pop. 50,000+)"
- #21 on the list of "Top 101 counties with the highest Nitrogen Dioxide air pollution readings in 2012 (ppm)"
- #31 on the list of "Top 101 counties with the lowest Particulate Matter (PM10) Annual air pollution readings in 2012 (µg/m3)"
- #36 on the list of "Top 101 counties with the highest carbon monoxide air pollution readings in 2012 (ppm)"
- #78 on the list of "Top 101 counties with the highest percentage of residents relocating to foreign countries in 2011 (pop. 50,000+)"

|
|
Total of 388 patent applications in 2008-2024.