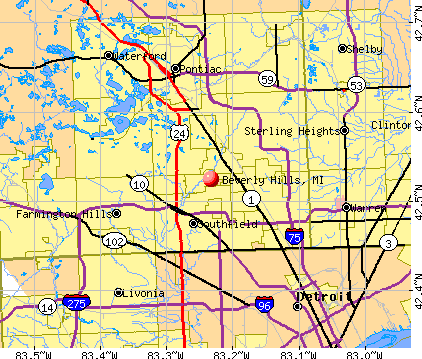
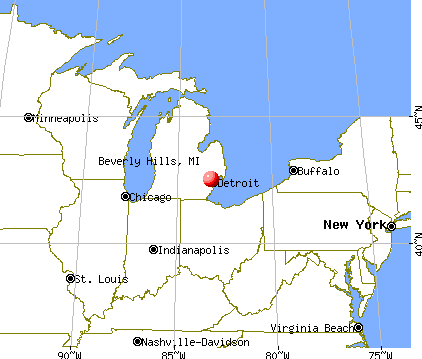
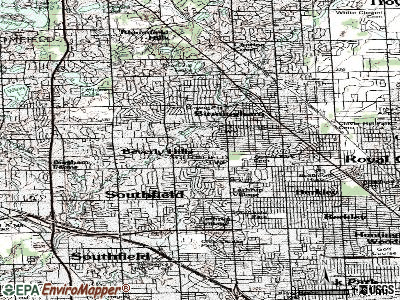
Beverly Hills, Michigan
Submit your own pictures of this village and show them to the world
- OSM Map
- General Map
- Google Map
- MSN Map
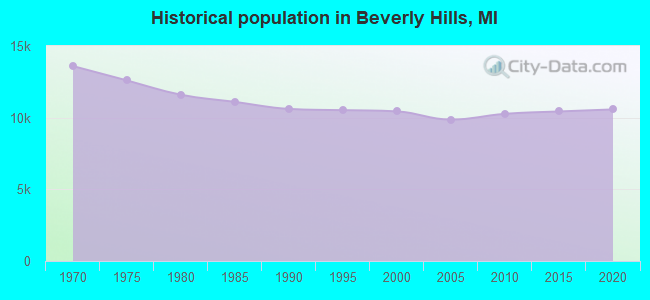
Population change since 2000: -0.0%
 |
| Males: 5,121 | |
| Females: 5,314 |
| Median resident age: | 47.8 years |
| Michigan median age: | 40.3 years |
Zip codes: 48025.
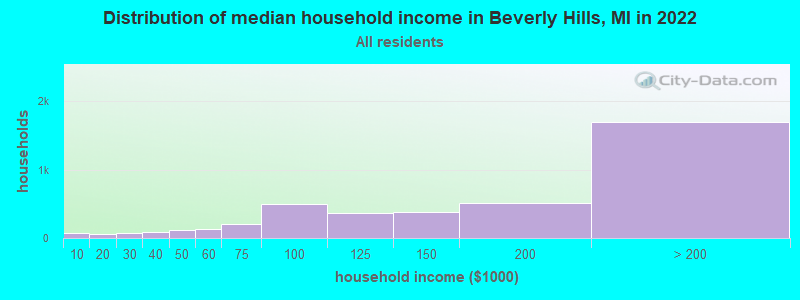
| Beverly Hills: | $158,812 |
| MI: | $66,986 |
Estimated per capita income in 2022: $77,026 (it was $43,452 in 2000)
Beverly Hills village income, earnings, and wages data
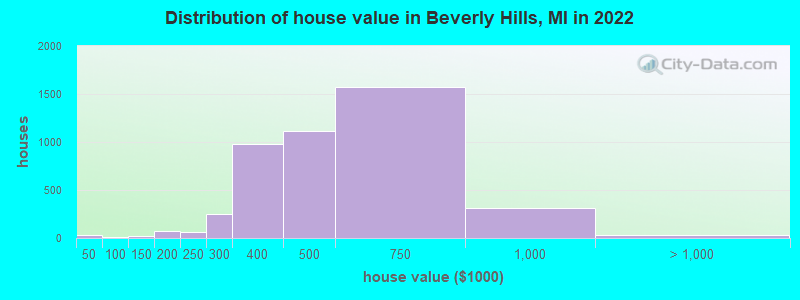
Estimated median house or condo value in 2022: $501,990 (it was $269,500 in 2000)
| Beverly Hills: | $501,990 |
| MI: | $224,400 |
Mean prices in 2022: all housing units: $385,845; detached houses: $411,064; townhouses or other attached units: $279,603; in 2-unit structures: $305,018; in 3-to-4-unit structures: $206,955; in 5-or-more-unit structures: $228,603; mobile homes: $52,080; occupied boats, rvs, vans, etc.: $331,049
Median gross rent in 2022: $1,538.
(1.0% for White Non-Hispanic residents, 14.1% for Black residents)
Detailed information about poverty and poor residents in Beverly Hills, MI


Compare current foreclosures near Beverly Hills, MI:
| Photo | Address | Area | Beds / Baths | Price | Details |
|---|---|---|---|---|---|

|
#1
S Dearborn St
Melvindale, MI 48122
|
912 sq. feet
|
1 baths 3 beds |
$124,000
|
show details |

|
#2
N Kane St
Detroit, MI 48223
|
954 sq. feet
|
1 baths 3 beds |
$125,000
|
show details |

|
#3
Kentfield St
Detroit, MI 48219
|
1,913 sq. feet
|
2 baths 5 beds |
$83,600
|
show details |

|
#4
Winder St Apt 206
Detroit, MI 48201
|
770 sq. feet
|
1 baths 1 beds |
$309,900
|
show details |

|
#5
Piper Ave
Eastpointe, MI 48021
|
721 sq. feet
|
1 baths 2 beds |
$67,900
|
show details |

|
#6
Toepfer Rd
Warren, MI 48091
|
1,092 sq. feet
|
1 baths 3 beds |
$159,000
|
show details |

|
#7
Desoto St
Detroit, MI 48238
|
1,500 sq. feet
|
1 baths 3 beds |
$71,250
|
show details |

|
#8
Oak Hill Dr # 59
Waterford, MI 48329
|
1,024 sq. feet
|
1 baths 1 beds |
$164,500
|
show details |

|
#9
Roselawn St
Detroit, MI 48204
|
1,368 sq. feet
|
2 baths 4 beds |
$54,900
|
show details |

|
#10
2nd Ave
Pontiac, MI 48340
|
959 sq. feet
|
1 baths 3 beds |
$52,500
|
show details |
| Photo | Address | Area | Beds / Baths | Price | Details |
|---|---|---|---|---|---|

|
#11
W Buena Vista St
Detroit, MI 48238
|
2,852 sq. feet
|
3 baths 4 beds |
$40,000
|
show details |

|
#12
Somerset Ave
Detroit, MI 48224
|
1,171 sq. feet
|
1 baths 3 beds |
$14,900
|
show details |

|
#13
Montrose St
Detroit, MI 48227
|
1,310 sq. feet
|
1 baths 3 beds |
$95,500
|
show details |

|
#14
Greensboro St
Detroit, MI 48224
|
1,038 sq. feet
|
1 baths 2 beds |
$84,900
|
show details |

|
#15
Greenview Ave
Detroit, MI 48228
|
- sq. feet
|
1 baths 1 beds |
$16,600
|
show details |

|
#16
Georgiana Ave
Warren, MI 48089
|
1,233 sq. feet
|
1 baths - beds |
$4,500
|
show details |

|
#17
Hazelwood St
Inkster, MI 48141
|
- sq. feet
|
1 baths 3 beds |
$89,250
|
show details |

|
#18
Mcclellan St
Detroit, MI 48214
|
- sq. feet
|
2 baths 4 beds |
$35,000
|
show details |

|
#19
Orleans St # 49
Detroit, MI 48207
|
- sq. feet
|
2 baths 3 beds |
$99,900
|
show details |

|
#20
Danbury St
Highland Park, MI 48203
|
728 sq. feet
|
1 baths - beds |
$14,900
|
show details |
| Photo | Address | Area | Beds / Baths | Price | Details |
|---|---|---|---|---|---|

|
#21
Collingwood St
Detroit, MI 48206
|
1,424 sq. feet
|
1 baths - beds |
$19,900
|
show details |

|
#22
Springfield St
Detroit, MI 48213
|
876 sq. feet
|
1 baths - beds |
$13,900
|
show details |

|
#23
Genella St
Waterford, MI 48328
|
1,013 sq. feet
|
1 baths 3 beds |
show details | |

|
#24
Stratford Rd
Detroit, MI 48221
|
4,057 sq. feet
|
5 baths 3 beds |
show details | |

|
#25
Merriman Rd
Livonia, MI 48150
|
994 sq. feet
|
1 baths 3 beds |
show details | |

|
#26
Pennsylvania St
Southfield, MI 48075
|
2,291 sq. feet
|
3 baths 4 beds |
show details | |

|
#27
Eider Dr
Clinton Township, MI 48038
|
3,030 sq. feet
|
2 baths 4 beds |
show details | |

|
#28
Goodison Place Dr
Rochester, MI 48306
|
3,305 sq. feet
|
4 baths 5 beds |
show details | |

|
#29
Bringard Dr
Detroit, MI 48205
|
1,431 sq. feet
|
1 baths 3 beds |
show details | |

|
#30
Hawthorne Dr N
Utica, MI 48316
|
4,250 sq. feet
|
5 baths 4 beds |
show details |
| Photo | Address | Area | Beds / Baths | Price | Details |
|---|---|---|---|---|---|

|
#31
Lakepointe St
Detroit, MI 48224
|
924 sq. feet
|
1 baths 3 beds |
show details | |

|
#32
W Hazelhurst St
Ferndale, MI 48220
|
2,112 sq. feet
|
2 baths 3 beds |
show details | |

|
#33
13 Mile Rd, Unit 1
Roseville, MI 48066
|
840 sq. feet
|
1 baths 2 beds |
show details | |

|
#34
Lapham St
Dearborn, MI 48126
|
1,350 sq. feet
|
1 baths 3 beds |
show details | |

|
#35
E Muir Ave
Hazel Park, MI 48030
|
906 sq. feet
|
1 baths 3 beds |
show details | |

|
#36
Sharon St
Garden City, MI 48135
|
1,044 sq. feet
|
2 baths 4 beds |
show details | |

|
#37
Fleetwood Dr
Harper Woods, MI 48225
|
1,401 sq. feet
|
1 baths 4 beds |
show details | |

|
#38
Somerset St
Westland, MI 48186
|
981 sq. feet
|
2 baths 3 beds |
show details | |

|
#39
Evergreen Rd
Detroit, MI 48219
|
1,105 sq. feet
|
1 baths 3 beds |
show details | |

|
#40
Westbrook St
Detroit, MI 48219
|
955 sq. feet
|
1 baths 3 beds |
show details |
| Photo | Address | Area | Beds / Baths | Price | Details |
|---|---|---|---|---|---|

|
#41
Elm St
Roseville, MI 48066
|
1,800 sq. feet
|
1 baths 3 beds |
show details | |

|
#42
Wayburn St
Detroit, MI 48224
|
1,200 sq. feet
|
1 baths 3 beds |
show details | |

|
#43
Voorheis St
Pontiac, MI 48341
|
1,205 sq. feet
|
1 baths 2 beds |
show details | |

|
#44
Huntington Rd
Detroit, MI 48219
|
1,908 sq. feet
|
1 baths 3 beds |
show details | |

|
#45
Waltz Ave
Warren, MI 48091
|
700 sq. feet
|
1 baths 3 beds |
show details | |

|
#46
Holbrook St
Detroit, MI 48202
|
2,000 sq. feet
|
2 baths 4 beds |
show details | |

|
#47
Della Rosa Dr
Sterling Heights, MI 48313
|
1,667 sq. feet
|
1 baths 3 beds |
show details | |

|
#48
E Jefferson Ave
Detroit, MI 48207
|
783 sq. feet
|
1 baths 1 beds |
show details | |

|
#49
Beechwood St
Roseville, MI 48066
|
1,357 sq. feet
|
1 baths 3 beds |
show details | |

|
Check over 1 million property listings on Foreclosure.com!
|
browse all offers | |||


- 8,49980.7%White alone
- 6736.4%Black alone
- 5034.8%Two or more races
- 4174.0%Asian alone
- 3823.6%Hispanic
- 170.2%American Indian alone
- 70.07%Native Hawaiian and Other
Pacific Islander alone
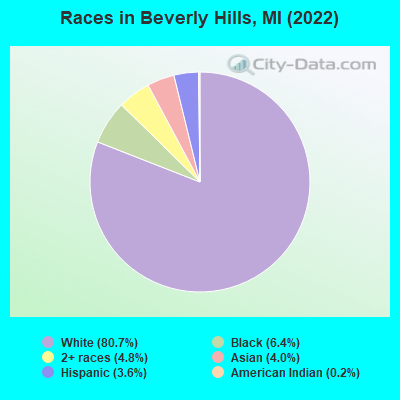
Races in Beverly Hills detailed stats: ancestries, foreign born residents, place of birth
According to our research of Michigan and other state lists, there were 4 registered sex offenders living in Beverly Hills, Michigan as of April 24, 2024.
The ratio of all residents to sex offenders in Beverly Hills is 2,631 to 1.
The ratio of registered sex offenders to all residents in this city is much lower than the state average.
Type |
2009 |
2010 |
2011 |
2012 |
2013 |
2014 |
2015 |
2016 |
2017 |
2018 |
2019 |
2020 |
2021 |
2022 |
|---|---|---|---|---|---|---|---|---|---|---|---|---|---|---|
| Murders (per 100,000) | 0 (0.0) | 0 (0.0) | 0 (0.0) | 0 (0.0) | 0 (0.0) | 0 (0.0) | 0 (0.0) | 1 (9.6) | 0 (0.0) | 0 (0.0) | 0 (0.0) | 0 (0.0) | 0 (0.0) | 0 (0.0) |
| Rapes (per 100,000) | 0 (0.0) | 2 (19.5) | 0 (0.0) | 0 (0.0) | 1 (9.6) | 0 (0.0) | 0 (0.0) | 0 (0.0) | 1 (9.5) | 0 (0.0) | 0 (0.0) | 0 (0.0) | 2 (19.5) | 1 (9.6) |
| Robberies (per 100,000) | 2 (20.4) | 0 (0.0) | 3 (29.2) | 1 (9.7) | 2 (19.2) | 1 (9.5) | 0 (0.0) | 0 (0.0) | 0 (0.0) | 1 (9.6) | 0 (0.0) | 0 (0.0) | 1 (9.7) | 1 (9.6) |
| Assaults (per 100,000) | 1 (10.2) | 14 (136.4) | 2 (19.5) | 7 (67.7) | 2 (19.2) | 1 (9.5) | 1 (9.5) | 2 (19.1) | 0 (0.0) | 2 (19.1) | 2 (19.2) | 8 (77.2) | 5 (48.6) | 7 (66.9) |
| Burglaries (per 100,000) | 17 (173.4) | 21 (204.5) | 24 (233.9) | 22 (212.7) | 17 (163.5) | 11 (104.8) | 3 (28.6) | 10 (95.6) | 5 (47.6) | 4 (38.3) | 10 (95.9) | 6 (57.9) | 2 (19.5) | 7 (66.9) |
| Thefts (per 100,000) | 106 (1,081) | 119 (1,159) | 97 (945.5) | 82 (793.0) | 101 (971.2) | 69 (657.6) | 51 (486.0) | 65 (621.7) | 64 (609.3) | 52 (497.6) | 60 (575.3) | 30 (289.5) | 37 (360.0) | 64 (611.4) |
| Auto thefts (per 100,000) | 4 (40.8) | 4 (39.0) | 3 (29.2) | 4 (38.7) | 4 (38.5) | 6 (57.2) | 0 (0.0) | 5 (47.8) | 0 (0.0) | 1 (9.6) | 8 (76.7) | 2 (19.3) | 4 (38.9) | 14 (133.8) |
| Arson (per 100,000) | 0 (0.0) | 4 (39.0) | 0 (0.0) | 0 (0.0) | 0 (0.0) | 0 (0.0) | 2 (19.1) | 0 (0.0) | 0 (0.0) | 0 (0.0) | 0 (0.0) | 0 (0.0) | 0 (0.0) | 0 (0.0) |
| City-Data.com crime index | 66.8 | 106.7 | 69.2 | 66.1 | 70.7 | 43.0 | 23.3 | 58.3 | 35.3 | 30.0 | 39.7 | 32.6 | 47.1 | 63.7 |
The City-Data.com crime index weighs serious crimes and violent crimes more heavily. Higher means more crime, U.S. average is 246.1. It adjusts for the number of visitors and daily workers commuting into cities.
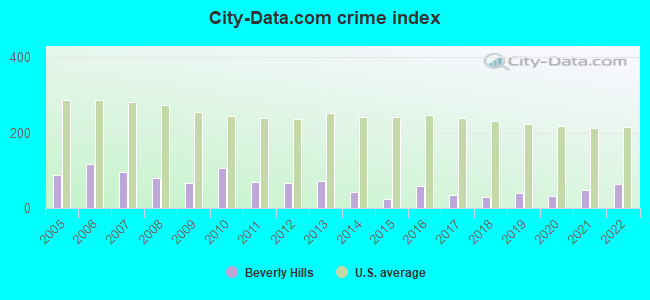
Crime rate in Beverly Hills detailed stats: murders, rapes, robberies, assaults, burglaries, thefts, arson
Full-time law enforcement employees in 2021, including police officers: 27 (25 officers - 24 male; 1 female).
| Officers per 1,000 residents here: | 2.43 |
| Michigan average: | 1.86 |
 Recent articles from our blog. Our writers, many of them Ph.D. graduates or candidates, create easy-to-read articles on a wide variety of topics.

 | Detroit, Cranbrook Schools, Bloomfield Hills, oh my (13 replies) |
| Do Detroit's suburbs suffer from Detroit's reputation? (68 replies) |
| What Suburbs Are On The Rise? (70 replies) |
| From Arlington, VA to Michigan (15 replies) |
| Detroit suburbs (63 replies) |
| why is detroit so dangerous and then all the sudden you go a street over to grosse pointe, and its safe and sound safe? (94 replies) |
Latest news from Beverly Hills, MI collected exclusively by city-data.com from local newspapers, TV, and radio stations
Ancestries: German (13.3%), European (8.5%), Polish (7.1%), English (6.1%), Irish (5.3%), Italian (4.6%).
Current Local Time: EST time zone
Land area: 4.01 square miles.
Population density: 2,603 people per square mile (average).
758 residents are foreign born (2.9% Asia, 2.4% Europe, 1.2% North America).
| This village: | 7.2% |
| Michigan: | 6.9% |
Median real estate property taxes paid for housing units with mortgages in 2022: $6,782 (1.3%)
Median real estate property taxes paid for housing units with no mortgage in 2022: $5,971 (1.4%)
Nearest city with pop. 50,000+: Southfield, MI  (3.2 miles , pop. 78,296).
Nearest city with pop. 200,000+: Detroit, MI (11.6 miles , pop. 951,270).
Nearest city with pop. 1,000,000+: Chicago, IL (232.7 miles , pop. 2,896,016).
Nearest cities:
), ), ), ), )Latitude: 42.52 N, Longitude: 83.23 W
Daytime population change due to commuting: -1,572 (-14.9%)
Workers who live and work in this village: 2,092 (38.5%)
Area code commonly used in this area: 248
Beverly Hills, Michigan accommodation & food services, waste management - Economy and Business Data
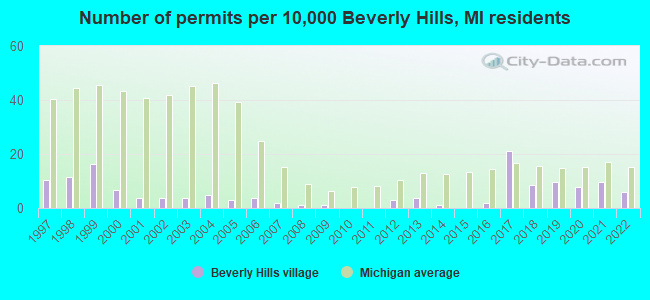
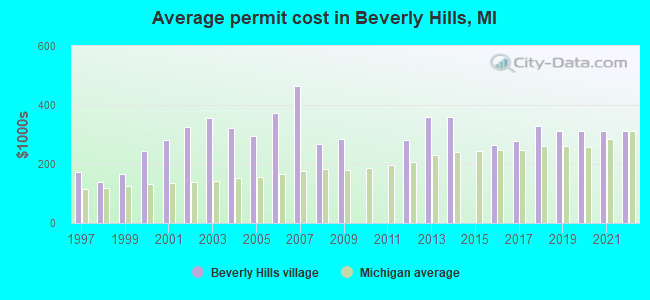
Single-family new house construction building permits:
- 2022: 6 buildings, average cost: $312,100
- 2021: 10 buildings, average cost: $312,100
- 2020: 8 buildings, average cost: $312,100
- 2019: 10 buildings, average cost: $312,100
- 2018: 9 buildings, average cost: $330,300
- 2017: 22 buildings, average cost: $277,500
- 2016: 2 buildings, average cost: $265,000
- 2014: 1 building, cost: $357,500
- 2013: 4 buildings, average cost: $357,500
- 2012: 3 buildings, average cost: $281,700
- 2009: 1 building, cost: $285,000
- 2008: 1 building, cost: $269,000
- 2007: 2 buildings, average cost: $464,500
- 2006: 4 buildings, average cost: $372,000
- 2005: 3 buildings, average cost: $296,200
- 2004: 5 buildings, average cost: $320,800
- 2003: 4 buildings, average cost: $355,000
- 2002: 4 buildings, average cost: $323,800
- 2001: 4 buildings, average cost: $282,500
- 2000: 7 buildings, average cost: $244,300
- 1999: 17 buildings, average cost: $165,000
- 1998: 12 buildings, average cost: $138,900
- 1997: 11 buildings, average cost: $171,800
| Here: | 2.6% |
| Michigan: | 3.5% |
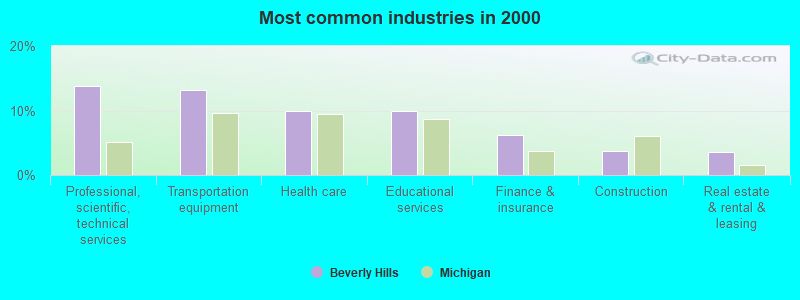
- Professional, scientific, technical services (13.8%)
- Transportation equipment (13.1%)
- Health care (9.9%)
- Educational services (9.9%)
- Finance & insurance (6.2%)
- Construction (3.7%)
- Real estate & rental & leasing (3.6%)
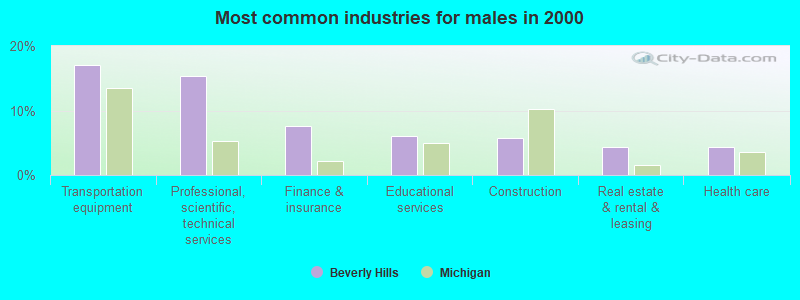
- Transportation equipment (17.0%)
- Professional, scientific, technical services (15.3%)
- Finance & insurance (7.6%)
- Educational services (6.0%)
- Construction (5.8%)
- Real estate & rental & leasing (4.4%)
- Health care (4.4%)
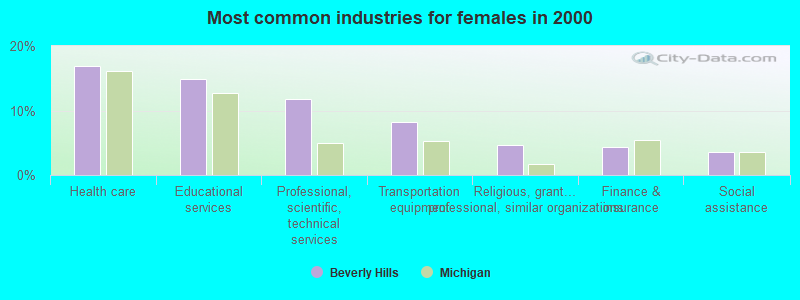
- Health care (17.0%)
- Educational services (14.9%)
- Professional, scientific, technical services (11.8%)
- Transportation equipment (8.2%)
- Religious, grantmaking, civic, professional, similar organizations (4.7%)
- Finance & insurance (4.4%)
- Social assistance (3.5%)
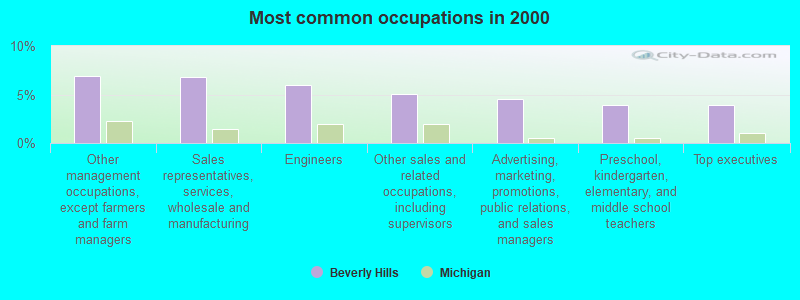
- Other management occupations, except farmers and farm managers (7.0%)
- Sales representatives, services, wholesale and manufacturing (6.8%)
- Engineers (6.0%)
- Other sales and related occupations, including supervisors (5.1%)
- Advertising, marketing, promotions, public relations, and sales managers (4.6%)
- Preschool, kindergarten, elementary, and middle school teachers (4.0%)
- Top executives (3.9%)
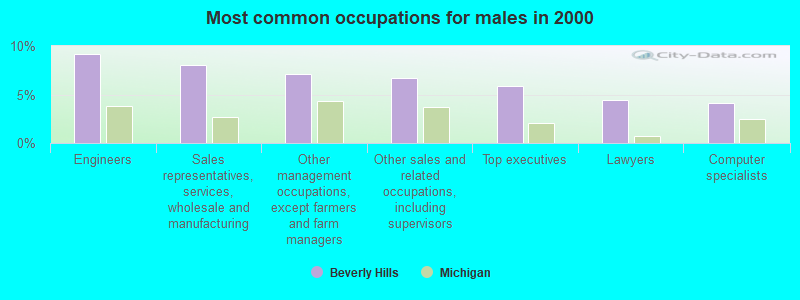
- Engineers (9.1%)
- Sales representatives, services, wholesale and manufacturing (8.0%)
- Other management occupations, except farmers and farm managers (7.1%)
- Other sales and related occupations, including supervisors (6.7%)
- Top executives (5.9%)
- Lawyers (4.5%)
- Computer specialists (4.2%)
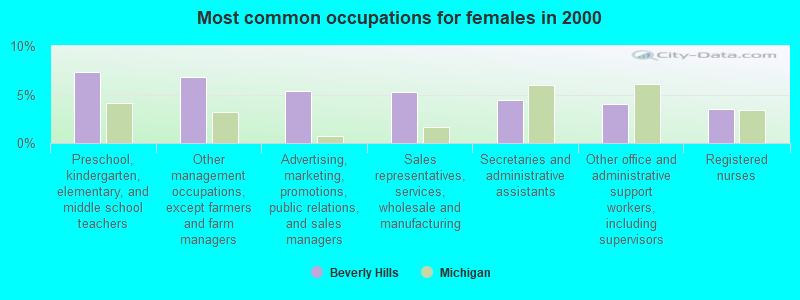
- Preschool, kindergarten, elementary, and middle school teachers (7.3%)
- Other management occupations, except farmers and farm managers (6.8%)
- Advertising, marketing, promotions, public relations, and sales managers (5.4%)
- Sales representatives, services, wholesale and manufacturing (5.3%)
- Secretaries and administrative assistants (4.4%)
- Other office and administrative support workers, including supervisors (4.0%)
- Registered nurses (3.5%)
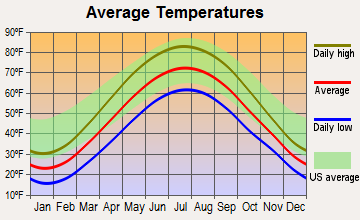
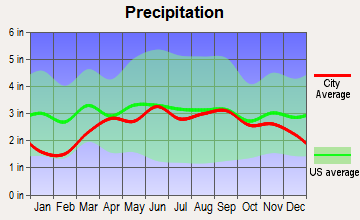
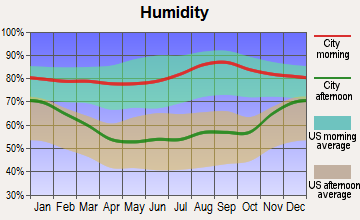
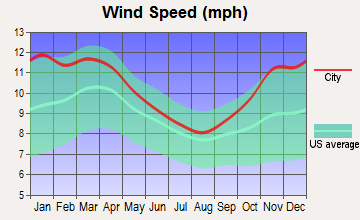
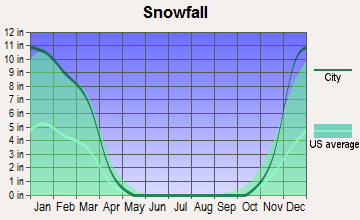
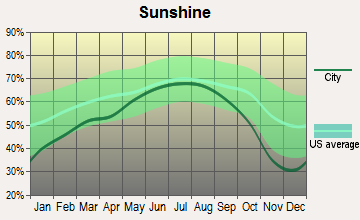
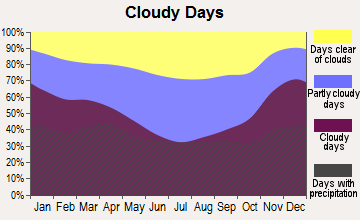
Average climate in Beverly Hills, Michigan
Based on data reported by over 4,000 weather stations
|
|

(lower is better)
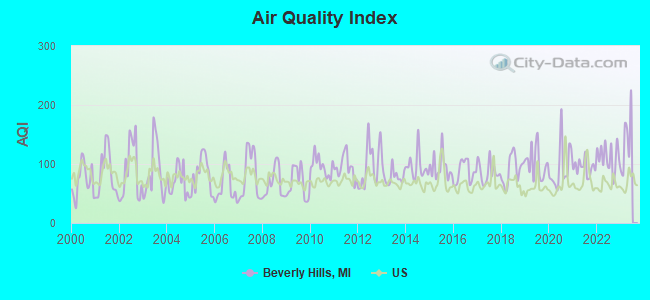
Air Quality Index (AQI) level in 2022 was 111. This is significantly worse than average.
| City: | 111 |
| U.S.: | 73 |
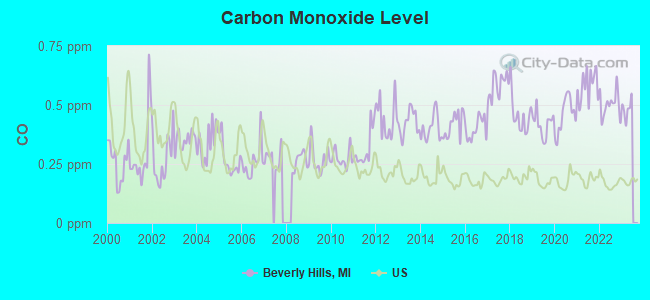
Carbon Monoxide (CO) [ppm] level in 2022 was 0.502. This is significantly worse than average. Closest monitor was 4.9 miles away from the city center.
| City: | 0.502 |
| U.S.: | 0.251 |
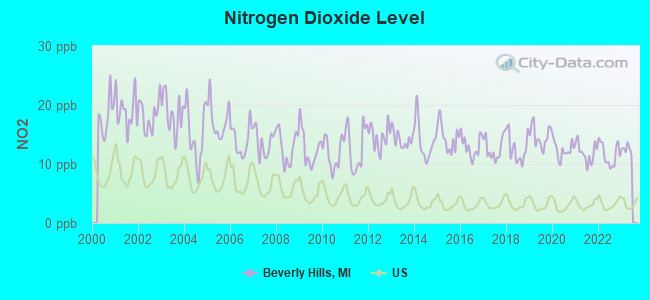
Nitrogen Dioxide (NO2) [ppb] level in 2022 was 11.6. This is significantly worse than average. Closest monitor was 2.6 miles away from the city center.
| City: | 11.6 |
| U.S.: | 5.1 |
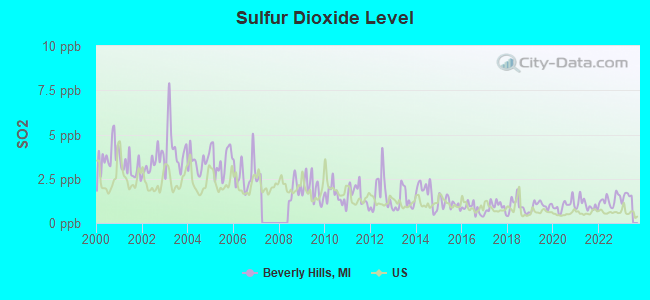
Sulfur Dioxide (SO2) [ppb] level in 2022 was 1.30. This is about average. Closest monitor was 2.6 miles away from the city center.
| City: | 1.30 |
| U.S.: | 1.51 |
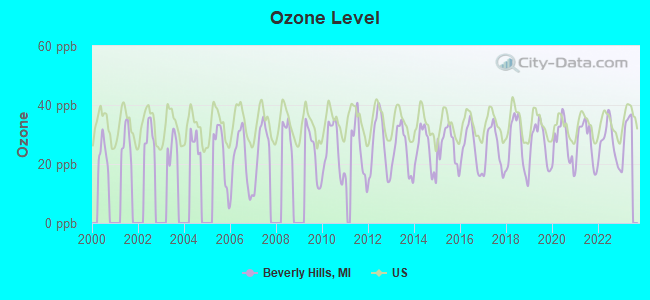
Ozone [ppb] level in 2022 was 27.2. This is better than average. Closest monitor was 4.9 miles away from the city center.
| City: | 27.2 |
| U.S.: | 33.3 |
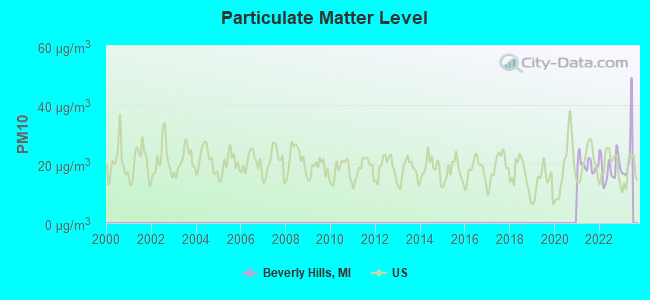
Particulate Matter (PM10) [µg/m3] level in 2022 was 18.6. This is about average. Closest monitor was 12.1 miles away from the city center.
| City: | 18.6 |
| U.S.: | 19.2 |
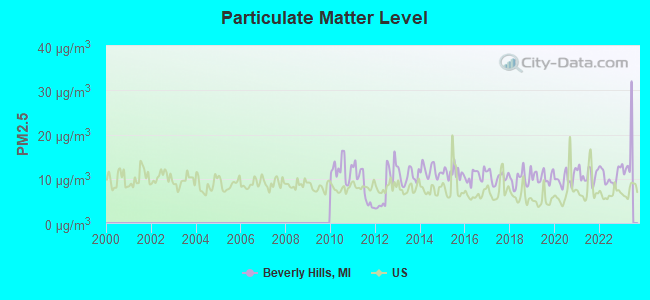
Particulate Matter (PM2.5) [µg/m3] level in 2022 was 10.5. This is worse than average. Closest monitor was 5.0 miles away from the city center.
| City: | 10.5 |
| U.S.: | 8.1 |
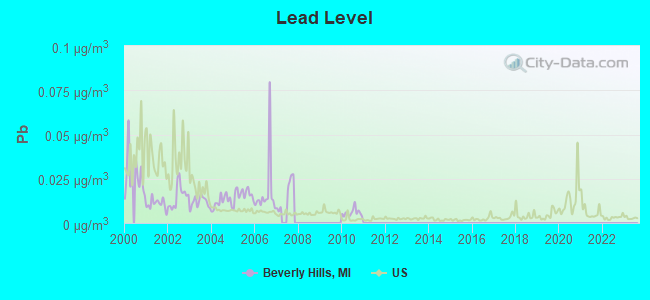
Lead (Pb) [µg/m3] level in 2010 was 0.00584. This is significantly better than average. Closest monitor was 2.6 miles away from the city center.
| City: | 0.00584 |
| U.S.: | 0.00931 |
Tornado activity:
Beverly Hills-area historical tornado activity is slightly above Michigan state average. It is 37% greater than the overall U.S. average.
On 3/20/1976, a category F4 (max. wind speeds 207-260 mph) tornado 5.2 miles away from the Beverly Hills village center killed one person and injured 55 people and caused between $5,000,000 and $50,000,000 in damages.
On 7/4/1957, a category F4 tornado 5.8 miles away from the village center injured 6 people and caused between $50,000 and $500,000 in damages.
Earthquake activity:
Beverly Hills-area historical earthquake activity is significantly above Michigan state average. It is 47% smaller than the overall U.S. average.On 9/25/1998 at 19:52:52, a magnitude 5.2 (4.8 MB, 4.3 MS, 5.2 LG, 4.5 MW, Depth: 3.1 mi, Class: Moderate, Intensity: VI - VII) earthquake occurred 162.4 miles away from the city center
On 1/31/1986 at 16:46:43, a magnitude 5.0 (5.0 MB) earthquake occurred 124.1 miles away from Beverly Hills center
On 7/12/1986 at 08:19:37, a magnitude 4.5 (4.5 MB, Class: Light, Intensity: IV - V) earthquake occurred 149.6 miles away from Beverly Hills center
On 7/27/1980 at 18:52:21, a magnitude 5.2 (5.1 MB, 4.7 MS, 5.0 UK, 5.2 UK) earthquake occurred 301.1 miles away from the city center
On 5/2/2015 at 16:23:07, a magnitude 4.2 (4.2 MW, Depth: 2.8 mi) earthquake occurred 113.9 miles away from the city center
On 8/23/2011 at 17:51:04, a magnitude 5.8 (5.8 MW, Depth: 3.7 mi) earthquake occurred 424.3 miles away from the city center
Magnitude types: regional Lg-wave magnitude (LG), body-wave magnitude (MB), surface-wave magnitude (MS), moment magnitude (MW)
Natural disasters:
The number of natural disasters in Oakland County (12) is smaller than the US average (15).Major Disasters (Presidential) Declared: 6
Emergencies Declared: 5
Causes of natural disasters: Storms: 6, Floods: 5, Tornadoes: 3, Winter Storms: 2, Blizzard: 1, Hurricane: 1, Power Outage: 1, Snowstorm: 1, Wind: 1, Other: 1 (Note: some incidents may be assigned to more than one category).
Hospitals and medical centers in Beverly Hills:
Other hospitals and medical centers near Beverly Hills:
- HEALING WHEEL, INC (Home Health Center, about 1 miles away; SOUTHFIELD, MI)
- MIRACLE HOME CARE (Home Health Center, about 1 miles away; SOUTHFIELD, MI)
- ADVOCARE HOME HEALTH, INC (Home Health Center, about 2 miles away; SOUTHFIELD, MI)
- LONG LIFE HOME HEALTH SERVICES (Home Health Center, about 2 miles away; SOUTHFIELD, MI)
- PERSONALIZE HOME CARE SERVICE, L L C (Home Health Center, about 2 miles away; SOUTHFIELD, MI)
- SUN HOME HEALTH CARE, L L C (Home Health Center, about 2 miles away; SOUTHFIELD, MI)
- PREFERRED HOMECARE SERVICES, INC (Home Health Center, about 2 miles away; LATHRUP VILLAGE, MI)
Amtrak stations near Beverly Hills:
- 3 miles: BIRMINGHAM (449 S. ETON ST.) . Services: public payphones, free short-term parking, free long-term parking, call for taxi service, public transit connection.
- 5 miles: ROYAL OAK (201 S. SHERMAN DR.) . Services: enclosed waiting area, public payphones, vending machines, paid short-term parking, taxi stand, intercity bus service, public transit connection.
- 9 miles: PONTIAC (1600 WIDE TRACK DR.) . Services: partially wheelchair accessible, enclosed waiting area, public payphones, vending machines, free short-term parking, free long-term parking, call for taxi service, intercity bus service, public transit connection.
Colleges/universities with over 2000 students nearest to Beverly Hills:
- Lawrence Technological University (about 4 miles; Southfield, MI; Full-time enrollment: 2,430)
- University of Detroit Mercy (about 9 miles; Detroit, MI; FT enrollment: 3,406)
- Baker College of Auburn Hills (about 10 miles; Auburn Hills, MI; FT enrollment: 2,284)
- Oakland University (about 11 miles; Rochester Hills, MI; FT enrollment: 16,449)
- Oakland Community College (about 13 miles; Bloomfield Hills, MI; FT enrollment: 18,956)
- Schoolcraft College (about 13 miles; Livonia, MI; FT enrollment: 10,867)
- Madonna University (about 14 miles; Livonia, MI; FT enrollment: 3,212)
Public high schools in Beverly Hills:
- WYLIE E. GROVES HIGH SCHOOL (Students: 1,413, Location: 20500 WEST 13 MILE RD, Grades: PK-12)
- NEXUS ACADEMY OF ROYAL OAK (Location: 31333 SOUTHFIELD RD, Grades: 9-12, Charter school)
Public elementary/middle schools in Beverly Hills:
- BERKSHIRE MIDDLE SCHOOL (Students: 786, Location: 21707 WEST 14 MILE RD, Grades: 6-8)
- BEVERLY ELEMENTARY SCHOOL (Students: 348, Location: 18305 BEVERLY RD, Grades: KG-5)
- GREENFIELD ELEMENTARY SCHOOL (Students: 285, Location: 31200 FAIRFAX AVE, Grades: KG-5)
Private elementary/middle school in Beverly Hills:
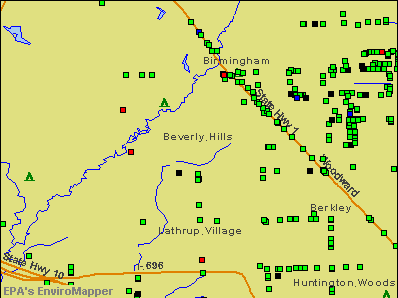
Points of interest:
Notable locations in Beverly Hills: Beverly Hills Village Fire Station (A), Beverly Hills Village Hall (B), Beverly Hills Department of Public Safety Fire Station (C). Display/hide their locations on the map
Park in Beverly Hills: Southfield Park (1). Display/hide its location on the map
Birthplace of: Jordan Gruber - Soccer player.
Drinking water stations with addresses in Beverly Hills that have no violations reported:
| This village: | 2.5 people |
| Michigan: | 2.5 people |
| This village: | 71.5% |
| Whole state: | 66.0% |
| This village: | 3.5% |
| Whole state: | 6.4% |
Likely homosexual households (counted as self-reported same-sex unmarried-partner households)
- Lesbian couples: 0.6% of all households
- Gay men: 0.5% of all households
15 people in group homes intended for adults in 2010
People in group quarters in Beverly Hills in 2000:
- 96 people in nursing homes
- 20 people in homes for the mentally retarded
- 11 people in other group homes
- 6 people in homes for the mentally ill
Banks with branches in Beverly Hills (2011 data):
- Independent Bank: Beverly Hills Branch at 32800 Southfield Road, branch established on 1991/08/19. Info updated 2010/10/20: Bank assets: $2,304.7 mil, Deposits: $2,092.2 mil, headquarters in Ionia, MI, negative income in the last year, Commercial Lending Specialization, 107 total offices, Holding Company: Independent Bank Corporation
- Flagstar Bank, FSB: Beverly Hills Banking Center at 17430 13 Mile Road, branch established on 2002/08/12. Info updated 2011/07/21: Bank assets: $13,623.5 mil, Deposits: $7,802.8 mil, headquarters in Troy, MI, negative income in the last year, Mortgage Lending Specialization, 135 total offices
For population 15 years and over in Beverly Hills:
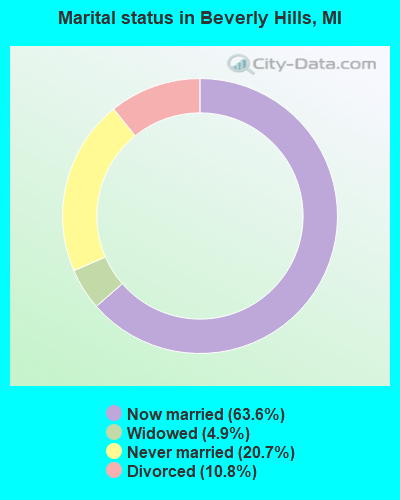
- Never married: 20.7%
- Now married: 63.6%
- Separated: 0.0%
- Widowed: 4.9%
- Divorced: 10.8%
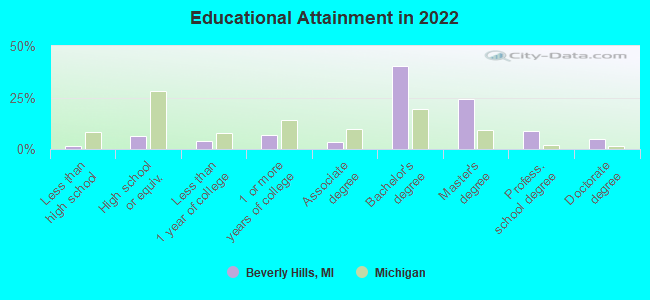
For population 25 years and over in Beverly Hills:
- High school or higher: 98.6%
- Bachelor's degree or higher: 77.0%
- Graduate or professional degree: 37.3%
- Unemployed: 1.4%
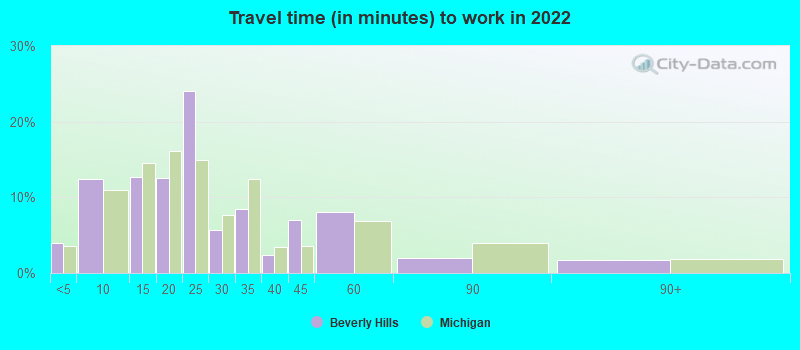
- Mean travel time to work (commute): 16.1 minutes
| Here: | 8.3 |
| Michigan average: | 11.0 |
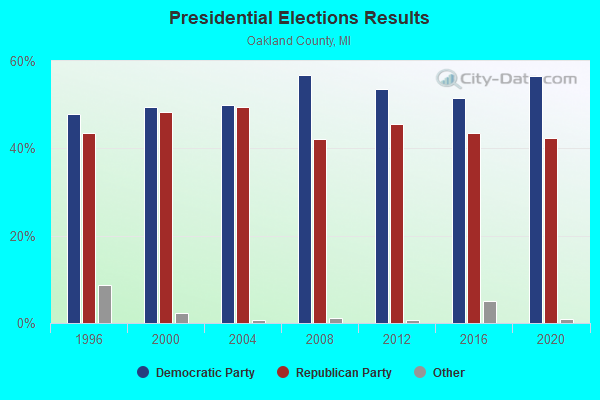
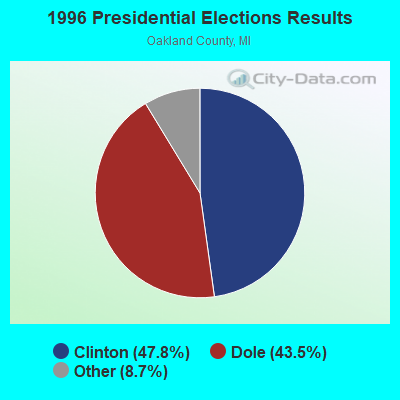
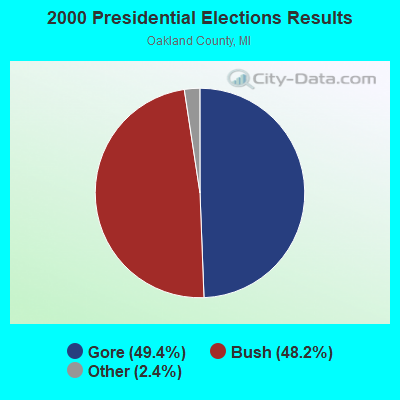
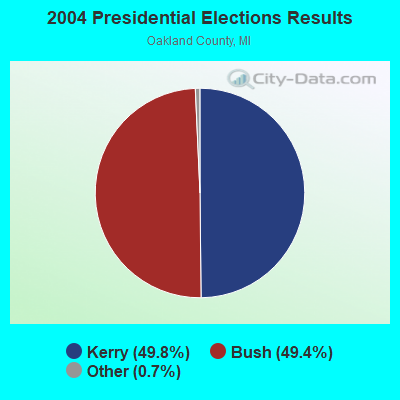
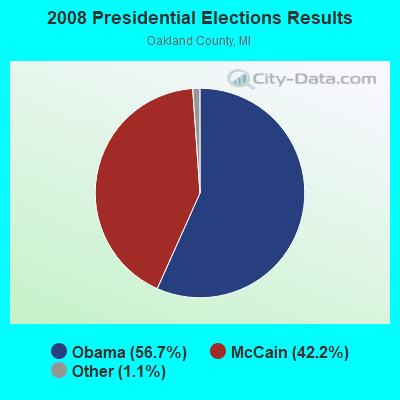
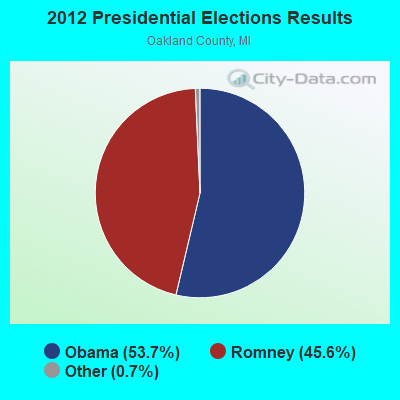
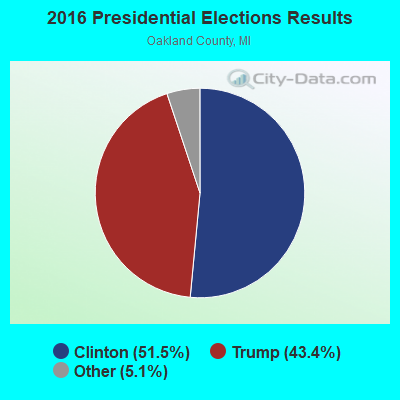
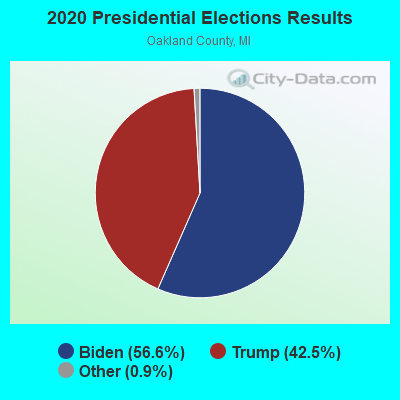
Graphs represent county-level data. Detailed 2008 Election Results
Religion statistics for Beverly Hills, MI (based on Oakland County data)
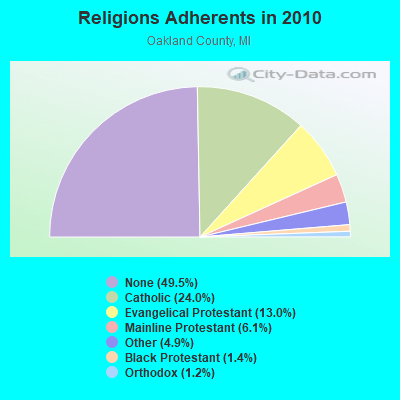
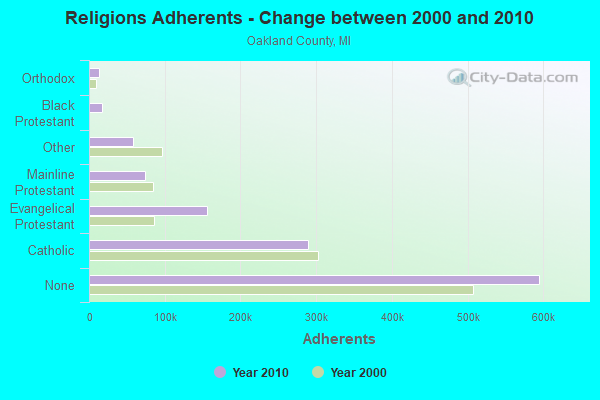
| Religion | Adherents | Congregations |
|---|---|---|
| Catholic | 289,116 | 64 |
| Evangelical Protestant | 155,826 | 319 |
| Mainline Protestant | 73,373 | 159 |
| Other | 58,590 | 117 |
| Black Protestant | 16,826 | 35 |
| Orthodox | 13,844 | 23 |
| None | 594,787 | - |
Food Environment Statistics:
| Oakland County: | 2.44 / 10,000 pop. |
| Michigan: | 2.34 / 10,000 pop. |
| This county: | 0.18 / 10,000 pop. |
| Michigan: | 0.18 / 10,000 pop. |
| Oakland County: | 1.35 / 10,000 pop. |
| Michigan: | 1.52 / 10,000 pop. |
| Oakland County: | 2.43 / 10,000 pop. |
| Michigan: | 2.99 / 10,000 pop. |
| Oakland County: | 8.18 / 10,000 pop. |
| State: | 6.80 / 10,000 pop. |
| Oakland County: | 8.8% |
| State: | 9.7% |
| Here: | 25.6% |
| Michigan: | 29.7% |
| Oakland County: | 13.0% |
| Michigan: | 13.4% |
Health and Nutrition:
| This city: | 55.6% |
| Michigan: | 50.3% |
| This city: | 54.6% |
| Michigan: | 47.9% |
| Beverly Hills: | 28.2 |
| Michigan: | 28.7 |
| Beverly Hills: | 17.8% |
| State: | 20.6% |
| Beverly Hills: | 8.0% |
| Michigan: | 10.4% |
| This city: | 6.9 |
| Michigan: | 6.8 |
| Here: | 35.9% |
| Michigan: | 34.1% |
| Beverly Hills: | 60.7% |
| Michigan: | 57.0% |
| Beverly Hills: | 79.1% |
| Michigan: | 79.6% |
More about Health and Nutrition of Beverly Hills, MI Residents
| Local government employment and payroll (March 2022) | |||||
| Function | Full-time employees | Monthly full-time payroll | Average yearly full-time wage | Part-time employees | Monthly part-time payroll |
|---|---|---|---|---|---|
| Police Protection - Officers | 28 | $223,322 | $95,709 | 0 | $0 |
| Other Government Administration | 6 | $37,489 | $74,978 | 3 | $5,164 |
| Financial Administration | 3 | $19,107 | $76,428 | 0 | $0 |
| Police - Other | 1 | $4,760 | $57,120 | 3 | $3,113 |
| Totals for Government | 38 | $284,678 | $89,898 | 6 | $8,277 |
Beverly Hills government finances - Expenditure in 2018 (per resident):
- Current Operations - General - Other: $7,828,000 ($750.17)
Sewerage: $2,798,000 ($268.14)
Regular Highways: $1,275,000 ($122.18)
Solid Waste Management: $724,000 ($69.38)
Libraries: $476,000 ($45.62)
Financial Administration: $258,000 ($24.72)
Central Staff Services: $100,000 ($9.58)
General Public Buildings: $44,000 ($4.22)
Parks and Recreation: $13,000 ($1.25)
- General - Interest on Debt: $90,000 ($8.62)
- Intergovernmental to Local - Other - Sewerage: $885,000 ($84.81)
Other - General - Other: $476,000 ($45.62)
Other - Police Protection: $315,000 ($30.19)
- Other Capital Outlay - General - Other: $1,404,000 ($134.55)
- Total Salaries and Wages: $2,657,000 ($254.62)
- Water Utilities - Interest on Debt: $48,000 ($4.60)
Beverly Hills government finances - Revenue in 2018 (per resident):
- Charges - Other: $5,544,000 ($531.29)
- Federal Intergovernmental - Other: $7,000 ($0.67)
- Miscellaneous - General Revenue - Other: $531,000 ($50.89)
Fines and Forfeits: $171,000 ($16.39)
Interest Earnings: $59,000 ($5.65)
Rents: $16,000 ($1.53)
- State Intergovernmental - Highways: $1,032,000 ($98.90)
General Local Government Support: $916,000 ($87.78)
Other: $18,000 ($1.72)
- Tax - Property: $6,607,000 ($633.16)
Occupation and Business License - Other: $16,000 ($1.53)
Beverly Hills government finances - Debt in 2018 (per resident):
- Long Term Debt - Beginning Outstanding - Public Debt for Private Purpose: $2,229,000 ($213.61)
Outstanding Nonguaranteed - Industrial Revenue: $1,938,000 ($185.72)
Outstanding Unspecified Public Purpose: $780,000 ($74.75)
Issue, Unspecified Public Purpose: $605,000 ($57.98)
Retired Nonguaranteed - Public Debt for Private Purpose: $290,000 ($27.79)
Beginning Outstanding - Unspecified Public Purpose: $260,000 ($24.92)
Retired Unspecified Public Purpose: $85,000 ($8.15)
Beverly Hills government finances - Cash and Securities in 2018 (per resident):
- Other Funds - Cash and Securities: $3,299,000 ($316.15)
- Sinking Funds - Cash and Securities: $1,938,000 ($185.72)
5.91% of this county's 2021 resident taxpayers lived in other counties in 2020 ($79,655 average adjusted gross income)
| Here: | 5.91% |
| Michigan average: | 5.83% |
0.01% of residents moved from foreign countries ($78 average AGI)
Oakland County: 0.01% Michigan average: 0.00%
Top counties from which taxpayers relocated into this county between 2020 and 2021:
| from Wayne County, MI | |
| from Macomb County, MI | |
| from Genesee County, MI |
6.21% of this county's 2020 resident taxpayers moved to other counties in 2021 ($89,748 average adjusted gross income)
| Here: | 6.21% |
| Michigan average: | 5.95% |
0.01% of residents moved to foreign countries ($55 average AGI)
Oakland County: 0.01% Michigan average: 0.00%
Top counties to which taxpayers relocated from this county between 2020 and 2021:
| to Wayne County, MI | |
| to Macomb County, MI | |
| to Genesee County, MI |
| Businesses in Beverly Hills, MI | ||||
| Name | Count | Name | Count | |
|---|---|---|---|---|
| AT&T | 1 | GameStop | 1 | |
| Ace Hardware | 1 | McDonald's | 1 | |
| Bed Bath & Beyond | 1 | Starbucks | 1 | |
| FedEx | 1 | Taco Bell | 1 | |
Strongest AM radio stations in Beverly Hills:
- WXYT (1270 AM; 50 kW; DETROIT, MI; Owner: INFINITY BROADCASTING CORP. OF DETROIT)
- WWJ (950 AM; 50 kW; DETROIT, MI; Owner: INFINITY BROADCASTING OPERATIONS, INC.)
- WJR (760 AM; 50 kW; DETROIT, MI; Owner: ABC, INC.)
- WCHB (1200 AM; 50 kW; TAYLOR, MI; Owner: RADIO ONE OF DETROIT, LLC)
- WDFN (1130 AM; 50 kW; DETROIT, MI; Owner: AMFM RADIO LICENSES, L.L.C.)
- WFDF (910 AM; 50 kW; FLINT, MI; Owner: ABC, INC.)
- WUFL (1030 AM; daytime; 5 kW; STERLING HEIGHTS, MI; Owner: FAMILY LIFE BROADCASTING SYSTEM)
- WEXL (1340 AM; 1 kW; ROYAL OAK, MI; Owner: WMUZ RADIO, INC.)
- WDEO (990 AM; 9 kW; YPSILANTI, MI; Owner: WORD BROADCASTERS, INC.)
- WOAP (1080 AM; 50 kW; OWOSSO, MI)
- WXDX (1310 AM; 5 kW; DEARBORN, MI; Owner: AMFM RADIO LICENSES, L.L.C.)
- WTKA (1050 AM; 10 kW; ANN ARBOR, MI; Owner: CAPSTAR TX LIMITED PARTNERSHIP)
- WQBH (1400 AM; 1 kW; DETROIT, MI; Owner: QUEEN'S BROADCASTING CORP.)
Strongest FM radio stations in Beverly Hills:
- WKRK-FM (97.1 FM; DETROIT, MI; Owner: INFINITY BROADCASTING OPERATIONS, INC.)
- WRIF (101.1 FM; DETROIT, MI; Owner: GREATER BOSTON RADIO, INC.)
- WYCD (99.5 FM; DETROIT, MI; Owner: INFINITY BROADCASTING CORPORATION OF MICHIGAN)
- WDTJ (105.9 FM; DETROIT, MI; Owner: RADIO ONE OF DETROIT, LLC)
- WDRQ (93.1 FM; DETROIT, MI; Owner: ABC, INC.)
- WMGC-FM (105.1 FM; DETROIT, MI; Owner: GREATER BOSTON RADIO, INC.)
- WCSX (94.7 FM; BIRMINGHAM, MI; Owner: GREATER BOSTON RADIO, INC.)
- WDVD (96.3 FM; DETROIT, MI; Owner: ABC, INC.)
- WKQI (95.5 FM; DETROIT, MI; Owner: AMFM RADIO LICENSES, L.L.C.)
- WOMC (104.3 FM; DETROIT, MI; Owner: INFINITY BROADCASTING CORPORATION OF MICHIGAN)
- WNIC (100.3 FM; DEARBORN, MI; Owner: AMFM RADIO LICENSES, L.L.C.)
- WBFH (88.1 FM; BLOOMFIELD HILLS, MI; Owner: BLOOMFIELD HILLS SCHOOL DISTRICT)
- WJLB (97.9 FM; DETROIT, MI; Owner: AMFM RADIO LICENSES, L.L.C.)
- WVMV (98.7 FM; DETROIT, MI; Owner: INFINITY BROADCASTING OPERATIONS, INC.)
- WMUZ (103.5 FM; DETROIT, MI; Owner: WMUZ RADIO, INC.)
- WDTR-FM (90.9 FM; DETROIT, MI; Owner: BOARD OF EDUCATION, CITY OF DETROIT)
- WMXD (92.3 FM; DETROIT, MI; Owner: AMFM RADIO LICENSES, L.L.C.)
- WDTW (106.7 FM; DETROIT, MI; Owner: AMFM RADIO LICENSES, L.L.C.)
- WDET-FM (101.9 FM; DETROIT, MI; Owner: WAYNE STATE UNIVERSITY)
- WGPR (107.5 FM; DETROIT, MI; Owner: WGPR, INC.)
TV broadcast stations around Beverly Hills:
- WXYZ-TV (Channel 7; DETROIT, MI; Owner: CHANNEL 7 OF DETROIT, INC.)
- WDIV-TV (Channel 4; DETROIT, MI; Owner: POST-NEWSWEEK STATIONS, MICHIGAN, INC.)
- WJBK (Channel 2; DETROIT, MI; Owner: FOX TELEVISION STATIONS, INC.)
- WKBD (Channel 50; DETROIT, MI; Owner: VIACOM STATIONS GROUP OF DETROIT INC.)
- WWJ-TV (Channel 62; DETROIT, MI; Owner: CBS BROADCASTING INC.)
- WDWB (Channel 20; DETROIT, MI; Owner: WXON LICENSE, INC.)
- WTVS (Channel 56; DETROIT, MI; Owner: DETROIT EDUC. TV FOUNDATION)
- WBXD-CA (Channel 5; DETROIT, MI; Owner: THE BOX WORLDWIDE LLC)
- W33BY (Channel 68; DETROIT, MI; Owner: HIGHLAND PARK BROADCASTING, L.P.)
- WADL (Channel 38; MOUNT CLEMENS, MI; Owner: ADELL BROADCASTING CORPORATION)
- WLPC-LP (Channel 26; DETROIT, MI; Owner: GLENN R. AND KARIN A. PLUMMER)
- WFUM (Channel 28; FLINT, MI; Owner: UNIVERSITY OF MICHIGAN)
- WDWO-CA (Channel 18; DETROIT, MI; Owner: TCT OF MICHIGAN, INC.)
- WPXD (Channel 31; ANN ARBOR, MI; Owner: PAXSON COMMUNICATIONS LICENSE COMPANY, LLC)
- W48AV (Channel 48; DETROIT, MI; Owner: PAXSON COMMUNICATIONS LICENSE COMPANY, LLC)
- National Bridge Inventory (NBI) Statistics
- 7Number of bridges
- 62ft / 19.2mTotal length
- $113,000Total costs
- 57,501Total average daily traffic
- 1,939Total average daily truck traffic
- 67,229Total future (year 2010) average daily traffic
FCC Registered Antenna Towers:
14 (See the full list of FCC Registered Antenna Towers in Beverly Hills)FCC Registered Broadcast Land Mobile Towers:
2- 31001 Lahser Rd (Lat: 42.516694 Lon: -83.262722), Call Sign: KNGQ668,
Assigned Frequencies: 158.985 MHz, 159.045 MHz, Grant Date: 04/05/2023, Expiration Date: 05/23/2033, Registrant: Road Commission For Oakland Co, 2420 Pontiac Lake, Waterford, MI 48328, Phone: (248) 858-4804, Email:
- 31655 Southfield Road (Lat: 42.521944 Lon: -83.223611), Call Sign: WQBL234,
Assigned Frequencies: 30.8400 MHz, 154.540 MHz, 33.4000 MHz, 33.1600 MHz, 31.2400 MHz, 468.487 MHz, 468.762 MHz, 468.837 MHz, 469.637 MHz, 469.662 MHz... (+21 more), Grant Date: 10/28/2004, Expiration Date: 10/28/2014, Cancellation Date: 01/03/2015, Certifier: Beth Cotner, Registrant: Dolfen Consulting Group, 95 Willow Lane, Bristol, IL 60512-9711, Phone: (630) 553-5886, Fax: (630) 566-1755, Email:
FCC Registered Amateur Radio Licenses:
33 (See the full list of FCC Registered Amateur Radio Licenses in Beverly Hills)FAA Registered Aircraft:
3- Aircraft: CESSNA 182E (Category: Land, Seats: 4, Weight: Up to 12,499 Pounds, Speed: 119 mph), Engine: CONT MOTOR O-470 SERIES (230 HP) (Reciprocating)
N-Number: 3052Y, N3052Y, N-3052Y, Serial Number: 18254052, Year manufactured: 1962, Airworthiness Date: 03/31/1962, Certificate Issue Date: 08/26/2013
Registrant (Individual): David M Sullivan, 31240 Stafford St, Beverly Hills, MI 48025 - Aircraft: CESSNA 150K (Category: Land, Seats: 2, Weight: Up to 12,499 Pounds, Speed: 90 mph), Engine: CONT MOTOR 0-200 SERIES (100 HP) (Reciprocating)
N-Number: 6295G, N6295G, N-6295G, Serial Number: 15071795, Year manufactured: 1970, Airworthiness Date: 03/05/1970, Certificate Issue Date: 08/26/2016
Registrant (Co-Owned): Lawrence R Cushman, 32245 Southfield Rd, Beverly Hills, MI 48025, Other Owners: Geraldine E Cushman - Aircraft: CAREW EVAN L KIS TR-1 (Category: Land, Seats: 2, Weight: Up to 12,499 Pounds), Engine: Reciprocating
N-Number: 919EC, N919EC, N-919EC, Serial Number: 076, Certificate Issue Date: 02/28/2002
Registrant (Individual): Evan L Carew, 17371 Beechwood Ave, Beverly Hills, MI 48025
Deregistered: Cancel Date: 03/16/2018
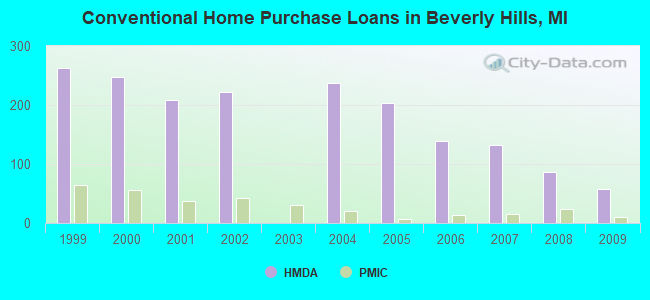
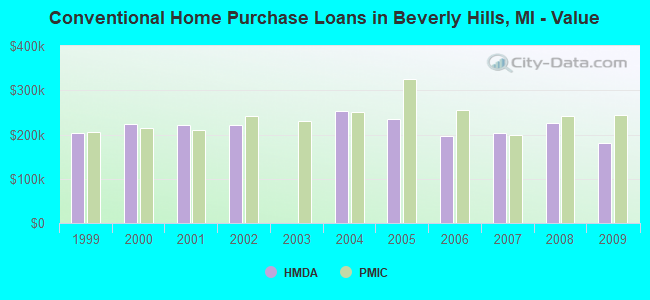
| Home Mortgage Disclosure Act Aggregated Statistics For Year 2009 (Based on 2 full and 1 partial tracts) | ||||||||||
| A) FHA, FSA/RHS & VA Home Purchase Loans | B) Conventional Home Purchase Loans | C) Refinancings | D) Home Improvement Loans | F) Non-occupant Loans on < 5 Family Dwellings (A B C & D) | ||||||
|---|---|---|---|---|---|---|---|---|---|---|
| Number | Average Value | Number | Average Value | Number | Average Value | Number | Average Value | Number | Average Value | |
| LOANS ORIGINATED | 40 | $189,442 | 57 | $180,631 | 248 | $215,141 | 7 | $64,840 | 8 | $134,658 |
| APPLICATIONS APPROVED, NOT ACCEPTED | 2 | $128,545 | 5 | $197,236 | 30 | $245,587 | 1 | $12,990 | 1 | $109,350 |
| APPLICATIONS DENIED | 4 | $140,628 | 10 | $204,645 | 89 | $240,957 | 10 | $61,214 | 2 | $171,400 |
| APPLICATIONS WITHDRAWN | 5 | $174,172 | 4 | $109,742 | 57 | $224,325 | 1 | $15,860 | 2 | $133,970 |
| FILES CLOSED FOR INCOMPLETENESS | 1 | $134,920 | 1 | $33,390 | 20 | $254,550 | 1 | $238,720 | 0 | $0 |
Detailed HMDA statistics for the following Tracts: 1580.00 , 1581.00, 1582.00
| Private Mortgage Insurance Companies Aggregated Statistics For Year 2009 (Based on 2 full and 1 partial tracts) | ||||
| A) Conventional Home Purchase Loans | B) Refinancings | |||
|---|---|---|---|---|
| Number | Average Value | Number | Average Value | |
| LOANS ORIGINATED | 11 | $244,838 | 6 | $275,858 |
| APPLICATIONS APPROVED, NOT ACCEPTED | 2 | $216,845 | 6 | $326,592 |
| APPLICATIONS DENIED | 3 | $182,593 | 0 | $0 |
| APPLICATIONS WITHDRAWN | 0 | $0 | 0 | $0 |
| FILES CLOSED FOR INCOMPLETENESS | 0 | $0 | 0 | $0 |
Detailed PMIC statistics for the following Tracts: 1580.00 , 1581.00, 1582.00
2002 - 2018 National Fire Incident Reporting System (NFIRS) incidents
- Fire incident types reported to NFIRS in Beverly Hills, MI
- 18360.0%Structure Fires
- 5016.4%Other
- 4916.1%Outside Fires
- 237.5%Mobile Property/Vehicle Fires
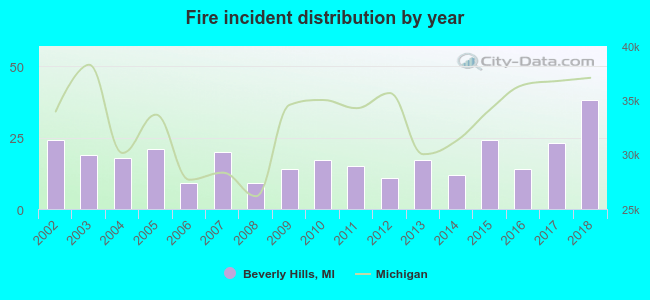 Based on the data from the years 2002 - 2018 the average number of fire incidents per year is 18. The highest number of fires - 38 took place in 2018, and the least - 9 in 2006. The data has a growing trend.
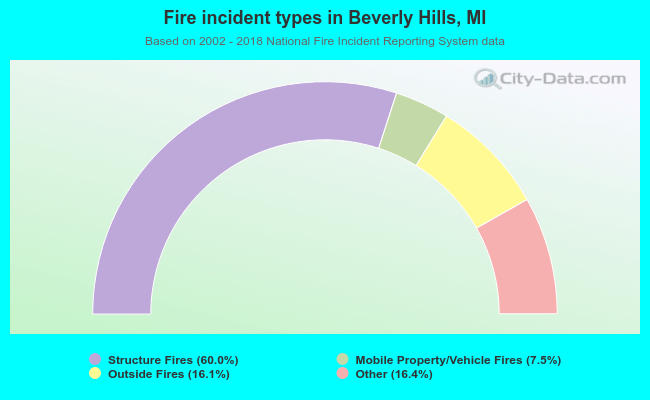 When looking into fire subcategories, the most reports belonged to: Structure Fires (60.0%), and Other (16.4%).
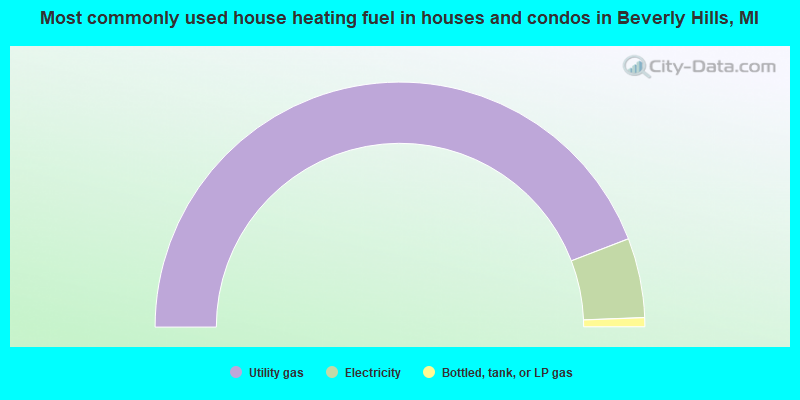
- 88.3%Utility gas
- 10.5%Electricity
- 1.2%Bottled, tank, or LP gas
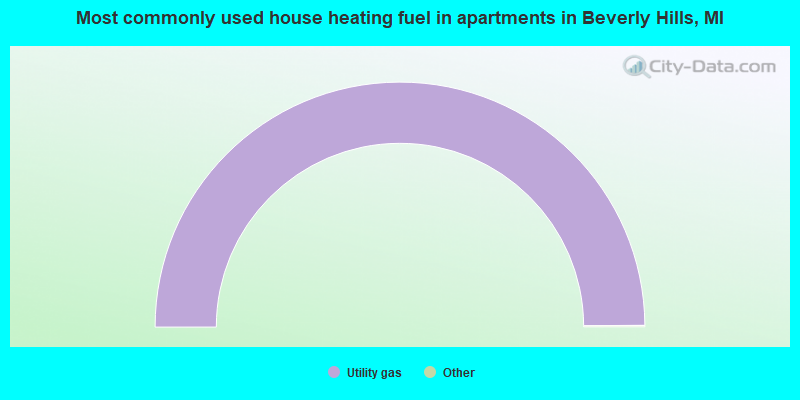
- 100.0%Utility gas
Beverly Hills compared to Michigan state average:
- Median household income significantly above state average.
- Median house value above state average.
- Unemployed percentage significantly below state average.
- Black race population percentage below state average.
- Renting percentage significantly below state average.
- Length of stay since moving in above state average.
- Number of rooms per house above state average.
- Percentage of population with a bachelor's degree or higher significantly above state average.
Beverly Hills on our top lists:
- #45 on the list of "Top 101 cities with largest percentage of females in occupations: legal occupations (population 5,000+)"
- #80 on the list of "Top 101 cities with largest percentage of females in occupations: business and financial operations occupations (population 5,000+)"
- #100 on the list of "Top 101 cities with the most people taking a bus, a trolley bus, a streetcar, or a trolley car to work (population 5,000+)"
- #6 on the list of "Top 101 counties with the highest percentage of residents that visited a dentist within the past year"
- #12 on the list of "Top 101 counties with the most Orthodox congregations"
- #14 on the list of "Top 101 counties with the most Orthodox adherents"
- #38 on the list of "Top 101 counties with the most Mainline Protestant adherents"
- #39 on the list of "Top 101 counties with the most Catholic adherents"

|
|
Total of 627 patent applications in 2008-2024.