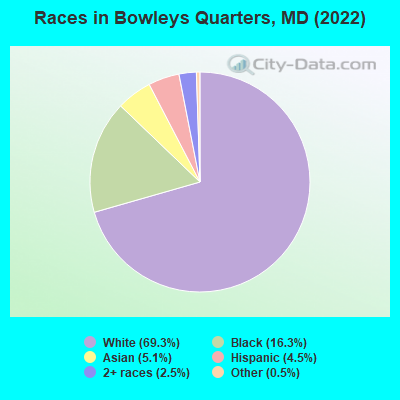
Percentage of residents living in poverty in 2022: 8.6%
(3.6% for White Non-Hispanic residents, 24.6% for Black residents, 5.0% for Hispanic or Latino residents, 9.2% for two or more races residents)
Latest news from Bowleys Quarters, MD collected exclusively by city-data.com from local newspapers, TV, and radio stations
Ancestries: German (12.8%), Irish (8.6%), English (6.3%), American (5.8%), Italian (3.4%), Polish (2.7%).
Current Local Time: EST time zone
Elevation: 20 feet
Land area: 3.23 square miles.
Population density: 2,091 people per square mile (low).
705 residents are foreign born (3.4% Asia, 2.9% Africa, 2.1% Latin America, 1.3% Europe).
This place:
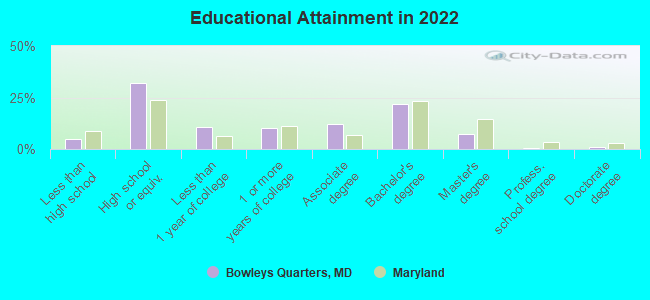
10.5%
Maryland:
15.7%
Median real estate property taxes paid for housing units with mortgages in 2022: $3,559 (1.0%) Median real estate property taxes paid for housing units with no mortgage in 2022: $4,037 (1.2%)
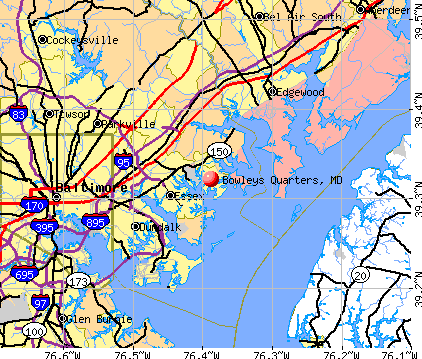
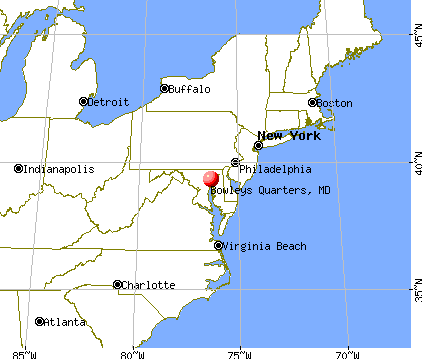
Nearest city with pop. 50,000+: Dundalk, MD (7.3 miles , pop. 62,306).
Nearest city with pop. 200,000+: Baltimore, MD (12.3 miles , pop. 651,154).
Nearest city with pop. 1,000,000+: Philadelphia, PA (81.1 miles , pop. 1,517,550).
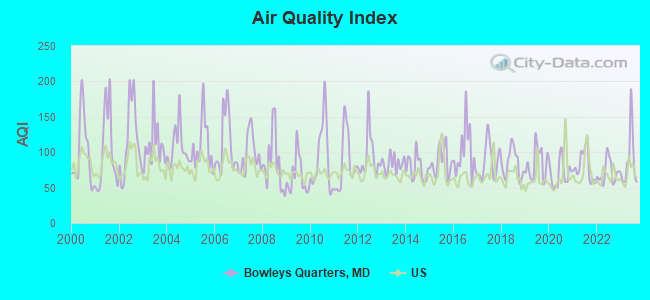
Air Quality Index (AQI) level in 2023 was 87.0. This is about average.
City:
87.0
U.S.:
72.6
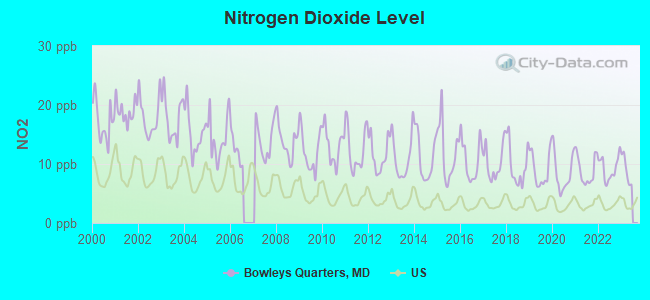
Nitrogen Dioxide (NO2) [ppb] level in 2022 was 9.24. This is significantly worse than average.Closest monitor was 1.5 miles away from the city center.
City:
9.24
U.S.:
5.11
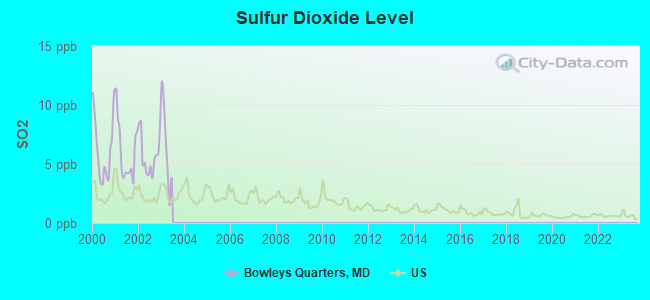
Sulfur Dioxide (SO2) [ppb] level in 2002 was 5.75. This is significantly worse than average.Closest monitor was 1.5 miles away from the city center.
City:
5.75
U.S.:
1.51
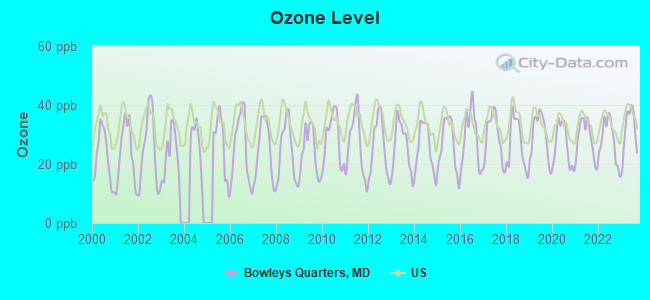
Ozone [ppb] level in 2023 was 31.4. This is about average.Closest monitor was 4.7 miles away from the city center.
City:
31.4
U.S.:
33.3
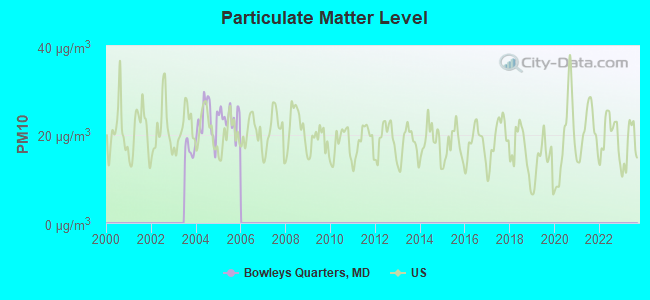
Particulate Matter (PM10) [µg/m3] level in 2005 was 23.8. This is worse than average.Closest monitor was 4.7 miles away from the city center.
City:
23.8
U.S.:
19.2
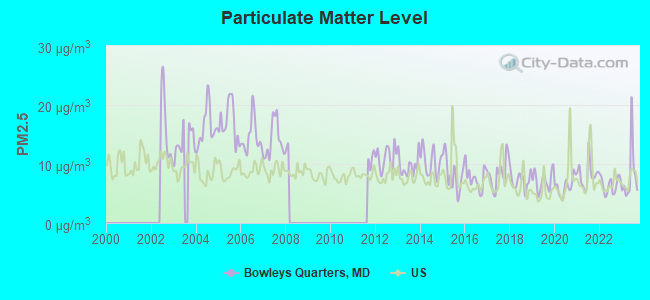
Particulate Matter (PM2.5) [µg/m3] level in 2023 was 8.03. This is about average.Closest monitor was 4.7 miles away from the city center.
City:
8.03
U.S.:
8.11
Tornado activity:
Bowleys Quarters-area historical tornado activity is slightly above Maryland state average. It is 15% greater than the overall U.S. average.
On 6/9/1961, a category F3 (max. wind speeds 158-206 mph) tornado 13.3 miles away from the Bowleys Quarters place center causedbetween $50,000 and $500,000 in damages.
On 9/24/2001, a category F3 tornado 24.5 miles away from the place center killed 2 peopleand injured 55 peopleand caused $101 million in damages.
Earthquake activity:
Bowleys Quarters-area historical earthquake activity is significantly above Maryland state average. It is 60% smaller than the overall U.S. average.
On 8/23/2011 at 17:51:04, a magnitude 5.8 (5.8 MW, Depth: 3.7 mi, Class: Moderate, Intensity: VI - VII) earthquake occurred 128.6 miles away from Bowleys Quarters center On 1/16/1994 at 01:49:16, a magnitude 4.6 (4.6 MB, 4.6 LG, Depth: 3.1 mi, Class: Light, Intensity: IV - V) earthquake occurred 72.2 miles away from Bowleys Quarters center On 9/25/1998 at 19:52:52, a magnitude 5.2 (4.8 MB, 4.3 MS, 5.2 LG, 4.5 MW, Depth: 3.1 mi) earthquake occurred 258.9 miles away from the city center On 8/25/2011 at 05:07:52, a magnitude 4.5 (4.5 ML, Depth: 4.2 mi) earthquake occurred 127.7 miles away from the city center On 1/16/1994 at 00:42:43, a magnitude 4.2 (4.2 MB, 4.0 LG, Depth: 3.1 mi) earthquake occurred 72.4 miles away from the city center On 11/30/2017 at 21:47:31, a magnitude 4.1 (4.1 MW, Depth: 6.1 mi) earthquake occurred 51.9 miles away from Bowleys Quarters center Magnitude types: regional Lg-wave magnitude (LG), body-wave magnitude (MB), local magnitude (ML), surface-wave magnitude (MS), moment magnitude (MW)
Natural disasters:
The number of natural disasters in Baltimore County (21) is greater than the US average (15). Major Disasters (Presidential) Declared: 15 Emergencies Declared: 5
Causes of natural disasters: Hurricanes: 6, Winter Storms: 5, Floods: 4, Snowstorms: 4, Storms: 4, Tropical Storms: 2, Blizzard: 1, Heavy Rain: 1, Snow: 1, Snowfall: 1, Tornado: 1, Other: 1 (Note: some incidents may be assigned to more than one category).
Hospitals and medical centers near Bowleys Quarters:
IVY HALL GERIATRIC REHABILITATION CENTER (Nursing Home, about 4 miles away; BALTIMORE, MD)
IVY HALL NURSING AND CONV HOME (Nursing Home, about 4 miles away; MIDDLE RIVER, MD)
MEDSTAR HEALTH VNA (Home Health Center, about 5 miles away; BALTIMORE, MD)
DAVITA - WHITE SQUARE (Dialysis Facility, about 5 miles away; BALTIMORE, MD)
FMC OF PORTER DIALYSIS - ROSEDALE (Dialysis Facility, about 5 miles away; ROSEDALE, MD)
THE COMMUNITY HOSPICE OF MARYLAND (Hospital, about 5 miles away; BALTIMORE, MD)
MANOR CARE DIALYSIS (Dialysis Facility, about 6 miles away; BALTIMORE, MD)
Amtrak stations near Bowleys Quarters:
13 miles: BALTIMORE (1500 N. CHARLES ST.) . Services: ticket office, fully wheelchair accessible, enclosed waiting area, public restrooms, public payphones, full-service food facilities, snack bar, vending machines, ATM, paid short-term parking, paid long-term parking, call for car rental service, taxi stand, public transit connection.
18 miles: ABERDEEN (S. PHILADELPHIA & BELAIR AVE.) . Services: free short-term parking, intercity bus service.
19 miles: BWI AIRPORT RAIL STATION (BALTIMORE, AMTRAK WAY) . Services: ticket office, fully wheelchair accessible, enclosed waiting area, public restrooms, public payphones, snack bar, ATM, paid short-term parking, paid long-term parking, call for car rental service, call for taxi service, public transit connection.
Colleges/universities with over 2000 students nearest to Bowleys Quarters:
The Community College of Baltimore County (about 6 miles; Baltimore, MD; Full-time enrollment: 15,217)
All-State Career-Baltimore (about 10 miles; Baltimore, MD; FT enrollment: 2,287)
Morgan State University (about 11 miles; Baltimore, MD; FT enrollment: 7,113)
University of Baltimore (about 13 miles; Baltimore, MD; FT enrollment: 3,592)
Johns Hopkins University (about 13 miles; Baltimore, MD; FT enrollment: 20,568)
Maryland Institute College of Art (about 13 miles; Baltimore, MD; FT enrollment: 2,267)
Loyola University Maryland (about 13 miles; Baltimore, MD; FT enrollment: 5,215)
Churches in Bowleys Quarters include: Saint Matthew Lutheran Church (A), Peninsula Baptist Church (B), Piney Grove United Methodist Church (C). Display/hide their locations on the map
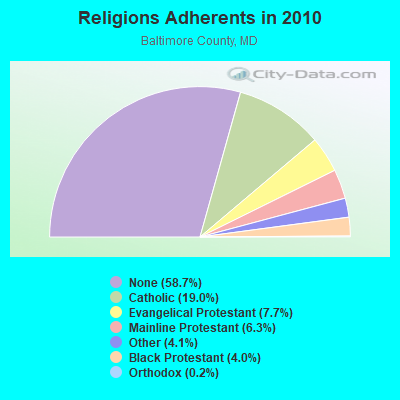
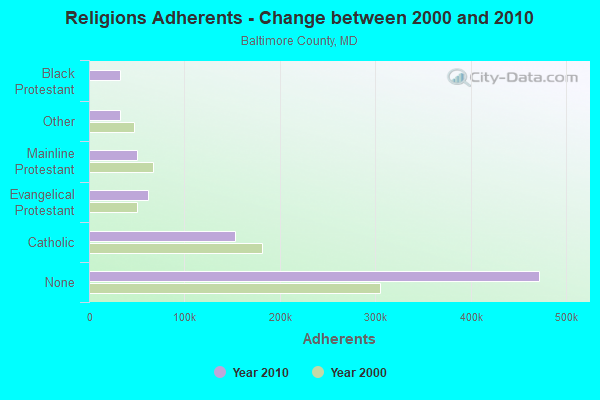
Religion statistics for Bowleys Quarters, MD (based on Baltimore County data)
Religion
Adherents
Congregations
Catholic
153,243
34
Evangelical Protestant
62,367
232
Mainline Protestant
50,484
167
Other
32,628
54
Black Protestant
32,442
37
Orthodox
1,663
3
None
472,202
-
Source: Clifford Grammich, Kirk Hadaway, Richard Houseal, Dale E.Jones, Alexei Krindatch, Richie Stanley and Richard H.Taylor. 2012. 2010 U.S.Religion Census: Religious Congregations & Membership Study. Association of Statisticians of American Religious Bodies. Jones, Dale E., et al. 2002. Congregations and Membership in the United States 2000. Nashville, TN: Glenmary Research Center. Graphs represent county-level data
Bowleys Qtrs Rd & Susquehannah Ave (Lat: 39.326500 Lon: -76.394972), Call Sign: KGC667, Licensee ID: L00005453, Assigned Frequencies: 46.4600 MHz, Grant Date: 04/19/2014, Expiration Date: 07/06/2024, Registrant: County Of Baltimore
FCC Registered Amateur Radio Licenses:
1
Call Sign: N3GTF, Licensee ID: L01408973, Grant Date: 01/30/2019, Expiration Date: 09/14/2028, Certifier: Richard G Muth, Registrant: Richard G Muth, 3803 Clarks Point Rd, Bowleys Quarters, MD 21220
Home Mortgage Disclosure Act Aggregated Statistics For Year 2009 (Based on 2 partial tracts)
A) FHA, FSA/RHS & VA Home Purchase Loans
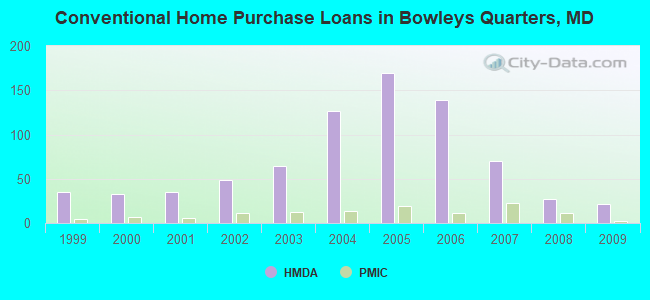
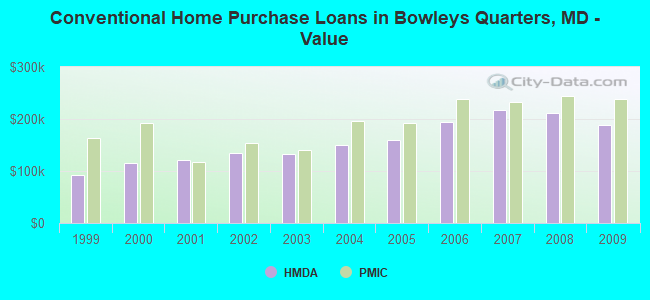
B) Conventional Home Purchase Loans
C) Refinancings
D) Home Improvement Loans
F) Non-occupant Loans on < 5 Family Dwellings (A B C & D)
G) Loans On Manufactured Home Dwelling (A B C & D)
Number
Average Value
Number
Average Value
Number
Average Value
Number
Average Value
Number
Average Value
Number
Average Value
LOANS ORIGINATED
32
$211,785
22
$188,962
142
$214,609
8
$64,941
13
$230,569
6
$43,988
APPLICATIONS APPROVED, NOT ACCEPTED
3
$147,473
1
$197,940
15
$190,364
2
$25,790
1
$109,630
1
$89,120
APPLICATIONS DENIED
1
$246,880
4
$167,200
54
$245,003
7
$38,367
9
$262,098
1
$48,260
APPLICATIONS WITHDRAWN
3
$235,413
3
$272,280
34
$224,167
3
$90,927
2
$433,805
0
$0
FILES CLOSED FOR INCOMPLETENESS
0
$0
0
$0
7
$235,517
0
$0
0
$0
0
$0
Aggregated Statistics For Year 2008 (Based on 2 partial tracts)
A) FHA, FSA/RHS & VA Home Purchase Loans
B) Conventional Home Purchase Loans
C) Refinancings
D) Home Improvement Loans
F) Non-occupant Loans on < 5 Family Dwellings (A B C & D)
G) Loans On Manufactured Home Dwelling (A B C & D)
Number
Average Value
Number
Average Value
Number
Average Value
Number
Average Value
Number
Average Value
Number
Average Value
LOANS ORIGINATED
16
$215,082
27
$211,780
108
$216,559
11
$53,561
8
$209,202
7
$50,506
APPLICATIONS APPROVED, NOT ACCEPTED
1
$127,430
1
$135,410
16
$178,706
5
$27,356
2
$277,610
1
$33,980
APPLICATIONS DENIED
0
$0
8
$281,686
64
$225,930
11
$61,197
1
$507,560
3
$29,217
APPLICATIONS WITHDRAWN
3
$231,057
2
$255,700
24
$221,397
0
$0
1
$135,970
0
$0
FILES CLOSED FOR INCOMPLETENESS
0
$0
2
$217,855
6
$272,302
0
$0
2
$267,675
0
$0
Aggregated Statistics For Year 2007 (Based on 2 partial tracts)
A) FHA, FSA/RHS & VA Home Purchase Loans
B) Conventional Home Purchase Loans
C) Refinancings
D) Home Improvement Loans
F) Non-occupant Loans on < 5 Family Dwellings (A B C & D)
G) Loans On Manufactured Home Dwelling (A B C & D)
Number
Average Value
Number
Average Value
Number
Average Value
Number
Average Value
Number
Average Value
Number
Average Value
LOANS ORIGINATED
10
$227,913
70
$216,469
137
$210,804
22
$122,338
15
$284,328
13
$47,232
APPLICATIONS APPROVED, NOT ACCEPTED
0
$0
15
$251,479
26
$198,299
8
$72,844
1
$998,080
2
$60,810
APPLICATIONS DENIED
1
$262,940
13
$216,158
85
$222,636
10
$30,292
9
$193,163
2
$53,670
APPLICATIONS WITHDRAWN
0
$0
13
$181,787
38
$217,296
3
$104,840
1
$89,420
1
$21,670
FILES CLOSED FOR INCOMPLETENESS
0
$0
3
$299,543
15
$217,422
0
$0
1
$204,320
0
$0
Aggregated Statistics For Year 2006 (Based on 2 partial tracts)
A) FHA, FSA/RHS & VA Home Purchase Loans
B) Conventional Home Purchase Loans
C) Refinancings
D) Home Improvement Loans
E) Loans on Dwellings For 5+ Families
F) Non-occupant Loans on < 5 Family Dwellings (A B C & D)
G) Loans On Manufactured Home Dwelling (A B C & D)
Number
Average Value
Number
Average Value
Number
Average Value
Number
Average Value
Number
Average Value
Number
Average Value
Number
Average Value
LOANS ORIGINATED
10
$205,392
139
$193,528
202
$204,207
27
$108,447
1
$509,010
14
$217,062
12
$53,877
APPLICATIONS APPROVED, NOT ACCEPTED
1
$140,960
14
$151,547
32
$159,752
7
$97,297
0
$0
2
$114,680
2
$54,905
APPLICATIONS DENIED
2
$261,630
20
$194,886
89
$190,319
18
$68,812
0
$0
10
$203,493
3
$51,703
APPLICATIONS WITHDRAWN
0
$0
18
$201,194
86
$187,536
2
$87,340
0
$0
5
$186,116
0
$0
FILES CLOSED FOR INCOMPLETENESS
0
$0
6
$212,160
22
$212,184
0
$0
0
$0
0
$0
0
$0
Aggregated Statistics For Year 2005 (Based on 2 partial tracts)
A) FHA, FSA/RHS & VA Home Purchase Loans
B) Conventional Home Purchase Loans
C) Refinancings
D) Home Improvement Loans
F) Non-occupant Loans on < 5 Family Dwellings (A B C & D)
G) Loans On Manufactured Home Dwelling (A B C & D)
Number
Average Value
Number
Average Value
Number
Average Value
Number
Average Value
Number
Average Value
Number
Average Value
LOANS ORIGINATED
9
$198,617
170
$159,126
249
$177,263
27
$128,891
18
$196,222
12
$40,623
APPLICATIONS APPROVED, NOT ACCEPTED
0
$0
19
$139,313
25
$158,851
8
$78,908
1
$289,580
3
$51,237
APPLICATIONS DENIED
0
$0
37
$109,686
96
$174,259
19
$86,016
3
$198,707
6
$41,610
APPLICATIONS WITHDRAWN
2
$210,010
31
$142,005
98
$163,897
11
$148,377
4
$185,152
0
$0
FILES CLOSED FOR INCOMPLETENESS
0
$0
1
$265,540
25
$196,660
0
$0
1
$91,120
0
$0
Aggregated Statistics For Year 2004 (Based on 2 partial tracts)
A) FHA, FSA/RHS & VA Home Purchase Loans
B) Conventional Home Purchase Loans
C) Refinancings
D) Home Improvement Loans
F) Non-occupant Loans on < 5 Family Dwellings (A B C & D)
G) Loans On Manufactured Home Dwelling (A B C & D)
Number
Average Value
Number
Average Value
Number
Average Value
Number
Average Value
Number
Average Value
Number
Average Value
LOANS ORIGINATED
67
$181,070
126
$150,641
197
$151,931
16
$109,369
12
$230,621
11
$39,077
APPLICATIONS APPROVED, NOT ACCEPTED
1
$318,930
9
$142,911
31
$160,721
5
$34,532
2
$150,920
0
$0
APPLICATIONS DENIED
5
$188,206
21
$142,773
80
$136,321
19
$63,337
1
$400,810
6
$43,600
APPLICATIONS WITHDRAWN
6
$176,670
9
$178,163
75
$138,082
4
$147,058
1
$543,610
1
$35,450
FILES CLOSED FOR INCOMPLETENESS
1
$160,180
4
$200,658
11
$180,930
1
$19,490
0
$0
0
$0
Aggregated Statistics For Year 2003 (Based on 2 partial tracts)
A) FHA, FSA/RHS & VA Home Purchase Loans
B) Conventional Home Purchase Loans
C) Refinancings
D) Home Improvement Loans
F) Non-occupant Loans on < 5 Family Dwellings (A B C & D)
Number
Average Value
Number
Average Value
Number
Average Value
Number
Average Value
Number
Average Value
LOANS ORIGINATED
48
$149,938
64
$132,970
325
$130,433
7
$21,069
9
$121,597
APPLICATIONS APPROVED, NOT ACCEPTED
1
$224,210
8
$98,656
53
$124,888
6
$20,787
1
$72,880
APPLICATIONS DENIED
6
$161,510
20
$73,308
73
$127,540
10
$35,556
4
$94,820
APPLICATIONS WITHDRAWN
4
$173,655
8
$109,596
83
$136,880
0
$0
3
$72,193
FILES CLOSED FOR INCOMPLETENESS
1
$117,460
3
$282,147
16
$117,432
0
$0
1
$141,370
Aggregated Statistics For Year 2002 (Based on 1 partial tract)
A) FHA, FSA/RHS & VA Home Purchase Loans
B) Conventional Home Purchase Loans
C) Refinancings
D) Home Improvement Loans
F) Non-occupant Loans on < 5 Family Dwellings (A B C & D)
Number
Average Value
Number
Average Value
Number
Average Value
Number
Average Value
Number
Average Value
LOANS ORIGINATED
41
$132,288
49
$135,139
150
$128,877
10
$21,025
10
$126,350
APPLICATIONS APPROVED, NOT ACCEPTED
0
$0
5
$99,366
24
$115,406
2
$24,130
1
$67,460
APPLICATIONS DENIED
2
$114,485
20
$49,930
49
$119,754
7
$12,661
1
$85,190
APPLICATIONS WITHDRAWN
7
$133,791
3
$100,777
42
$114,624
1
$72,880
1
$53,180
FILES CLOSED FOR INCOMPLETENESS
0
$0
1
$274,760
10
$160,818
0
$0
0
$0
Aggregated Statistics For Year 2001 (Based on 1 partial tract)
A) FHA, FSA/RHS & VA Home Purchase Loans
B) Conventional Home Purchase Loans
C) Refinancings
D) Home Improvement Loans
F) Non-occupant Loans on < 5 Family Dwellings (A B C & D)
Number
Average Value
Number
Average Value
Number
Average Value
Number
Average Value
Number
Average Value
LOANS ORIGINATED
31
$112,410
35
$121,637
112
$118,048
6
$15,182
7
$85,256
APPLICATIONS APPROVED, NOT ACCEPTED
1
$240,780
5
$79,474
11
$108,373
2
$21,175
1
$87,650
APPLICATIONS DENIED
1
$156,580
15
$46,614
48
$92,684
11
$16,070
0
$0
APPLICATIONS WITHDRAWN
3
$119,653
3
$97,497
42
$130,357
1
$73,860
0
$0
FILES CLOSED FOR INCOMPLETENESS
0
$0
3
$79,770
3
$68,443
0
$0
0
$0
Aggregated Statistics For Year 2000 (Based on 1 partial tract)
A) FHA, FSA/RHS & VA Home Purchase Loans
B) Conventional Home Purchase Loans
C) Refinancings
D) Home Improvement Loans
F) Non-occupant Loans on < 5 Family Dwellings (A B C & D)
Number
Average Value
Number
Average Value
Number
Average Value
Number
Average Value
Number
Average Value
LOANS ORIGINATED
22
$105,821
33
$116,311
28
$95,104
8
$23,081
1
$261,960
APPLICATIONS APPROVED, NOT ACCEPTED
0
$0
10
$64,997
10
$94,442
5
$17,332
0
$0
APPLICATIONS DENIED
1
$81,740
25
$54,578
24
$76,589
10
$23,734
2
$52,935
APPLICATIONS WITHDRAWN
1
$119,650
5
$100,450
16
$72,044
2
$29,790
0
$0
FILES CLOSED FOR INCOMPLETENESS
0
$0
0
$0
2
$128,025
0
$0
0
$0
Aggregated Statistics For Year 1999 (Based on 1 partial tract)
A) FHA, FSA/RHS & VA Home Purchase Loans
B) Conventional Home Purchase Loans
C) Refinancings
D) Home Improvement Loans
F) Non-occupant Loans on < 5 Family Dwellings (A B C & D)
#19 on the list of "Top 101 cities with the most people walking to work (population 5,000+)"
#72 on the list of "Top 101 cities that people commute from (largest negative percentage daily daytime population change due to commuting) (population 5,000+)"
#14 on the list of "Top 101 counties with the highest surface withdrawal of fresh water for public supply"
#15 on the list of "Top 101 counties with the largest increase in the number of births per 1000 residents 2000-2006 to 2007-2013 (pop 50,000+)"
#22 on the list of "Top 101 counties with the highest total withdrawal of fresh water for public supply"
#29 on the list of "Top 101 counties with the most Black Protestant adherents"
#35 on the list of "Top 101 counties with the lowest ground withdrawal of fresh water for public supply (pop. 50,000+)"


 Recent articles from our blog. Our writers, many of them Ph.D. graduates or candidates, create easy-to-read articles on a wide variety of topics.

 (7.3 miles