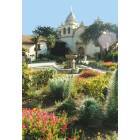
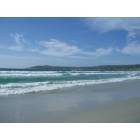
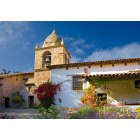
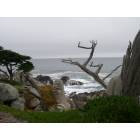
Carmel-by-the-Sea, California Submit your own pictures of this city and show them to the world
OSM Map
General Map
Google Map
MSN Map
OSM Map
General Map
Google Map
MSN Map
OSM Map
General Map
Google Map
MSN Map
OSM Map
General Map
Google Map
MSN Map
Please wait while loading the map...
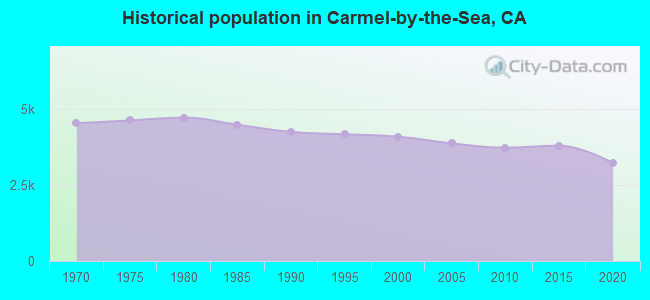
Population in 2022: 3,146 (100% urban, 0% rural). Population change since 2000: -22.9%Males: 1,473 Females: 1,673
March 2022 cost of living index in Carmel-by-the-Sea: 123.3 (high, U.S. average is 100) Percentage of residents living in poverty in 2022: 0.7%for White Non-Hispanic residents , 60.0% for Black residents , 1.9% for Hispanic or Latino residents )
Profiles of local businesses
Business Search - 14 Million verified businesses
Data:
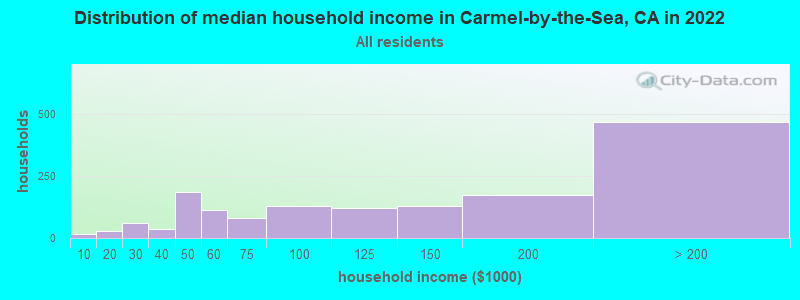
Median household income ($)
Median household income (% change since 2000)
Household income diversity
Ratio of average income to average house value (%)
Ratio of average income to average rent
Median household income ($) - White
Median household income ($) - Black or African American
Median household income ($) - Asian
Median household income ($) - Hispanic or Latino
Median household income ($) - American Indian and Alaska Native
Median household income ($) - Multirace
Median household income ($) - Other Race
Median household income for houses/condos with a mortgage ($)
Median household income for apartments without a mortgage ($)
Races - White alone (%)
Races - White alone (% change since 2000)
Races - Black alone (%)
Races - Black alone (% change since 2000)
Races - American Indian alone (%)
Races - American Indian alone (% change since 2000)
Races - Asian alone (%)
Races - Asian alone (% change since 2000)
Races - Hispanic (%)
Races - Hispanic (% change since 2000)
Races - Native Hawaiian and Other Pacific Islander alone (%)
Races - Native Hawaiian and Other Pacific Islander alone (% change since 2000)
Races - Two or more races (%)
Races - Two or more races (% change since 2000)
Races - Other race alone (%)
Races - Other race alone (% change since 2000)
Racial diversity
Unemployment (%)
Unemployment (% change since 2000)
Unemployment (%) - White
Unemployment (%) - Black or African American
Unemployment (%) - Asian
Unemployment (%) - Hispanic or Latino
Unemployment (%) - American Indian and Alaska Native
Unemployment (%) - Multirace
Unemployment (%) - Other Race
Population density (people per square mile)
Population - Males (%)
Population - Females (%)
Population - Males (%) - White
Population - Males (%) - Black or African American
Population - Males (%) - Asian
Population - Males (%) - Hispanic or Latino
Population - Males (%) - American Indian and Alaska Native
Population - Males (%) - Multirace
Population - Males (%) - Other Race
Population - Females (%) - White
Population - Females (%) - Black or African American
Population - Females (%) - Asian
Population - Females (%) - Hispanic or Latino
Population - Females (%) - American Indian and Alaska Native
Population - Females (%) - Multirace
Population - Females (%) - Other Race
Coronavirus confirmed cases (Apr 23, 2024)
Deaths caused by coronavirus (Apr 23, 2024)
Coronavirus confirmed cases (per 100k population) (Apr 23, 2024)
Deaths caused by coronavirus (per 100k population) (Apr 23, 2024)
Daily increase in number of cases (Apr 23, 2024)
Weekly increase in number of cases (Apr 23, 2024)
Cases doubled (in days) (Apr 23, 2024)
Hospitalized patients (Apr 18, 2022)
Negative test results (Apr 18, 2022)
Total test results (Apr 18, 2022)
COVID Vaccine doses distributed (per 100k population) (Sep 19, 2023)
COVID Vaccine doses administered (per 100k population) (Sep 19, 2023)
COVID Vaccine doses distributed (Sep 19, 2023)
COVID Vaccine doses administered (Sep 19, 2023)
Likely homosexual households (%)
Likely homosexual households (% change since 2000)
Likely homosexual households - Lesbian couples (%)
Likely homosexual households - Lesbian couples (% change since 2000)
Likely homosexual households - Gay men (%)
Likely homosexual households - Gay men (% change since 2000)
Cost of living index
Median gross rent ($)
Median contract rent ($)
Median monthly housing costs ($)
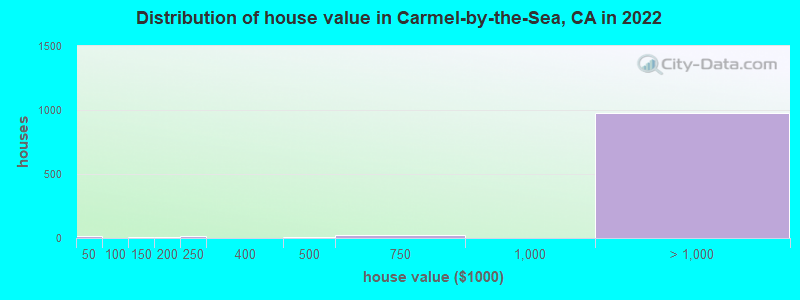
Median house or condo value ($)
Median house or condo value ($ change since 2000)
Mean house or condo value by units in structure - 1, detached ($)
Mean house or condo value by units in structure - 1, attached ($)
Mean house or condo value by units in structure - 2 ($)
Mean house or condo value by units in structure by units in structure - 3 or 4 ($)
Mean house or condo value by units in structure - 5 or more ($)
Mean house or condo value by units in structure - Boat, RV, van, etc. ($)
Mean house or condo value by units in structure - Mobile home ($)
Median house or condo value ($) - White
Median house or condo value ($) - Black or African American
Median house or condo value ($) - Asian
Median house or condo value ($) - Hispanic or Latino
Median house or condo value ($) - American Indian and Alaska Native
Median house or condo value ($) - Multirace
Median house or condo value ($) - Other Race
Median resident age
Resident age diversity
Median resident age - Males
Median resident age - Females
Median resident age - White
Median resident age - Black or African American
Median resident age - Asian
Median resident age - Hispanic or Latino
Median resident age - American Indian and Alaska Native
Median resident age - Multirace
Median resident age - Other Race
Median resident age - Males - White
Median resident age - Males - Black or African American
Median resident age - Males - Asian
Median resident age - Males - Hispanic or Latino
Median resident age - Males - American Indian and Alaska Native
Median resident age - Males - Multirace
Median resident age - Males - Other Race
Median resident age - Females - White
Median resident age - Females - Black or African American
Median resident age - Females - Asian
Median resident age - Females - Hispanic or Latino
Median resident age - Females - American Indian and Alaska Native
Median resident age - Females - Multirace
Median resident age - Females - Other Race
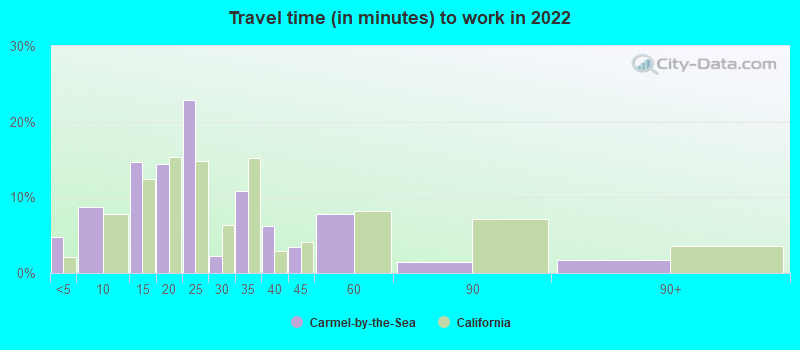
Commute - mean travel time to work (minutes)
Travel time to work - Less than 5 minutes (%)
Travel time to work - Less than 5 minutes (% change since 2000)
Travel time to work - 5 to 9 minutes (%)
Travel time to work - 5 to 9 minutes (% change since 2000)
Travel time to work - 10 to 19 minutes (%)
Travel time to work - 10 to 19 minutes (% change since 2000)
Travel time to work - 20 to 29 minutes (%)
Travel time to work - 20 to 29 minutes (% change since 2000)
Travel time to work - 30 to 39 minutes (%)
Travel time to work - 30 to 39 minutes (% change since 2000)
Travel time to work - 40 to 59 minutes (%)
Travel time to work - 40 to 59 minutes (% change since 2000)
Travel time to work - 60 to 89 minutes (%)
Travel time to work - 60 to 89 minutes (% change since 2000)
Travel time to work - 90 or more minutes (%)
Travel time to work - 90 or more minutes (% change since 2000)
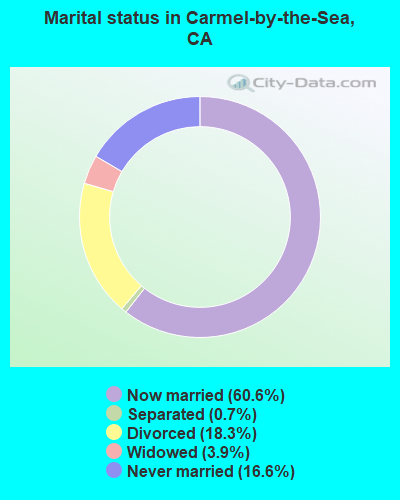
Marital status - Never married (%)
Marital status - Now married (%)
Marital status - Separated (%)
Marital status - Widowed (%)
Marital status - Divorced (%)
Median family income ($)
Median family income (% change since 2000)
Median non-family income ($)
Median non-family income (% change since 2000)
Median per capita income ($)
Median per capita income (% change since 2000)
Median family income ($) - White
Median family income ($) - Black or African American
Median family income ($) - Asian
Median family income ($) - Hispanic or Latino
Median family income ($) - American Indian and Alaska Native
Median family income ($) - Multirace
Median family income ($) - Other Race
Median year house/condo built
Median year apartment built
Year house built - Built 2005 or later (%)
Year house built - Built 2000 to 2004 (%)
Year house built - Built 1990 to 1999 (%)
Year house built - Built 1980 to 1989 (%)
Year house built - Built 1970 to 1979 (%)
Year house built - Built 1960 to 1969 (%)
Year house built - Built 1950 to 1959 (%)
Year house built - Built 1940 to 1949 (%)
Year house built - Built 1939 or earlier (%)
Average household size
Household density (households per square mile)
Average household size - White
Average household size - Black or African American
Average household size - Asian
Average household size - Hispanic or Latino
Average household size - American Indian and Alaska Native
Average household size - Multirace
Average household size - Other Race
Occupied housing units (%)
Vacant housing units (%)
Owner occupied housing units (%)
Renter occupied housing units (%)
Vacancy status - For rent (%)
Vacancy status - For sale only (%)
Vacancy status - Rented or sold, not occupied (%)
Vacancy status - For seasonal, recreational, or occasional use (%)
Vacancy status - For migrant workers (%)
Vacancy status - Other vacant (%)
Residents with income below the poverty level (%)
Residents with income below 50% of the poverty level (%)
Children below poverty level (%)
Poor families by family type - Married-couple family (%)
Poor families by family type - Male, no wife present (%)
Poor families by family type - Female, no husband present (%)
Poverty status for native-born residents (%)
Poverty status for foreign-born residents (%)
Poverty among high school graduates not in families (%)
Poverty among people who did not graduate high school not in families (%)
Residents with income below the poverty level (%) - White
Residents with income below the poverty level (%) - Black or African American
Residents with income below the poverty level (%) - Asian
Residents with income below the poverty level (%) - Hispanic or Latino
Residents with income below the poverty level (%) - American Indian and Alaska Native
Residents with income below the poverty level (%) - Multirace
Residents with income below the poverty level (%) - Other Race
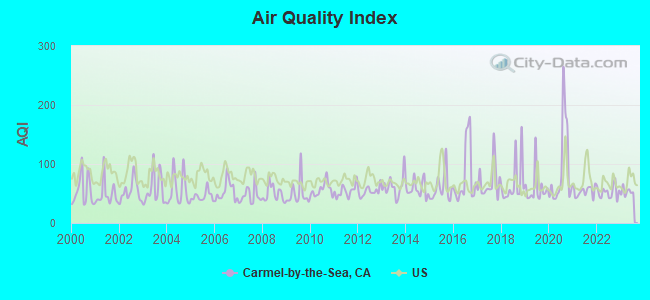
Air pollution - Air Quality Index (AQI)
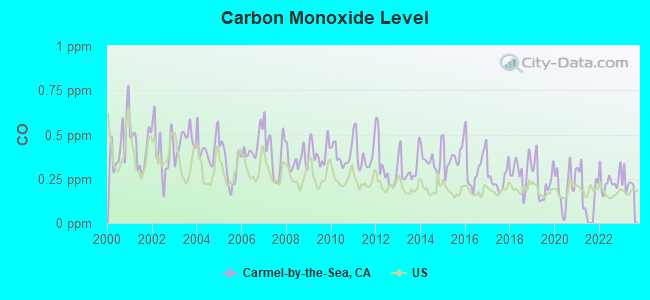
Air pollution - CO
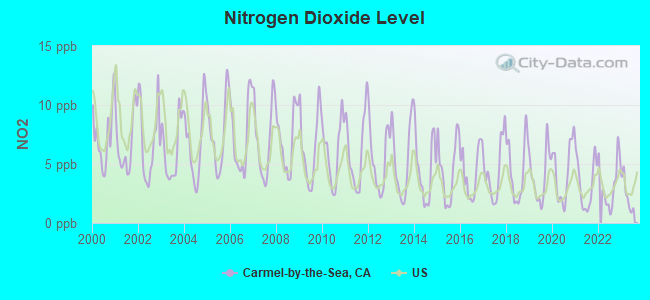
Air pollution - NO2
Air pollution - SO2
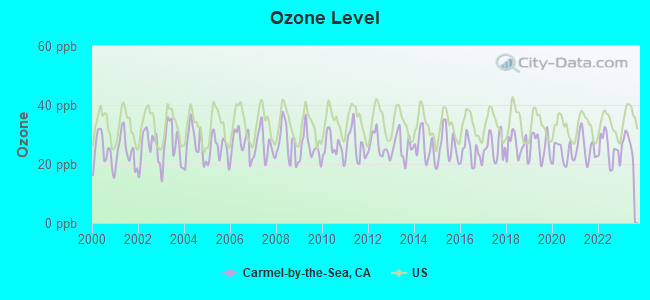
Air pollution - Ozone
Air pollution - PM10
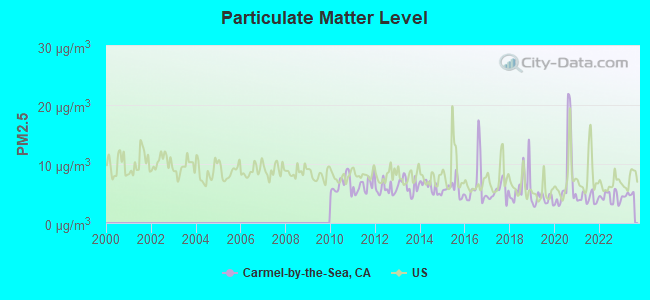
Air pollution - PM25
Air pollution - Pb
Crime - Murders per 100,000 population
Crime - Rapes per 100,000 population
Crime - Robberies per 100,000 population
Crime - Assaults per 100,000 population
Crime - Burglaries per 100,000 population
Crime - Thefts per 100,000 population
Crime - Auto thefts per 100,000 population
Crime - Arson per 100,000 population
Crime - City-data.com crime index
Crime - Violent crime index
Crime - Property crime index
Crime - Murders per 100,000 population (5 year average)
Crime - Rapes per 100,000 population (5 year average)
Crime - Robberies per 100,000 population (5 year average)
Crime - Assaults per 100,000 population (5 year average)
Crime - Burglaries per 100,000 population (5 year average)
Crime - Thefts per 100,000 population (5 year average)
Crime - Auto thefts per 100,000 population (5 year average)
Crime - Arson per 100,000 population (5 year average)
Crime - City-data.com crime index (5 year average)
Crime - Violent crime index (5 year average)
Crime - Property crime index (5 year average)
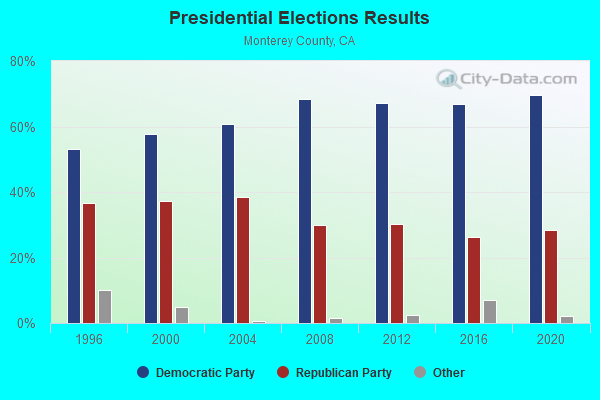
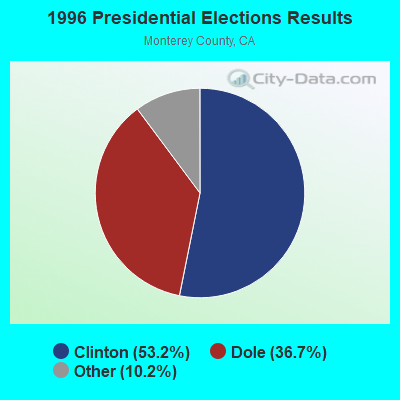
1996 Presidential Elections Results (%) - Democratic Party (Clinton)
1996 Presidential Elections Results (%) - Republican Party (Dole)
1996 Presidential Elections Results (%) - Other
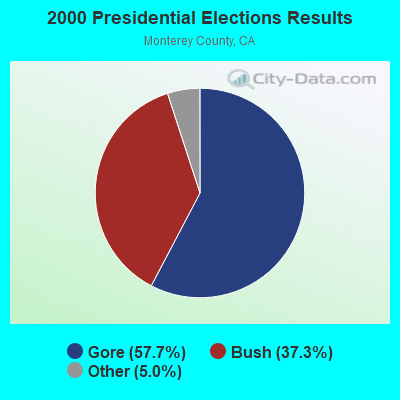
2000 Presidential Elections Results (%) - Democratic Party (Gore)
2000 Presidential Elections Results (%) - Republican Party (Bush)
2000 Presidential Elections Results (%) - Other
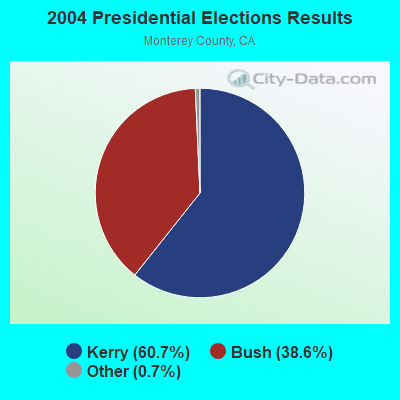
2004 Presidential Elections Results (%) - Democratic Party (Kerry)
2004 Presidential Elections Results (%) - Republican Party (Bush)
2004 Presidential Elections Results (%) - Other
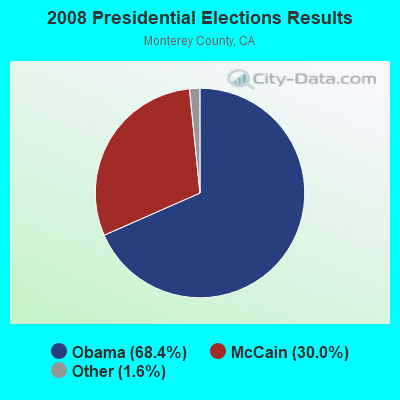
2008 Presidential Elections Results (%) - Democratic Party (Obama)
2008 Presidential Elections Results (%) - Republican Party (McCain)
2008 Presidential Elections Results (%) - Other
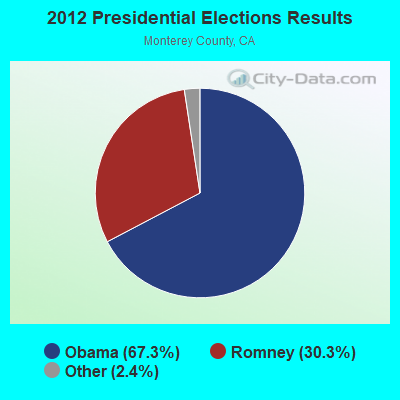
2012 Presidential Elections Results (%) - Democratic Party (Obama)
2012 Presidential Elections Results (%) - Republican Party (Romney)
2012 Presidential Elections Results (%) - Other
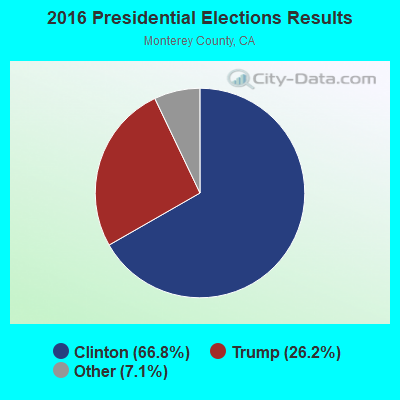
2016 Presidential Elections Results (%) - Democratic Party (Clinton)
2016 Presidential Elections Results (%) - Republican Party (Trump)
2016 Presidential Elections Results (%) - Other
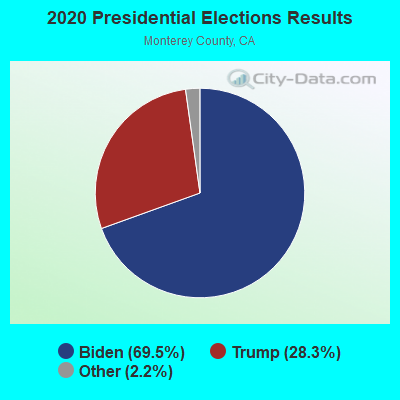
2020 Presidential Elections Results (%) - Democratic Party (Biden)
2020 Presidential Elections Results (%) - Republican Party (Trump)
2020 Presidential Elections Results (%) - Other
Ancestries Reported - Arab (%)
Ancestries Reported - Czech (%)
Ancestries Reported - Danish (%)
Ancestries Reported - Dutch (%)
Ancestries Reported - English (%)
Ancestries Reported - French (%)
Ancestries Reported - French Canadian (%)
Ancestries Reported - German (%)
Ancestries Reported - Greek (%)
Ancestries Reported - Hungarian (%)
Ancestries Reported - Irish (%)
Ancestries Reported - Italian (%)
Ancestries Reported - Lithuanian (%)
Ancestries Reported - Norwegian (%)
Ancestries Reported - Polish (%)
Ancestries Reported - Portuguese (%)
Ancestries Reported - Russian (%)
Ancestries Reported - Scotch-Irish (%)
Ancestries Reported - Scottish (%)
Ancestries Reported - Slovak (%)
Ancestries Reported - Subsaharan African (%)
Ancestries Reported - Swedish (%)
Ancestries Reported - Swiss (%)
Ancestries Reported - Ukrainian (%)
Ancestries Reported - United States (%)
Ancestries Reported - Welsh (%)
Ancestries Reported - West Indian (%)
Ancestries Reported - Other (%)
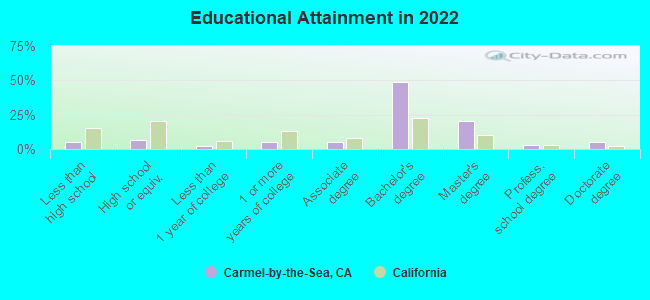
Educational Attainment - No schooling completed (%)
Educational Attainment - Less than high school (%)
Educational Attainment - High school or equivalent (%)
Educational Attainment - Less than 1 year of college (%)
Educational Attainment - 1 or more years of college (%)
Educational Attainment - Associate degree (%)
Educational Attainment - Bachelor's degree (%)
Educational Attainment - Master's degree (%)
Educational Attainment - Professional school degree (%)
Educational Attainment - Doctorate degree (%)
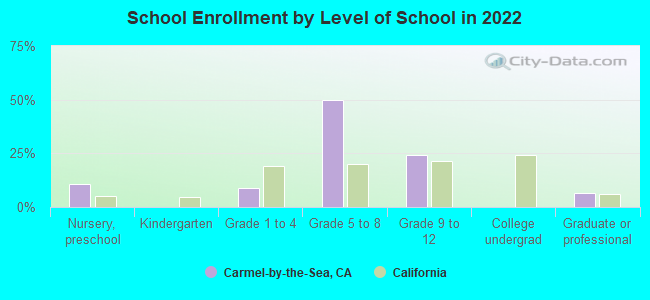
School Enrollment - Nursery, preschool (%)
School Enrollment - Kindergarten (%)
School Enrollment - Grade 1 to 4 (%)
School Enrollment - Grade 5 to 8 (%)
School Enrollment - Grade 9 to 12 (%)
School Enrollment - College undergrad (%)
School Enrollment - Graduate or professional (%)
School Enrollment - Not enrolled in school (%)
School enrollment - Public schools (%)
School enrollment - Private schools (%)
School enrollment - Not enrolled (%)
Median number of rooms in houses and condos
Median number of rooms in apartments
Housing units lacking complete plumbing facilities (%)
Housing units lacking complete kitchen facilities (%)
Density of houses
Urban houses (%)
Rural houses (%)
Households with people 60 years and over (%)
Households with people 65 years and over (%)
Households with people 75 years and over (%)
Households with one or more nonrelatives (%)
Households with no nonrelatives (%)
Population in households (%)
Family households (%)
Nonfamily households (%)
Population in families (%)
Family households with own children (%)
Median number of bedrooms in owner occupied houses
Mean number of bedrooms in owner occupied houses
Median number of bedrooms in renter occupied houses
Mean number of bedrooms in renter occupied houses
Median number of vehichles in owner occupied houses
Mean number of vehichles in owner occupied houses
Median number of vehichles in renter occupied houses
Mean number of vehichles in renter occupied houses
Mortgage status - with mortgage (%)
Mortgage status - with second mortgage (%)
Mortgage status - with home equity loan (%)
Mortgage status - with both second mortgage and home equity loan (%)
Mortgage status - without a mortgage (%)
Average family size
Average family size - White
Average family size - Black or African American
Average family size - Asian
Average family size - Hispanic or Latino
Average family size - American Indian and Alaska Native
Average family size - Multirace
Average family size - Other Race
Geographical mobility - Same house 1 year ago (%)
Geographical mobility - Moved within same county (%)
Geographical mobility - Moved from different county within same state (%)
Geographical mobility - Moved from different state (%)
Geographical mobility - Moved from abroad (%)
Place of birth - Born in state of residence (%)
Place of birth - Born in other state (%)
Place of birth - Native, outside of US (%)
Place of birth - Foreign born (%)
Housing units in structures - 1, detached (%)
Housing units in structures - 1, attached (%)
Housing units in structures - 2 (%)
Housing units in structures - 3 or 4 (%)
Housing units in structures - 5 to 9 (%)
Housing units in structures - 10 to 19 (%)
Housing units in structures - 20 to 49 (%)
Housing units in structures - 50 or more (%)
Housing units in structures - Mobile home (%)
Housing units in structures - Boat, RV, van, etc. (%)
House/condo owner moved in on average (years ago)
Renter moved in on average (years ago)
Year householder moved into unit - Moved in 1999 to March 2000 (%)
Year householder moved into unit - Moved in 1995 to 1998 (%)
Year householder moved into unit - Moved in 1990 to 1994 (%)
Year householder moved into unit - Moved in 1980 to 1989 (%)
Year householder moved into unit - Moved in 1970 to 1979 (%)
Year householder moved into unit - Moved in 1969 or earlier (%)
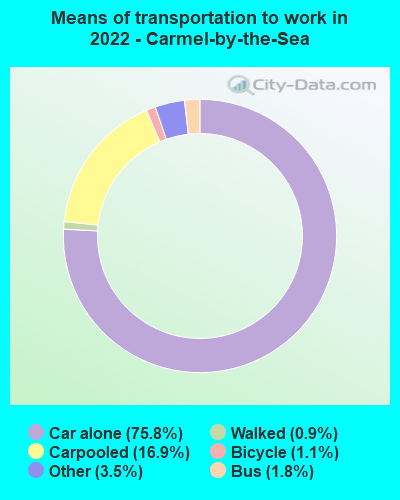
Means of transportation to work - Drove car alone (%)
Means of transportation to work - Carpooled (%)
Means of transportation to work - Public transportation (%)
Means of transportation to work - Bus or trolley bus (%)
Means of transportation to work - Streetcar or trolley car (%)
Means of transportation to work - Subway or elevated (%)
Means of transportation to work - Railroad (%)
Means of transportation to work - Ferryboat (%)
Means of transportation to work - Taxicab (%)
Means of transportation to work - Motorcycle (%)
Means of transportation to work - Bicycle (%)
Means of transportation to work - Walked (%)
Means of transportation to work - Other means (%)
Working at home (%)
Industry diversity
Most Common Industries - Agriculture, forestry, fishing and hunting, and mining (%)
Most Common Industries - Agriculture, forestry, fishing and hunting (%)
Most Common Industries - Mining, quarrying, and oil and gas extraction (%)
Most Common Industries - Construction (%)
Most Common Industries - Manufacturing (%)
Most Common Industries - Wholesale trade (%)
Most Common Industries - Retail trade (%)
Most Common Industries - Transportation and warehousing, and utilities (%)
Most Common Industries - Transportation and warehousing (%)
Most Common Industries - Utilities (%)
Most Common Industries - Information (%)
Most Common Industries - Finance and insurance, and real estate and rental and leasing (%)
Most Common Industries - Finance and insurance (%)
Most Common Industries - Real estate and rental and leasing (%)
Most Common Industries - Professional, scientific, and management, and administrative and waste management services (%)
Most Common Industries - Professional, scientific, and technical services (%)
Most Common Industries - Management of companies and enterprises (%)
Most Common Industries - Administrative and support and waste management services (%)
Most Common Industries - Educational services, and health care and social assistance (%)
Most Common Industries - Educational services (%)
Most Common Industries - Health care and social assistance (%)
Most Common Industries - Arts, entertainment, and recreation, and accommodation and food services (%)
Most Common Industries - Arts, entertainment, and recreation (%)
Most Common Industries - Accommodation and food services (%)
Most Common Industries - Other services, except public administration (%)
Most Common Industries - Public administration (%)
Occupation diversity
Most Common Occupations - Management, business, science, and arts occupations (%)
Most Common Occupations - Management, business, and financial occupations (%)
Most Common Occupations - Management occupations (%)
Most Common Occupations - Business and financial operations occupations (%)
Most Common Occupations - Computer, engineering, and science occupations (%)
Most Common Occupations - Computer and mathematical occupations (%)
Most Common Occupations - Architecture and engineering occupations (%)
Most Common Occupations - Life, physical, and social science occupations (%)
Most Common Occupations - Education, legal, community service, arts, and media occupations (%)
Most Common Occupations - Community and social service occupations (%)
Most Common Occupations - Legal occupations (%)
Most Common Occupations - Education, training, and library occupations (%)
Most Common Occupations - Arts, design, entertainment, sports, and media occupations (%)
Most Common Occupations - Healthcare practitioners and technical occupations (%)
Most Common Occupations - Health diagnosing and treating practitioners and other technical occupations (%)
Most Common Occupations - Health technologists and technicians (%)
Most Common Occupations - Service occupations (%)
Most Common Occupations - Healthcare support occupations (%)
Most Common Occupations - Protective service occupations (%)
Most Common Occupations - Fire fighting and prevention, and other protective service workers including supervisors (%)
Most Common Occupations - Law enforcement workers including supervisors (%)
Most Common Occupations - Food preparation and serving related occupations (%)
Most Common Occupations - Building and grounds cleaning and maintenance occupations (%)
Most Common Occupations - Personal care and service occupations (%)
Most Common Occupations - Sales and office occupations (%)
Most Common Occupations - Sales and related occupations (%)
Most Common Occupations - Office and administrative support occupations (%)
Most Common Occupations - Natural resources, construction, and maintenance occupations (%)
Most Common Occupations - Farming, fishing, and forestry occupations (%)
Most Common Occupations - Construction and extraction occupations (%)
Most Common Occupations - Installation, maintenance, and repair occupations (%)
Most Common Occupations - Production, transportation, and material moving occupations (%)
Most Common Occupations - Production occupations (%)
Most Common Occupations - Transportation occupations (%)
Most Common Occupations - Material moving occupations (%)
People in Group quarters - Institutionalized population (%)
People in Group quarters - Correctional institutions (%)
People in Group quarters - Federal prisons and detention centers (%)
People in Group quarters - Halfway houses (%)
People in Group quarters - Local jails and other confinement facilities (including police lockups) (%)
People in Group quarters - Military disciplinary barracks (%)
People in Group quarters - State prisons (%)
People in Group quarters - Other types of correctional institutions (%)
People in Group quarters - Nursing homes (%)
People in Group quarters - Hospitals/wards, hospices, and schools for the handicapped (%)
People in Group quarters - Hospitals/wards and hospices for chronically ill (%)
People in Group quarters - Hospices or homes for chronically ill (%)
People in Group quarters - Military hospitals or wards for chronically ill (%)
People in Group quarters - Other hospitals or wards for chronically ill (%)
People in Group quarters - Hospitals or wards for drug/alcohol abuse (%)
People in Group quarters - Mental (Psychiatric) hospitals or wards (%)
People in Group quarters - Schools, hospitals, or wards for the mentally retarded (%)
People in Group quarters - Schools, hospitals, or wards for the physically handicapped (%)
People in Group quarters - Institutions for the deaf (%)
People in Group quarters - Institutions for the blind (%)
People in Group quarters - Orthopedic wards and institutions for the physically handicapped (%)
People in Group quarters - Wards in general hospitals for patients who have no usual home elsewhere (%)
People in Group quarters - Wards in military hospitals for patients who have no usual home elsewhere (%)
People in Group quarters - Juvenile institutions (%)
People in Group quarters - Long-term care (%)
People in Group quarters - Homes for abused, dependent, and neglected children (%)
People in Group quarters - Residential treatment centers for emotionally disturbed children (%)
People in Group quarters - Training schools for juvenile delinquents (%)
People in Group quarters - Short-term care, detention or diagnostic centers for delinquent children (%)
People in Group quarters - Type of juvenile institution unknown (%)
People in Group quarters - Noninstitutionalized population (%)
People in Group quarters - College dormitories (includes college quarters off campus) (%)
People in Group quarters - Military quarters (%)
People in Group quarters - On base (%)
People in Group quarters - Barracks, unaccompanied personnel housing (UPH), (Enlisted/Officer), ;and similar group living quarters for military personnel (%)
People in Group quarters - Transient quarters for temporary residents (%)
People in Group quarters - Military ships (%)
People in Group quarters - Group homes (%)
People in Group quarters - Homes or halfway houses for drug/alcohol abuse (%)
People in Group quarters - Homes for the mentally ill (%)
People in Group quarters - Homes for the mentally retarded (%)
People in Group quarters - Homes for the physically handicapped (%)
People in Group quarters - Other group homes (%)
People in Group quarters - Religious group quarters (%)
People in Group quarters - Dormitories (%)
People in Group quarters - Agriculture workers' dormitories on farms (%)
People in Group quarters - Job Corps and vocational training facilities (%)
People in Group quarters - Other workers' dormitories (%)
People in Group quarters - Crews of maritime vessels (%)
People in Group quarters - Other nonhousehold living situations (%)
People in Group quarters - Other noninstitutional group quarters (%)
Residents speaking English at home (%)
Residents speaking English at home - Born in the United States (%)
Residents speaking English at home - Native, born elsewhere (%)
Residents speaking English at home - Foreign born (%)
Residents speaking Spanish at home (%)
Residents speaking Spanish at home - Born in the United States (%)
Residents speaking Spanish at home - Native, born elsewhere (%)
Residents speaking Spanish at home - Foreign born (%)
Residents speaking other language at home (%)
Residents speaking other language at home - Born in the United States (%)
Residents speaking other language at home - Native, born elsewhere (%)
Residents speaking other language at home - Foreign born (%)
Class of Workers - Employee of private company (%)
Class of Workers - Self-employed in own incorporated business (%)
Class of Workers - Private not-for-profit wage and salary workers (%)
Class of Workers - Local government workers (%)
Class of Workers - State government workers (%)
Class of Workers - Federal government workers (%)
Class of Workers - Self-employed workers in own not incorporated business and Unpaid family workers (%)
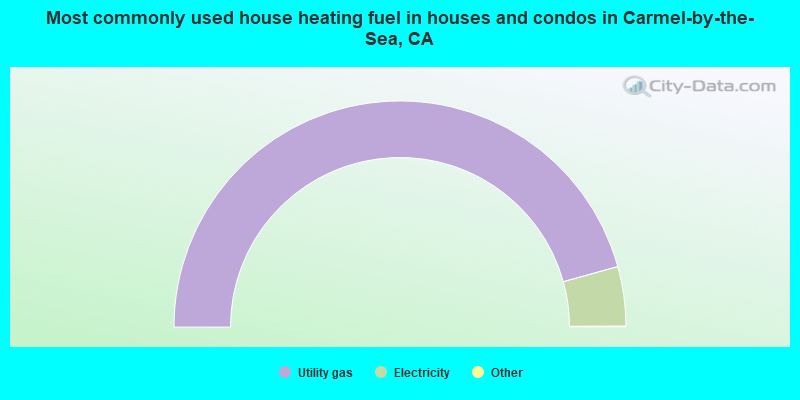
House heating fuel used in houses and condos - Utility gas (%)
House heating fuel used in houses and condos - Bottled, tank, or LP gas (%)
House heating fuel used in houses and condos - Electricity (%)
House heating fuel used in houses and condos - Fuel oil, kerosene, etc. (%)
House heating fuel used in houses and condos - Coal or coke (%)
House heating fuel used in houses and condos - Wood (%)
House heating fuel used in houses and condos - Solar energy (%)
House heating fuel used in houses and condos - Other fuel (%)
House heating fuel used in houses and condos - No fuel used (%)
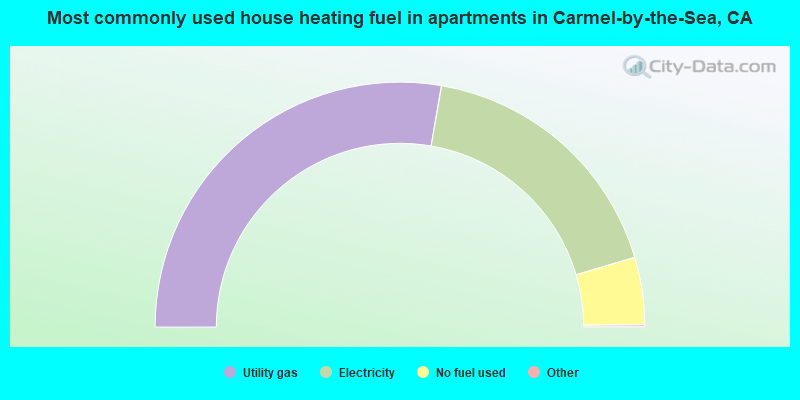
House heating fuel used in apartments - Utility gas (%)
House heating fuel used in apartments - Bottled, tank, or LP gas (%)
House heating fuel used in apartments - Electricity (%)
House heating fuel used in apartments - Fuel oil, kerosene, etc. (%)
House heating fuel used in apartments - Coal or coke (%)
House heating fuel used in apartments - Wood (%)
House heating fuel used in apartments - Solar energy (%)
House heating fuel used in apartments - Other fuel (%)
House heating fuel used in apartments - No fuel used (%)
Armed forces status - In Armed Forces (%)
Armed forces status - Civilian (%)
Armed forces status - Civilian - Veteran (%)
Armed forces status - Civilian - Nonveteran (%)
Fatal accidents locations in years 2005-2021
Fatal accidents locations in 2005
Fatal accidents locations in 2006
Fatal accidents locations in 2007
Fatal accidents locations in 2008
Fatal accidents locations in 2009
Fatal accidents locations in 2010
Fatal accidents locations in 2011
Fatal accidents locations in 2012
Fatal accidents locations in 2013
Fatal accidents locations in 2014
Fatal accidents locations in 2015
Fatal accidents locations in 2016
Fatal accidents locations in 2017
Fatal accidents locations in 2018
Fatal accidents locations in 2019
Fatal accidents locations in 2020
Fatal accidents locations in 2021
Alcohol use - People drinking some alcohol every month (%)
Alcohol use - People not drinking at all (%)
Alcohol use - Average days/month drinking alcohol
Alcohol use - Average drinks/week
Alcohol use - Average days/year people drink much
Audiometry - Average condition of hearing (%)
Audiometry - People that can hear a whisper from across a quiet room (%)
Audiometry - People that can hear normal voice from across a quiet room (%)
Audiometry - Ears ringing, roaring, buzzing (%)
Audiometry - Had a job exposure to loud noise (%)
Audiometry - Had off-work exposure to loud noise (%)
Blood Pressure & Cholesterol - Has high blood pressure (%)
Blood Pressure & Cholesterol - Checking blood pressure at home (%)
Blood Pressure & Cholesterol - Frequently checking blood cholesterol (%)
Blood Pressure & Cholesterol - Has high cholesterol level (%)
Consumer Behavior - Money monthly spent on food at supermarket/grocery store
Consumer Behavior - Money monthly spent on food at other stores
Consumer Behavior - Money monthly spent on eating out
Consumer Behavior - Money monthly spent on carryout/delivered foods
Consumer Behavior - Income spent on food at supermarket/grocery store (%)
Consumer Behavior - Income spent on food at other stores (%)
Consumer Behavior - Income spent on eating out (%)
Consumer Behavior - Income spent on carryout/delivered foods (%)
Current Health Status - General health condition (%)
Current Health Status - Blood donors (%)
Current Health Status - Has blood ever tested for HIV virus (%)
Current Health Status - Left-handed people (%)
Dermatology - People using sunscreen (%)
Diabetes - Diabetics (%)
Diabetes - Had a blood test for high blood sugar (%)
Diabetes - People taking insulin (%)
Diet Behavior & Nutrition - Diet health (%)
Diet Behavior & Nutrition - Milk product consumption (# of products/month)
Diet Behavior & Nutrition - Meals not home prepared (#/week)
Diet Behavior & Nutrition - Meals from fast food or pizza place (#/week)
Diet Behavior & Nutrition - Ready-to-eat foods (#/month)
Diet Behavior & Nutrition - Frozen meals/pizza (#/month)
Drug Use - People that ever used marijuana or hashish (%)
Drug Use - Ever used hard drugs (%)
Drug Use - Ever used any form of cocaine (%)
Drug Use - Ever used heroin (%)
Drug Use - Ever used methamphetamine (%)
Health Insurance - People covered by health insurance (%)
Kidney Conditions-Urology - Avg. # of times urinating at night
Medical Conditions - People with asthma (%)
Medical Conditions - People with anemia (%)
Medical Conditions - People with psoriasis (%)
Medical Conditions - People with overweight (%)
Medical Conditions - Elderly people having difficulties in thinking or remembering (%)
Medical Conditions - People who ever received blood transfusion (%)
Medical Conditions - People having trouble seeing even with glass/contacts (%)
Medical Conditions - People with arthritis (%)
Medical Conditions - People with gout (%)
Medical Conditions - People with congestive heart failure (%)
Medical Conditions - People with coronary heart disease (%)
Medical Conditions - People with angina pectoris (%)
Medical Conditions - People who ever had heart attack (%)
Medical Conditions - People who ever had stroke (%)
Medical Conditions - People with emphysema (%)
Medical Conditions - People with thyroid problem (%)
Medical Conditions - People with chronic bronchitis (%)
Medical Conditions - People with any liver condition (%)
Medical Conditions - People who ever had cancer or malignancy (%)
Mental Health - People who have little interest in doing things (%)
Mental Health - People feeling down, depressed, or hopeless (%)
Mental Health - People who have trouble sleeping or sleeping too much (%)
Mental Health - People feeling tired or having little energy (%)
Mental Health - People with poor appetite or overeating (%)
Mental Health - People feeling bad about themself (%)
Mental Health - People who have trouble concentrating on things (%)
Mental Health - People moving or speaking slowly or too fast (%)
Mental Health - People having thoughts they would be better off dead (%)
Oral Health - Average years since last visit a dentist
Oral Health - People embarrassed because of mouth (%)
Oral Health - People with gum disease (%)
Oral Health - General health of teeth and gums (%)
Oral Health - Average days a week using dental floss/device
Oral Health - Average days a week using mouthwash for dental problem
Oral Health - Average number of teeth
Pesticide Use - Households using pesticides to control insects (%)
Pesticide Use - Households using pesticides to kill weeds (%)
Physical Activity - People doing vigorous-intensity work activities (%)
Physical Activity - People doing moderate-intensity work activities (%)
Physical Activity - People walking or bicycling (%)
Physical Activity - People doing vigorous-intensity recreational activities (%)
Physical Activity - People doing moderate-intensity recreational activities (%)
Physical Activity - Average hours a day doing sedentary activities
Physical Activity - Average hours a day watching TV or videos
Physical Activity - Average hours a day using computer
Physical Functioning - People having limitations keeping them from working (%)
Physical Functioning - People limited in amount of work they can do (%)
Physical Functioning - People that need special equipment to walk (%)
Physical Functioning - People experiencing confusion/memory problems (%)
Physical Functioning - People requiring special healthcare equipment (%)
Prescription Medications - Average number of prescription medicines taking
Preventive Aspirin Use - Adults 40+ taking low-dose aspirin (%)
Reproductive Health - Vaginal deliveries (%)
Reproductive Health - Cesarean deliveries (%)
Reproductive Health - Deliveries resulted in a live birth (%)
Reproductive Health - Pregnancies resulted in a delivery (%)
Reproductive Health - Women breastfeeding newborns (%)
Reproductive Health - Women that had a hysterectomy (%)
Reproductive Health - Women that had both ovaries removed (%)
Reproductive Health - Women that have ever taken birth control pills (%)
Reproductive Health - Women taking birth control pills (%)
Reproductive Health - Women that have ever used Depo-Provera or injectables (%)
Reproductive Health - Women that have ever used female hormones (%)
Sexual Behavior - People 18+ that ever had sex (vaginal, anal, or oral) (%)
Sexual Behavior - Males 18+ that ever had vaginal sex with a woman (%)
Sexual Behavior - Males 18+ that ever performed oral sex on a woman (%)
Sexual Behavior - Males 18+ that ever had anal sex with a woman (%)
Sexual Behavior - Males 18+ that ever had any sex with a man (%)
Sexual Behavior - Females 18+ that ever had vaginal sex with a man (%)
Sexual Behavior - Females 18+ that ever performed oral sex on a man (%)
Sexual Behavior - Females 18+ that ever had anal sex with a man (%)
Sexual Behavior - Females 18+ that ever had any kind of sex with a woman (%)
Sexual Behavior - Average age people first had sex
Sexual Behavior - Average number of female sex partners in lifetime (males 18+)
Sexual Behavior - Average number of female vaginal sex partners in lifetime (males 18+)
Sexual Behavior - Average age people first performed oral sex on a woman (18+)
Sexual Behavior - Average number of woman performed oral sex on in lifetime (18+)
Sexual Behavior - Average number of male sex partners in lifetime (males 18+)
Sexual Behavior - Average number of male anal sex partners in lifetime (males 18+)
Sexual Behavior - Average age people first performed oral sex on a man (18+)
Sexual Behavior - Average number of male oral sex partners in lifetime (18+)
Sexual Behavior - People using protection when performing oral sex (%)
Sexual Behavior - Average number of times people have vaginal or anal sex a year
Sexual Behavior - People having sex without condom (%)
Sexual Behavior - Average number of male sex partners in lifetime (females 18+)
Sexual Behavior - Average number of male vaginal sex partners in lifetime (females 18+)
Sexual Behavior - Average number of female sex partners in lifetime (females 18+)
Sexual Behavior - Circumcised males 18+ (%)
Sleep Disorders - Average hours sleeping at night
Sleep Disorders - People that has trouble sleeping (%)
Smoking-Cigarette Use - People smoking cigarettes (%)
Taste & Smell - People 40+ having problems with smell (%)
Taste & Smell - People 40+ having problems with taste (%)
Taste & Smell - People 40+ that ever had wisdom teeth removed (%)
Taste & Smell - People 40+ that ever had tonsils teeth removed (%)
Taste & Smell - People 40+ that ever had a loss of consciousness because of a head injury (%)
Taste & Smell - People 40+ that ever had a broken nose or other serious injury to face or skull (%)
Taste & Smell - People 40+ that ever had two or more sinus infections (%)
Weight - Average height (inches)
Weight - Average weight (pounds)
Weight - Average BMI
Weight - People that are obese (%)
Weight - People that ever were obese (%)
Weight - People trying to lose weight (%)
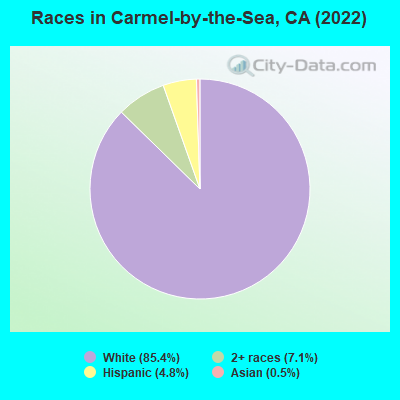
2,736 85.4% White alone 227 7.1% Two or more races 154 4.8% Hispanic 15 0.5% Asian alone 1 0.03% Black alone
Ancestries: English (11.7%), German (11.6%), American (7.6%), European (6.4%), Irish (6.1%), Dutch (4.6%).
Current Local Time:
Land area: 1.09 square miles.
Population density: 2,893 people per square mile (average).
403 residents are foreign born (5.7% Europe , 3.4% Latin America , 2.9% North America ).
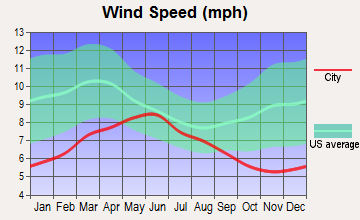
This city:
12.6%California:
26.5%
Median real estate property taxes paid for housing units with mortgages in 2022: $6,795 (0.4%)Median real estate property taxes paid for housing units with no mortgage in 2022: $6,524 (0.3%)
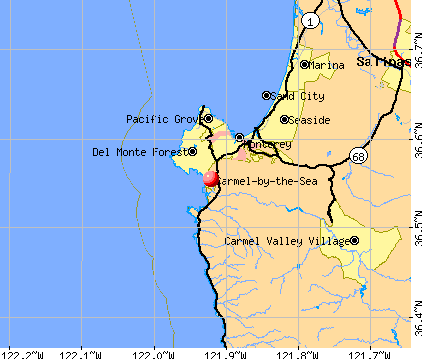
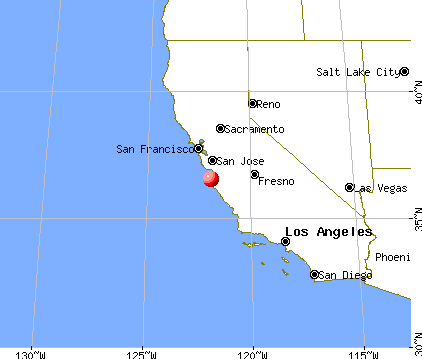
Nearest city with pop. 50,000+: Salinas, CA
Nearest city with pop. 200,000+: San Jose, CA
Nearest city with pop. 1,000,000+: Los Angeles, CA
Nearest cities:
Latitude: 36.55 N, Longitude: 121.92 W
Daytime population change due to commuting: +2,256 (+70.4%)Workers who live and work in this city: 656 (44.1%)
Area code commonly used in this area: 831
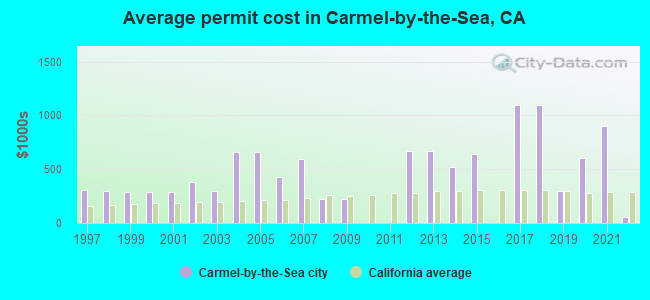
Property values in Carmel-by-the-Sea, CA
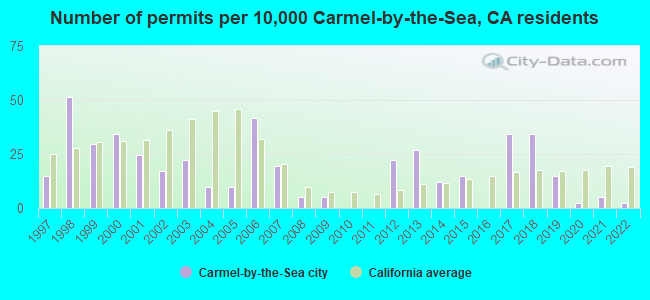
Single-family new house construction building permits:
2022: 1 building , cost: $60,0002021: 2 buildings , average cost: $900,0002020: 1 building , cost: $601,3002019: 6 buildings , average cost: $293,4002018: 14 buildings , average cost: $1,096,6002017: 14 buildings , average cost: $1,096,6002015: 6 buildings , average cost: $642,1002014: 5 buildings , average cost: $523,0002013: 11 buildings , average cost: $665,3002012: 9 buildings , average cost: $665,3002009: 2 buildings , average cost: $219,8002008: 2 buildings , average cost: $219,8002007: 8 buildings , average cost: $590,6002006: 17 buildings , average cost: $424,9002005: 4 buildings , average cost: $657,0002004: 4 buildings , average cost: $657,0002003: 9 buildings , average cost: $295,5002002: 7 buildings , average cost: $383,4002001: 10 buildings , average cost: $292,1002000: 14 buildings , average cost: $292,1001999: 12 buildings , average cost: $286,5001998: 21 buildings , average cost: $297,2001997: 6 buildings , average cost: $302,000Unemployment in December 2023:
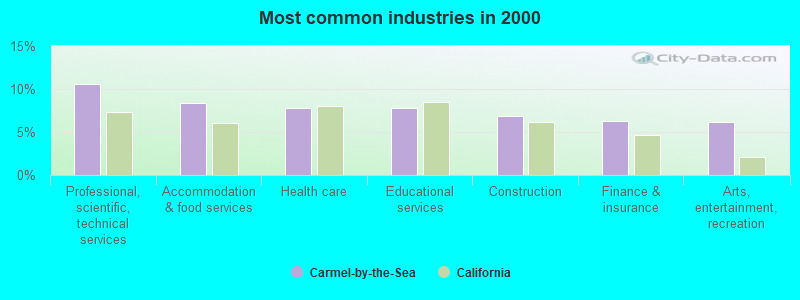
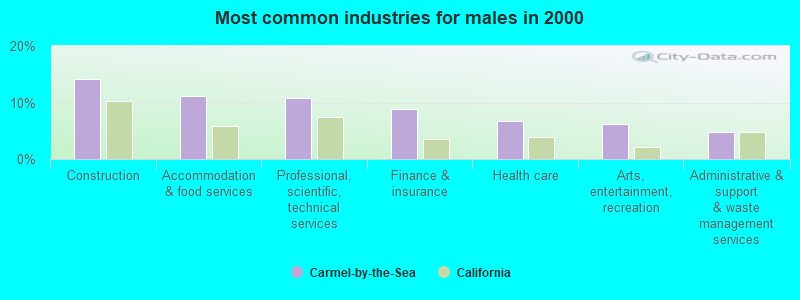
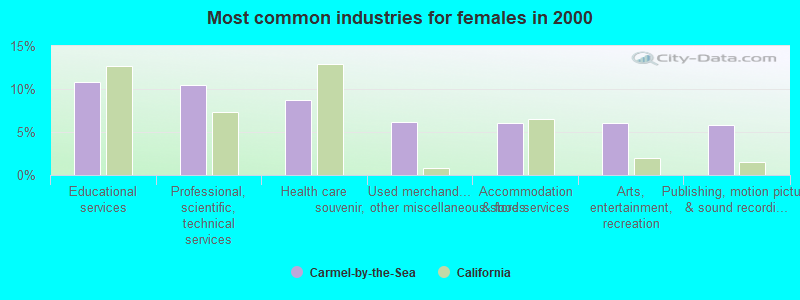
Most common industries in Carmel-by-the-Sea, CA (%)
Both Males Females
Professional, scientific, technical services (10.6%)
Accommodation & food services (8.3%)
Health care (7.8%)
Educational services (7.7%)
Construction (6.8%)
Finance & insurance (6.3%)
Arts, entertainment, recreation (6.1%)
Construction (14.1%)
Accommodation & food services (11.1%)
Professional, scientific, technical services (10.7%)
Finance & insurance (8.8%)
Health care (6.7%)
Arts, entertainment, recreation (6.2%)
Administrative & support & waste management services (4.8%)
Educational services (10.8%)
Professional, scientific, technical services (10.5%)
Health care (8.7%)
Used merchandise, gift, novelty, souvenir, other miscellaneous stores (6.1%)
Accommodation & food services (6.1%)
Arts, entertainment, recreation (6.1%)
Publishing, motion picture & sound recording industries (5.9%)
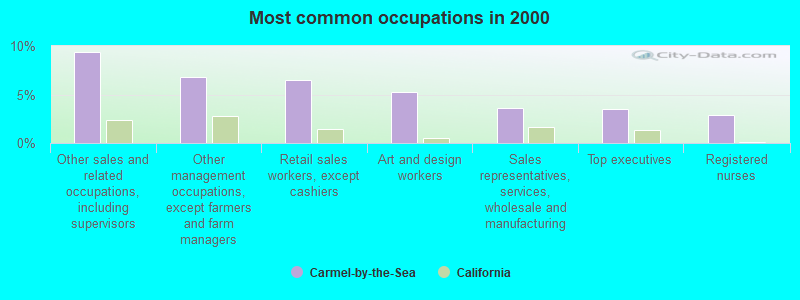
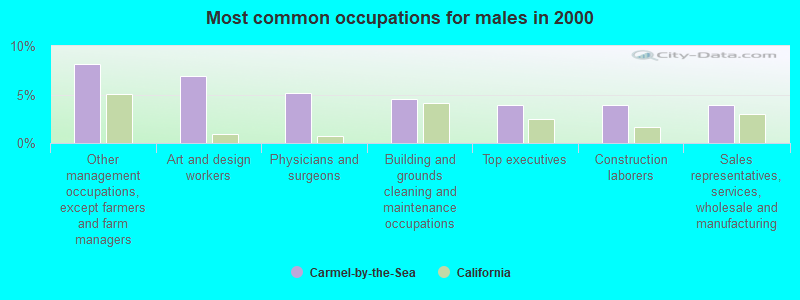
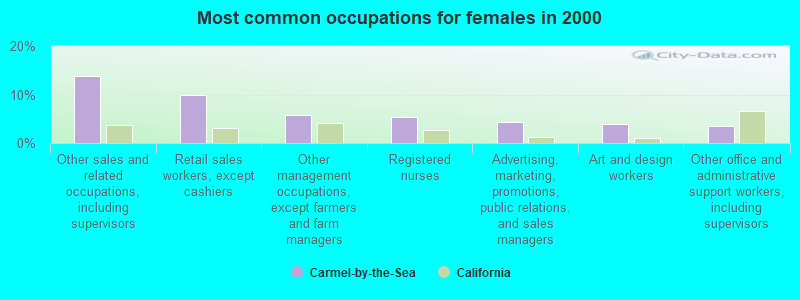
Most common occupations in Carmel-by-the-Sea, CA (%)
Both Males Females
Other sales and related occupations, including supervisors (9.3%)
Other management occupations, except farmers and farm managers (6.8%)
Retail sales workers, except cashiers (6.5%)
Art and design workers (5.3%)
Sales representatives, services, wholesale and manufacturing (3.6%)
Top executives (3.5%)
Registered nurses (2.9%)
Other management occupations, except farmers and farm managers (8.1%)
Art and design workers (6.9%)
Physicians and surgeons (5.2%)
Building and grounds cleaning and maintenance occupations (4.5%)
Top executives (3.9%)
Construction laborers (3.9%)
Sales representatives, services, wholesale and manufacturing (3.9%)
Other sales and related occupations, including supervisors (13.9%)
Retail sales workers, except cashiers (9.8%)
Other management occupations, except farmers and farm managers (5.7%)
Registered nurses (5.3%)
Advertising, marketing, promotions, public relations, and sales managers (4.4%)
Art and design workers (3.9%)
Other office and administrative support workers, including supervisors (3.6%)
Earthquake activity:
Carmel-by-the-Sea-area historical earthquake activity is significantly above California state average. It is 7256% greater than the overall U.S. average. On 4/18/1906 at 13:12:21, a magnitude 7.9 (7.9 UK, Class: Major, Intensity: VIII - XII) earthquake occurred 116.3 miles away from Carmel-by-the-Sea center, causing $524,000,000 total damage On 11/4/1927 at 13:51:53, a magnitude 7.5 (7.5 UK) earthquake occurred 123.9 miles away from Carmel-by-the-Sea center On 10/18/1989 at 00:04:15, a magnitude 7.1 (6.5 MB, 7.1 MS, 6.9 MW, 7.0 ML) earthquake occurred 39.3 miles away from the city center, causing 62 deaths ( 62 shaking deaths) and 3757 injuries, causing $1,305,032,704 total damage On 7/21/1952 at 11:52:14, a magnitude 7.7 (7.7 UK) earthquake occurred 196.0 miles away from the city center, causing $50,000,000 total damage On 5/2/1983 at 23:42:37, a magnitude 6.7 (6.2 MB, 6.5 MS, 6.5 MW, 6.7 ML, Class: Strong, Intensity: VII - IX) earthquake occurred 93.0 miles away from Carmel-by-the-Sea center, causing $31,000,000 total damage On 12/22/2003 at 19:15:56, a magnitude 6.6 (6.1 MB, 6.4 MS, 6.6 MW, 6.4 MW) earthquake occurred 80.3 miles away from the city center, causing 2 deaths ( 2 shaking deaths) and 40 injuries, causing $200,000,000 total damage Magnitude types: body-wave magnitude (MB), local magnitude (ML), surface-wave magnitude (MS), moment magnitude (MW) Natural disasters: The number of natural disasters in Monterey County (23) is greater than the US average (15).Major Disasters (Presidential) Declared: 14Emergencies Declared: 3Floods: 12, Winter Storms: 7, Storms: 6, Fires: 4, Landslides: 4, Mudslides: 4, Freezes: 2, Drought: 1, Earthquake: 1, Hurricane: 1, Tornado: 1, Tsunami Wave: 1, Other: 1 (Note: some incidents may be assigned to more than one category). Hospitals and medical centers near Carmel-by-the-Sea: COUNTRY HOME CARE HOSPICE (Hospital, about 2 miles away; CARMEL, CA)
CYPRESS RIDGE CARE CENTER (Nursing Home, about 3 miles away; MONTEREY, CA)
WESTLAND HOUSE (Nursing Home, about 3 miles away; MONTEREY, CA)
WINDSOR MONTEREY CARE CENTER (Nursing Home, about 3 miles away; MONTEREY, CA)
OLSTEN HEALTHCARE (Home Health Center, about 3 miles away; MONTEREY, CA)
COMMUNITY HOSPITAL RECOVERY CENTER (Hospital, about 4 miles away; MONTEREY, CA)
COMMUNITY HOSPITAL HOME HEALTH SERVICES (Home Health Center, about 4 miles away; MONTEREY, CA)
Amtrak stations near Carmel-by-the-Sea: 2 miles: CARMEL (3665 RIO RD.) - Bus Station Services: fully wheelchair accessible, public restrooms, public payphones, snack bar, call for car rental service, call for taxi service, public transit connection.
4 miles: MONTEREY TRANSIT PLAZA (MONTEREY, PEARL & TYLER STS.) - Bus Station Services: fully wheelchair accessible, public payphones, paid short-term parking, paid long-term parking, taxi stand, public transit connection.
6 miles: SEASIDE (BLDG. T-1176, 4TH ST.) - Bus Station Services: fully wheelchair accessible, public payphones, free short-term parking, call for taxi service, public transit connection.
Colleges/universities with over 2000 students nearest to Carmel-by-the-Sea:
Monterey Peninsula College (about 4 miles; Monterey, CA ; Full-time enrollment: 4,588)
Naval Postgraduate School (about 4 miles; Monterey, CA ; FT enrollment: 4,951)
California State University-Monterey Bay (about 10 miles; Seaside, CA ; FT enrollment: 5,125)
Hartnell College (about 17 miles; Salinas, CA ; FT enrollment: 5,506)
Cabrillo College (about 31 miles; Aptos, CA ; FT enrollment: 7,729)
University of California-Santa Cruz (about 32 miles; Santa Cruz, CA ; FT enrollment: 17,751)
Gavilan College (about 35 miles; Gilroy, CA ; FT enrollment: 3,327)
Public elementary/middle schools in Carmel-by-the-Sea:
See full list of schools located in Carmel-by-the-Sea
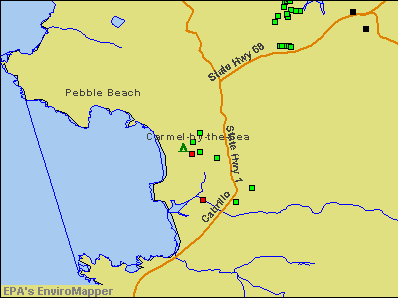
Notable locations in Carmel-by-the-Sea: (A) , Harrison Memorial Library (B) , Carmel City Hall (C) , Carmel-by-the-Sea Fire Department (D) . Display/hide their locations on the map
Shopping Center: (1) . Display/hide its location on the map
Churches in Carmel-by-the-Sea include: (A) , All Saints Episcopal Church (B) , Carmel Presbyterian Church (C) , Church of the Wayfarer (D) . Display/hide their locations on the map
Parks in Carmel-by-the-Sea include: (1) , Devendorf Park (2) , Forest Hills Park (3) , Larson Field (4) , Mission Trails Park (5) , Piccadilly Park (6) . Display/hide their locations on the map
Beach: (A) . Display/hide its location on the map
Birthplace of: Dick Sargent - Actor, Jeremy Sumpter - Actor, Country Dick Montana - Drummer.
Monterey County has a predicted average indoor radon screening level between 2 and 4 pCi/L (pico curies per liter) - Moderate Potential Average household size: This city:
1.8 peopleCalifornia:
2.9 people
Percentage of family households: This city:
48.6%Whole state:
68.7%
Percentage of households with unmarried partners: This city:
4.8%Whole state:
7.2%
Likely homosexual households (counted as self-reported same-sex unmarried-partner households)
Lesbian couples: 0.3% of all households Gay men: 0.6% of all households
For population 15 years and over in Carmel-by-the-Sea:
Never married: 16.6%Now married: 60.6%Separated: 0.7%Widowed: 3.9%Divorced: 18.3% For population 25 years and over in Carmel-by-the-Sea:
High school or higher: 95.5%Bachelor's degree or higher: 76.0%Graduate or professional degree: 28.8%Unemployed: 1.6%Mean travel time to work (commute): 20.5 minutes
Education Gini index (Inequality in education) Here:
7.8California average:
15.5
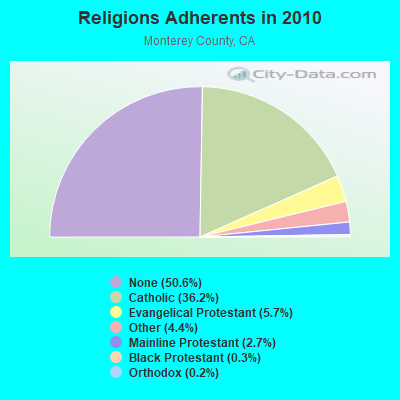
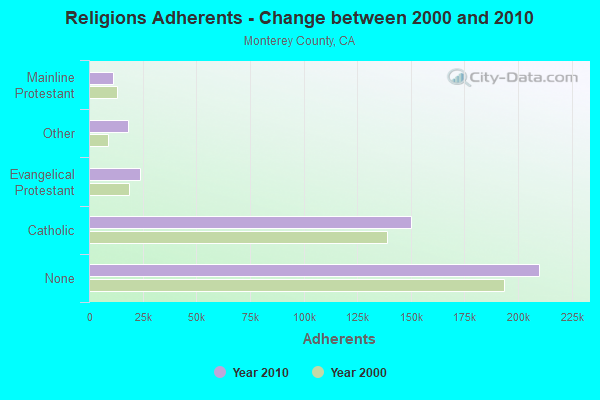
Religion statistics for Carmel-by-the-Sea, CA (based on Monterey County data)
Religion Adherents Congregations Catholic 150,050 26 Evangelical Protestant 23,624 154 Other 18,309 48 Mainline Protestant 11,244 48 Black Protestant 1,199 8 Orthodox 640 3 None 209,991 -
Source: Clifford Grammich, Kirk Hadaway, Richard Houseal, Dale E.Jones, Alexei Krindatch, Richie Stanley and Richard H.Taylor. 2012. 2010 U.S.Religion Census: Religious Congregations & Membership Study. Association of Statisticians of American Religious Bodies. Jones, Dale E., et al. 2002. Congregations and Membership in the United States 2000. Nashville, TN: Glenmary Research Center. Graphs represent county-level data
Food Environment Statistics: Number of grocery stores : 114Monterey County :
2.82 / 10,000 pop.State :
2.14 / 10,000 pop.
Number of supercenters and club stores : 2Monterey County :
0.05 / 10,000 pop.California :
0.04 / 10,000 pop.
Number of convenience stores (no gas) : 37Monterey County :
0.91 / 10,000 pop.California :
0.62 / 10,000 pop.
Number of convenience stores (with gas) : 81This county :
2.00 / 10,000 pop.State :
1.49 / 10,000 pop.
Number of full-service restaurants : 374Monterey County :
9.24 / 10,000 pop.California :
7.42 / 10,000 pop.
Adult diabetes rate : This county :
7.5%State :
7.3%
Adult obesity rate : Monterey County :
21.8%State :
21.3%
Low-income preschool obesity rate : Monterey County :
18.4%California :
17.9%
Health and Nutrition:
Average overall health of teeth and gums : This city:
47.4%California:
48.0%
People feeling badly about themselves : Here:
23.1%California:
20.2%
People not drinking alcohol at all : Average hours sleeping at night : Carmel-by-the-Sea:
6.9California:
6.8
Overweight people : This city:
37.2%California:
31.5%
General health condition : Carmel-by-the-Sea:
54.7%State:
56.4%
Average condition of hearing : Carmel-by-the-Sea:
73.8%California:
80.9%
More about Health and Nutrition of Carmel-by-the-Sea, CA Residents
Carmel-by-the-Sea government finances - Expenditure in 2017 (per resident):
Construction - Regular Highways: $731,000 ($232.36)
Local Fire Protection: $172,000 ($54.67)Police Protection: $117,000 ($37.19)Current Operations - Central Staff Services: $5,765,000 ($1832.49)
Police Protection: $3,589,000 ($1140.81)Parks and Recreation: $2,346,000 ($745.71)Local Fire Protection: $2,176,000 ($691.67)Health - Other: $1,251,000 ($397.65)Regular Highways: $1,111,000 ($353.15)Libraries: $1,022,000 ($324.86)Financial Administration: $665,000 ($211.38)Protective Inspection and Regulation - Other: $28,000 ($8.90)General - Interest on Debt: $532,000 ($169.10)
Other Capital Outlay - Parks and Recreation: $448,000 ($142.40)
General - Other: $260,000 ($82.64)Central Staff Services: $52,000 ($16.53)Libraries: $6,000 ($1.91)
Carmel-by-the-Sea government finances - Revenue in 2017 (per resident):
Charges - Other: $945,000 ($300.38)
Parks and Recreation: $31,000 ($9.85)Local Intergovernmental - Other: $92,000 ($29.24)
Miscellaneous - Rents: $121,000 ($38.46)
Fines and Forfeits: $96,000 ($30.51)Interest Earnings: $55,000 ($17.48)General Revenue - Other: $23,000 ($7.31)State Intergovernmental - Other: $162,000 ($51.49)
Highways: $74,000 ($23.52)General Local Government Support: $28,000 ($8.90)Tax - Other Selective Sales: $6,112,000 ($1942.78)
Property: $6,036,000 ($1918.63)Other: $2,833,000 ($900.51)Other License: $2,699,000 ($857.91)General Sales and Gross Receipts: $2,629,000 ($835.66)Public Utilities Sales: $673,000 ($213.92)Occupation and Business License - Other: $650,000 ($206.61)Documentary and Stock Transfer: $197,000 ($62.62)
Carmel-by-the-Sea government finances - Debt in 2017 (per resident):
Long Term Debt - Beginning Outstanding - Unspecified Public Purpose: $16,946,000 ($5386.52)
Outstanding Unspecified Public Purpose: $15,732,000 ($5000.64)Retired Unspecified Public Purpose: $1,214,000 ($385.89)
Carmel-by-the-Sea government finances - Cash and Securities in 2017 (per resident):
Other Funds - Cash and Securities: $11,754,000 ($3736.17)
Sinking Funds - Cash and Securities: $310,000 ($98.54)
4.96% of this county's 2021 resident taxpayers lived in other counties in 2020 ($91,945 average adjusted gross income )
Here:
4.96%California average:
5.19%
0.08% of residents moved from foreign countries ($1,276 average AGI )Monterey County:
0.08%California average:
0.03%
Top counties from which taxpayers relocated into this county between 2020 and 2021:
6.17% of this county's 2020 resident taxpayers moved to other counties in 2021 ($76,219 average adjusted gross income )
Here:
6.17%California average:
6.14%
0.08% of residents moved to foreign countries ($1,055 average AGI )Monterey County:
0.08%California average:
0.02%
Top counties to which taxpayers relocated from this county between 2020 and 2021: Businesses in Carmel-by-the-Sea, CA
Strongest AM radio stations in Carmel-by-the-Sea:
KRML (1410 AM; 2 kW; CARMEL, CA; Owner: WISDOM BROADCASTING CO, INC.)
KYAA (1200 AM; 25 kW; SOQUEL, CA; Owner: PEOPLE'S RADIO, INC.)
KNRY (1240 AM; 1 kW; MONTEREY, CA; Owner: PEOPLE'S RADIO, INC.)
KSRK (540 AM; 10 kW; CARMEL VALLEY, CA; Owner: PEOPLE'S RADIO, INC.)
KDBV (980 AM; 10 kW; SALINAS, CA; Owner: WOLFHOUSE RADIO GROUP, INC.)
KLOK (1170 AM; 50 kW; SAN JOSE, CA; Owner: ENTRAVISION HOLDINGS, LLC)
KKMC (880 AM; 10 kW; GONZALES, CA; Owner: MONTEREY COUNTY BROADCASTERS, INC.)
KION (1460 AM; 10 kW; SALINAS, CA)
KNBR (680 AM; 50 kW; SAN FRANCISCO, CA; Owner: KNBR LICO, INC.)
KGO (810 AM; 50 kW; SAN FRANCISCO, CA; Owner: KGO-AM RADIO, INC.)
KSCO (1080 AM; 10 kW; SANTA CRUZ, CA)
KIDD (630 AM; 1 kW; MONTEREY, CA; Owner: BUCKLEY COMMUNICATIONS, INC.)
KMBX (700 AM; 10 kW; SOLEDAD, CA; Owner: ENTRAVISION HOLDINGS, LLC)
Strongest FM radio stations in Carmel-by-the-Sea:
KMBY-FM (103.9 FM; SEASIDE, CA; Owner: MAPLETON COMMUNICATIONS, LLC)
KSPB (91.9 FM; PEBBLE BEACH, CA; Owner: ROBERT LOUIS STEVENSON SCHOOL)
KUSP (88.9 FM; SANTA CRUZ, CA; Owner: PATAPHYSICAL B/CING. FOUNDATION,INC.)
K260AA (99.9 FM; CARMEL VALLEY, CA; Owner: ENTRAVISION HOLDINGS, LLC)
KWAV (96.9 FM; MONTEREY, CA; Owner: BUCKLEY BROADCASTING OF MONTEREY)
KTOM-FM (100.7 FM; SALINAS, CA; Owner: CLEAR CHANNEL BROADCASTING LICENSES, INC.)
K291AE (106.1 FM; SEASIDE, CA; Owner: MAPELTON COMMUNICATIONS, LLC)
KBOQ (95.5 FM; CARMEL, CA; Owner: J & M BROADCASTING, INC.)
KMJO (92.7 FM; MARINA, CA; Owner: CLEAR CHANNEL BROADCASTING LICENSES, INC.)
KSES-FM (107.1 FM; SEASIDE, CA; Owner: ENTRAVISION HOLDINGS, LLC)
KAZU (90.3 FM; PACIFIC GROVE, CA; Owner: FOUNDATION OF CALIFORNIA STATE UNIVERSITY, MONTEREY BAY)
KCDU (101.7 FM; CARMEL, CA; Owner: MAPLETON COMMUNICATIONS, L.L.C.)
KOCN (105.1 FM; PACIFIC GROVE, CA; Owner: CLEAR CHANNEL BROADCASTING LICENSES, INC.)
KDON-FM (102.5 FM; SALINAS, CA; Owner: CLEAR CHANNEL BROADCASTING LICENSES, INC.)
K202DU (88.3 FM; SAN JUAN BAUTISTA, CA; Owner: CALVARY CHAPEL OF TWIN FALLS, INC.)
KBTU (93.5 FM; HOLLISTER, CA; Owner: MAPLETON COMMUNICATIONS, L.L.C.)
KLVM (89.7 FM; PRUNEDALE, CA; Owner: PRUNEDALE EDUCATIONAL ASSOCIATION)
K265DG (100.9 FM; HOLLISTER, CA; Owner: CLEAR CHANNEL BROADCASTING LICENSES, INC.)
K206BQ (89.1 FM; HOLLISTER, CA; Owner: PATAPHYSICAL BROADCASTING FOUNDATION, INC.)
KSQL (99.1 FM; SANTA CRUZ, CA; Owner: TMS LICENSE CALIFORNIA, INC)
TV broadcast stations around Carmel-by-the-Sea:
K53DT (Channel 53; MONTEREY, CA; Owner: TRINITY BROADCASTING NETWORK)
KION-TV (Channel 46; MONTEREY, CA; Owner: ACKERLEY MEDIA GROUP, INC.)
National Bridge Inventory (NBI) Statistics 3 Number of bridges79ft / 23.9m Total length42,600 Total average daily traffic34,726 Total future (year 2043) average daily traffic
FCC Registered Broadcast Land Mobile Towers: 2
End Of Weston Ridge Road (Lat: 36.405861 Lon: -121.902889), Type: Upole, Structure height: 12.2 m, Overall height: 18.3 m, Call Sign: WQGS653, Assigned Frequencies: 153.957 MHz, 154.965 MHz, 155.602 MHz, Grant Date: 04/26/2017, Expiration Date: 04/05/2027, Certifier: David C Dalby, Registrant: Apco International Inc, 351 N Williamson Blvd, Daytona Beach, FL 32114, Phone: (386) 944-2469, Email:
Lat: 36.554000 Lon: -121.923333, Call Sign: WQXE611, Assigned Frequencies: 151.542 MHz, 152.405 MHz, 157.665 MHz, 159.525 MHz, Grant Date: 02/12/2016, Expiration Date: 02/12/2026, Certifier: Crystal Petersson, Registrant: Silke Communications, 3 Crow Canyon Road, San Ramon, CA 94583, Phone: (925) 552-1820, Fax: (541) 687-1613, Email:
FCC Registered Microwave Towers: 1
SANTA LUCIA1, 6 Vista Cielo (Lat: 36.457444 Lon: -121.825444), Type: Pole, Structure height: 2.4 m, Overall height: 3 m, Call Sign: WQVC563, Assigned Frequencies: 17965.0 MHz, Grant Date: 12/30/2014, Expiration Date: 12/30/2024, Certifier: John E Monday, Registrant: At&t Services, Inc., 208 S Akard St, 20f, Dallas, TX 75202, Phone: (855) 699-7073, Fax: (214) 746-6410, Email:
FCC Registered Amateur Radio Licenses: 2
Call Sign: AA3XK, Previous Call Sign: KF3DB, Licensee ID: L00390756, Grant Date: 12/20/2016, Expiration Date: 02/06/2027, Certifier: Matthew E Witten, Registrant: Matthew W Harris, 87 High Meadow Lane, Carmel-By-The-Sea, CA 93923-9487Call Sign: KE7YOD, Licensee ID: L01448851, Grant Date: 10/15/2020, Expiration Date: 10/15/2030, Certifier: Jon B Wolfe, Registrant: Jon B Wolfe, Sw Cor N Casanova St And 2nd Ave, Carmel-By-The-Sea, CA 93921-0595
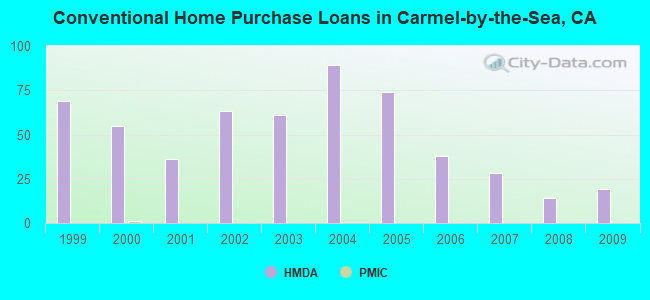
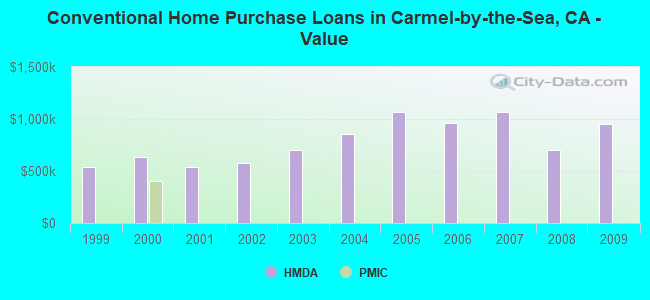
Home Mortgage Disclosure Act Aggregated Statistics For Year 2009(Based on 1 full tract) B) Conventional C) Refinancings D) Home Improvement Loans F) Non-occupant Loans on Number Average Value Number Average Value Number Average Value Number Average Value
LOANS ORIGINATED 19 $947,563 50 $537,358 6 $458,790 31 $720,896 APPLICATIONS APPROVED, NOT ACCEPTED 1 $817,070 5 $359,900 0 $0 3 $278,517 APPLICATIONS DENIED 0 $0 9 $620,691 1 $405,620 5 $562,416 APPLICATIONS WITHDRAWN 2 $766,000 7 $541,654 0 $0 3 $899,423 FILES CLOSED FOR INCOMPLETENESS 0 $0 2 $759,680 0 $0 0 $0
Aggregated Statistics For Year 2008(Based on 1 full tract) A) FHA, FSA/RHS & VA B) Conventional C) Refinancings D) Home Improvement Loans F) Non-occupant Loans on Number Average Value Number Average Value Number Average Value Number Average Value Number Average Value
LOANS ORIGINATED 0 $0 14 $703,609 20 $660,318 3 $364,113 18 $635,984 APPLICATIONS APPROVED, NOT ACCEPTED 0 $0 4 $879,320 6 $850,950 0 $0 3 $726,283 APPLICATIONS DENIED 0 $0 5 $787,498 11 $906,998 3 $905,583 9 $1,095,692 APPLICATIONS WITHDRAWN 1 $722,720 1 $437,720 3 $730,173 0 $0 2 $784,970 FILES CLOSED FOR INCOMPLETENESS 0 $0 1 $709,100 3 $731,147 0 $0 2 $471,275
Aggregated Statistics For Year 2007(Based on 1 full tract) B) Conventional C) Refinancings D) Home Improvement Loans F) Non-occupant Loans on Number Average Value Number Average Value Number Average Value Number Average Value
LOANS ORIGINATED 28 $1,065,384 43 $788,158 3 $796,317 39 $955,366 APPLICATIONS APPROVED, NOT ACCEPTED 0 $0 9 $855,436 0 $0 3 $821,930 APPLICATIONS DENIED 4 $1,228,035 10 $1,008,787 0 $0 3 $1,502,820 APPLICATIONS WITHDRAWN 2 $1,936,160 3 $1,691,850 0 $0 2 $2,431,750 FILES CLOSED FOR INCOMPLETENESS 0 $0 1 $1,069,970 0 $0 0 $0
Aggregated Statistics For Year 2006(Based on 1 full tract) B) Conventional C) Refinancings D) Home Improvement Loans E) Loans on Dwellings For 5+ Families F) Non-occupant Loans on Number Average Value Number Average Value Number Average Value Number Average Value Number Average Value
LOANS ORIGINATED 38 $956,855 51 $721,190 8 $455,466 1 $802,480 39 $775,841 APPLICATIONS APPROVED, NOT ACCEPTED 5 $833,798 14 $745,922 0 $0 0 $0 5 $663,382 APPLICATIONS DENIED 7 $422,707 10 $962,681 2 $537,905 0 $0 8 $682,958 APPLICATIONS WITHDRAWN 2 $574,865 8 $889,048 1 $73,930 0 $0 3 $625,447 FILES CLOSED FOR INCOMPLETENESS 1 $1,089,420 5 $486,934 0 $0 0 $0 2 $686,725
Aggregated Statistics For Year 2005(Based on 1 full tract) B) Conventional C) Refinancings D) Home Improvement Loans E) Loans on Dwellings For 5+ Families F) Non-occupant Loans on Number Average Value Number Average Value Number Average Value Number Average Value Number Average Value
LOANS ORIGINATED 74 $1,067,012 80 $686,288 12 $916,364 1 $1,335,520 77 $895,490 APPLICATIONS APPROVED, NOT ACCEPTED 9 $870,674 7 $891,827 1 $350,170 0 $0 6 $995,397 APPLICATIONS DENIED 9 $1,102,177 16 $954,948 1 $72,950 0 $0 13 $1,258,748 APPLICATIONS WITHDRAWN 11 $1,531,914 11 $442,932 0 $0 0 $0 10 $1,211,206 FILES CLOSED FOR INCOMPLETENESS 1 $1,304,390 5 $491,214 0 $0 0 $0 2 $748,005
Aggregated Statistics For Year 2004(Based on 1 full tract) B) Conventional C) Refinancings D) Home Improvement Loans F) Non-occupant Loans on Number Average Value Number Average Value Number Average Value Number Average Value
LOANS ORIGINATED 89 $853,331 141 $617,085 11 $495,015 94 $686,768 APPLICATIONS APPROVED, NOT ACCEPTED 9 $563,950 14 $545,406 3 $520,393 7 $491,353 APPLICATIONS DENIED 9 $828,740 28 $668,801 1 $291,810 13 $669,592 APPLICATIONS WITHDRAWN 14 $889,465 14 $473,983 2 $57,390 12 $742,008 FILES CLOSED FOR INCOMPLETENESS 4 $506,048 4 $1,026,198 0 $0 0 $0
Aggregated Statistics For Year 2003(Based on 1 full tract) B) Conventional C) Refinancings D) Home Improvement Loans E) Loans on Dwellings For 5+ Families F) Non-occupant Loans on Number Average Value Number Average Value Number Average Value Number Average Value Number Average Value
LOANS ORIGINATED 61 $705,479 364 $463,454 2 $340,445 0 $0 200 $501,505 APPLICATIONS APPROVED, NOT ACCEPTED 7 $675,470 42 $504,646 1 $38,910 0 $0 17 $447,385 APPLICATIONS DENIED 5 $874,458 39 $621,381 0 $0 0 $0 13 $410,031 APPLICATIONS WITHDRAWN 5 $626,224 30 $467,285 0 $0 0 $0 16 $470,361 FILES CLOSED FOR INCOMPLETENESS 2 $200,375 10 $636,535 0 $0 1 $1,118,610 3 $389,080
Aggregated Statistics For Year 2002(Based on 1 full tract) B) Conventional C) Refinancings D) Home Improvement Loans E) Loans on Dwellings For 5+ Families F) Non-occupant Loans on Number Average Value Number Average Value Number Average Value Number Average Value Number Average Value
LOANS ORIGINATED 63 $573,291 240 $474,629 2 $40,365 3 $2,577,657 134 $456,835 APPLICATIONS APPROVED, NOT ACCEPTED 4 $489,512 23 $575,120 0 $0 0 $0 12 $533,121 APPLICATIONS DENIED 9 $839,872 25 $500,046 0 $0 0 $0 15 $704,040 APPLICATIONS WITHDRAWN 4 $446,955 18 $481,703 0 $0 0 $0 4 $374,732 FILES CLOSED FOR INCOMPLETENESS 2 $768,435 4 $419,962 0 $0 0 $0 3 $609,560
Aggregated Statistics For Year 2001(Based on 1 full tract) B) Conventional C) Refinancings D) Home Improvement Loans F) Non-occupant Loans on Number Average Value Number Average Value Number Average Value Number Average Value
LOANS ORIGINATED 36 $538,065 116 $492,228 8 $168,399 67 $471,048 APPLICATIONS APPROVED, NOT ACCEPTED 5 $426,042 14 $429,030 1 $9,730 7 $432,851 APPLICATIONS DENIED 8 $489,876 19 $401,418 1 $34,040 6 $356,982 APPLICATIONS WITHDRAWN 4 $494,860 10 $843,525 1 $97,270 5 $661,046 FILES CLOSED FOR INCOMPLETENESS 0 $0 15 $576,617 0 $0 4 $817,798
Aggregated Statistics For Year 2000(Based on 1 full tract) B) Conventional C) Refinancings D) Home Improvement Loans F) Non-occupant Loans on Number Average Value Number Average Value Number Average Value Number Average Value
LOANS ORIGINATED 55 $630,203 30 $433,695 7 $184,119 38 $571,538 APPLICATIONS APPROVED, NOT ACCEPTED 9 $428,744 3 $337,203 0 $0 2 $323,425 APPLICATIONS DENIED 5 $430,518 4 $268,708 4 $87,542 4 $403,912 APPLICATIONS WITHDRAWN 5 $414,176 6 $254,198 0 $0 1 $218,860 FILES CLOSED FOR INCOMPLETENESS 5 $567,668 2 $340,445 1 $9,730 3 $568,707
Aggregated Statistics For Year 1999(Based on 1 partial tract) A) FHA, FSA/RHS & VA B) Conventional C) Refinancings D) Home Improvement Loans E) Loans on Dwellings For 5+ Families F) Non-occupant Loans on Number Average Value Number Average Value Number Average Value Number Average Value Number Average Value Number Average Value
LOANS ORIGINATED 1 $128,380 69 $535,940 56 $282,027 4 $46,998 1 $458,500 60 $500,392 APPLICATIONS APPROVED, NOT ACCEPTED 0 $0 9 $666,761 13 $322,714 0 $0 0 $0 6 $448,260 APPLICATIONS DENIED 0 $0 9 $549,691 7 $338,897 1 $229,250 0 $0 3 $485,400 APPLICATIONS WITHDRAWN 0 $0 10 $387,799 17 $373,165 0 $0 0 $0 6 $379,332 FILES CLOSED FOR INCOMPLETENESS 0 $0 3 $277,850 1 $385,140 0 $0 0 $0 1 $449,330
Detailed HMDA statistics for the following Tracts:
0118.00
Private Mortgage Insurance Companies Aggregated Statistics For Year 2003(Based on 1 full tract) A) Conventional C) Non-occupant Loans on Number Average Value Number Average Value
LOANS ORIGINATED 0 $0 0 $0 APPLICATIONS APPROVED, NOT ACCEPTED 1 $276,250 1 $276,250 APPLICATIONS DENIED 0 $0 0 $0 APPLICATIONS WITHDRAWN 0 $0 0 $0 FILES CLOSED FOR INCOMPLETENESS 0 $0 0 $0
Aggregated Statistics For Year 2000(Based on 1 full tract) A) Conventional Number Average Value
LOANS ORIGINATED 1 $400,750 APPLICATIONS APPROVED, NOT ACCEPTED 0 $0 APPLICATIONS DENIED 0 $0 APPLICATIONS WITHDRAWN 0 $0 FILES CLOSED FOR INCOMPLETENESS 0 $0
Detailed PMIC statistics for the following Tracts:
0118.00
Carmel-by-the-Sea compared to California state average:
Median house value significantly above state average. Unemployed percentage significantly below state average. Black race population percentage significantly below state average. Hispanic race population percentage significantly below state average. Median age significantly above state average. Foreign-born population percentage significantly below state average. Length of stay since moving in significantly above state average. House age above state average. Number of college students significantly below state average. Percentage of population with a bachelor's degree or higher significantly above state average. Carmel-by-the-Sea on our top lists :
#33 on the list of "Top 101 cities with the most residents born in Australia (population 500+)"
#48 on the list of "Top 100 cities with highest ratio of median house value to median household income"
#54 on the list of "Top 100 cities with highest median house value"
#58 on the list of "Top 101 cities with the most residents born in Australia and New Zealand Subregion (population 500+)"
#90 on the list of "Top 101 cities with the most residents born in France (population 500+)"
#31 (93923) on the list of "Top 101 zip codes with the smallest percentage of returns reporting salary or wage in 2012 (pop 5,000+)"
#85 (93923) on the list of "Top 101 zip codes with the largest percentage of taxpayers reporting net capital gain/loss in 2012 (pop 5,000+)"
#15 on the list of "Top 101 counties with the highest Nitrogen Dioxide air pollution readings in 2012 (ppm)"
#20 on the list of "Top 101 counties with the lowest surface withdrawal of fresh water for public supply (pop. 50,000+)"
#33 on the list of "Top 101 counties with the highest number of births per 1000 residents 2007-2013"
#44 on the list of "Top 101 counties with the lowest Particulate Matter (PM2.5 ) Annual air pollution readings in 2012 (µg/m3 )"
#54 on the list of "Top 101 counties with the highest Particulate Matter (PM10 ) Annual air pollution readings in 2012 (µg/m3 )"


 Recent articles from our blog. Our writers, many of them Ph.D. graduates or candidates, create easy-to-read articles on a wide variety of topics.

 (17.8 miles