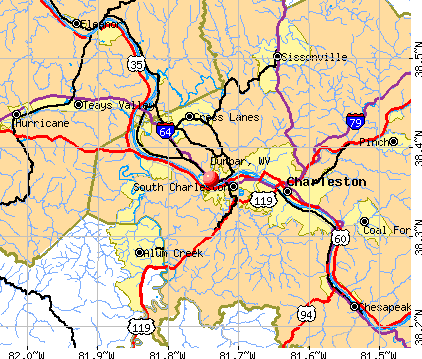
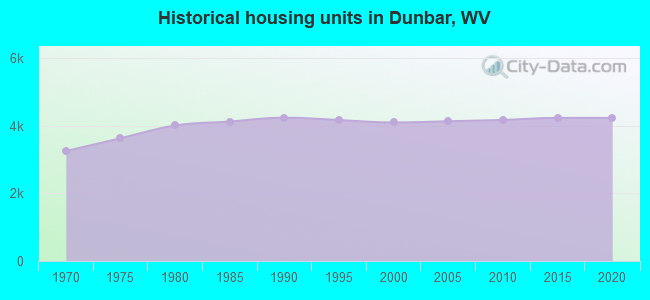
Dunbar, West Virginia
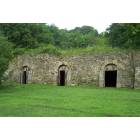
Dunbar: Historical Wine Cellars
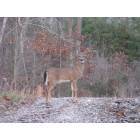
Dunbar: Path to Laura Anderson Lake
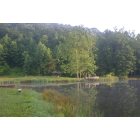
Dunbar: Laura Anderson Lake in Dunbar
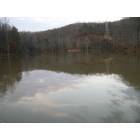
Dunbar: Laura Anderson Lake
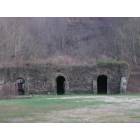
Dunbar: Wine Cellars
Dunbar: Memories of Dunbar Union District High School, Dunbar High School and Dunbar Jr. High School
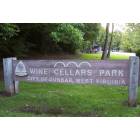
Dunbar: Wine Cellar Park Sign
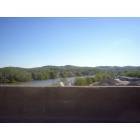
Dunbar: dunbar interstate bridge
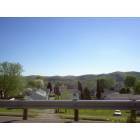
Dunbar: View from Dunbar interstate
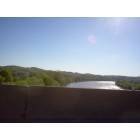
Dunbar: View from Dunbar interstate bridge
- add
your
Submit your own pictures of this city and show them to the world
- OSM Map
- General Map
- Google Map
- MSN Map
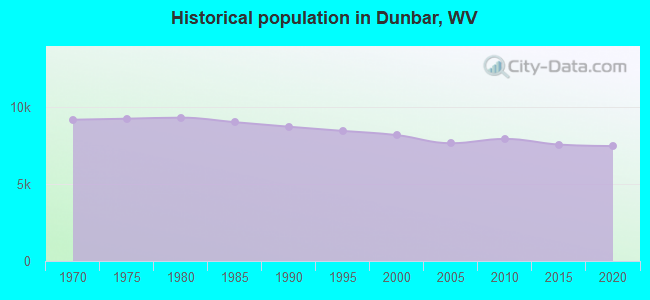
Population change since 2000: -11.7%
 |
| Males: 3,385 | |
| Females: 3,818 |
| Median resident age: | 44.4 years |
| West Virginia median age: | 42.9 years |
Zip codes: 25064.
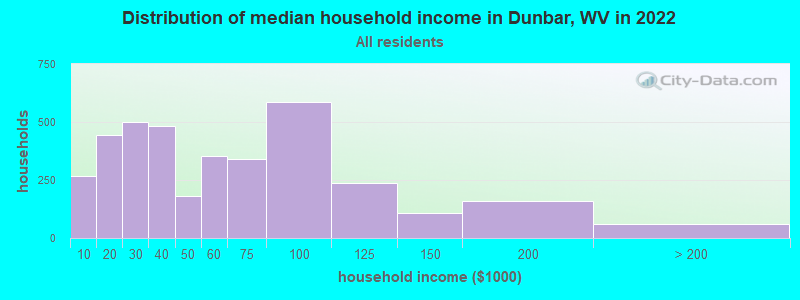
| Dunbar: | $48,386 |
| WV: | $54,329 |
Estimated per capita income in 2022: $32,361 (it was $19,030 in 2000)
Dunbar city income, earnings, and wages data
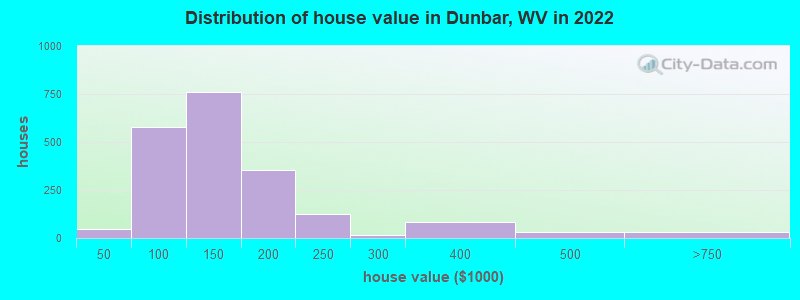
Estimated median house or condo value in 2022: $127,651 (it was $75,400 in 2000)
| Dunbar: | $127,651 |
| WV: | $155,100 |
Mean prices in 2022: all housing units: $176,674; detached houses: $190,210; townhouses or other attached units: $142,503; in 2-unit structures: $164,603; in 3-to-4-unit structures: $183,543; in 5-or-more-unit structures: $170,194; mobile homes: $73,209; occupied boats, rvs, vans, etc.: $8,000
Median gross rent in 2022: $878.
(12.2% for White Non-Hispanic residents, 20.4% for Black residents, 62.0% for two or more races residents)
Detailed information about poverty and poor residents in Dunbar, WV
Compare current foreclosures near Dunbar, WV:
| Photo | Address | Area | Beds / Baths | Price | Details |
|---|---|---|---|---|---|

|
#1
26th St
Dunbar, WV 25064
|
- sq. feet
|
- baths - beds |
show details | |

|
#2
Filmore St
Dunbar, WV 25064
|
- sq. feet
|
- baths - beds |
show details | |

|
#3
Everette Ln
Dunbar, WV 25064
|
- sq. feet
|
- baths - beds |
show details | |

|
#4
Oak Dr Apt G
Dunbar, WV 25064
|
- sq. feet
|
- baths - beds |
show details | |

|
#5
Frame St
Charleston, WV 25302
|
1,150 sq. feet
|
1 baths 2 beds |
$24,900
|
show details |

|
#6
Redmans Ct
Charleston, WV 25313
|
819 sq. feet
|
1 baths 2 beds |
$29,900
|
show details |

|
#7
Scarlet Dr
Poca, WV 25159
|
2,687 sq. feet
|
3 baths 4 beds |
$330,000
|
show details |

|
#8
Main St
Hurricane, WV 25526
|
2,838 sq. feet
|
2 baths 4 beds |
$59,900
|
show details |

|
#9
Echo Rd
Charleston, WV 25303
|
1,770 sq. feet
|
2 baths 3 beds |
$239,900
|
show details |

|
#10
Westmoreland Dr
Dunbar, WV 25064
|
- sq. feet
|
- baths - beds |
show details |
| Photo | Address | Area | Beds / Baths | Price | Details |
|---|---|---|---|---|---|

|
#11
Woodward Dr
Charleston, WV 25312
|
1,249 sq. feet
|
1 baths 3 beds |
$60,000
|
show details |

|
#12
Maplewood Ln
Nitro, WV 25143
|
1,176 sq. feet
|
1 baths 2 beds |
show details | |

|
#13
Rocky Fork Rd
Charleston, WV 25312
|
- sq. feet
|
2 baths 3 beds |
show details | |

|
#14
Winners Cir
Hurricane, WV 25526
|
2,133 sq. feet
|
1 baths 3 beds |
show details | |

|
#15
Highland Dr
Saint Albans, WV 25177
|
1,316 sq. feet
|
3 baths 3 beds |
show details | |

|
#16
Circle Way
Scott Depot, WV 25560
|
1,533 sq. feet
|
2 baths 3 beds |
show details | |

|
#17
Northway Dr
Saint Albans, WV 25177
|
933 sq. feet
|
1 baths 2 beds |
show details | |

|
#18
Springfield Dr
Charleston, WV 25306
|
1,116 sq. feet
|
1 baths 3 beds |
show details | |

|
#19
Holley St
Saint Albans, WV 25177
|
1,923 sq. feet
|
2 baths 6 beds |
show details | |

|
#20
Evergreen Cir
Poca, WV 25159
|
1,080 sq. feet
|
2 baths 3 beds |
show details |
| Photo | Address | Area | Beds / Baths | Price | Details |
|---|---|---|---|---|---|

|
#21
6th St
Charleston, WV 25302
|
1,115 sq. feet
|
2 baths 3 beds |
show details | |

|
#22
Limeberger Creek Rd
Poca, WV 25159
|
1,025 sq. feet
|
1 baths 3 beds |
show details | |

|
#23
Fishers Branch Rd
Charleston, WV 25312
|
1,288 sq. feet
|
2 baths 4 beds |
show details | |

|
#24
Friendly Dr
Charleston, WV 25387
|
- sq. feet
|
- baths - beds |
$39,900
|
show details |

|
#25
Jordan Dr
Costa, WV 25051
|
- sq. feet
|
1 baths 3 beds |
show details | |

|
#26
Mclane Pike
Liberty, WV 25124
|
1,306 sq. feet
|
2 baths 3 beds |
show details | |

|
#27
Woodward Dr
Charleston, WV 25312
|
- sq. feet
|
- baths - beds |
$27,900
|
show details |

|
#28
Virginia St E
Charleston, WV 25311
|
- sq. feet
|
2 baths 5 beds |
show details | |

|
#29
Green Valley Dr
Saint Albans, WV 25177
|
- sq. feet
|
- baths - beds |
$19,900
|
show details |

|
#30
Summit Dr
Charleston, WV 25302
|
- sq. feet
|
- baths - beds |
$24,900
|
show details |
| Photo | Address | Area | Beds / Baths | Price | Details |
|---|---|---|---|---|---|

|
#31
Green Valley Dr
Saint Albans, WV 25177
|
- sq. feet
|
- baths - beds |
$39,900
|
show details |

|
#32
E 8th St
Belle, WV 25015
|
- sq. feet
|
- baths - beds |
show details | |

|
#33
Morning Rd
Hurricane, WV 25526
|
- sq. feet
|
- baths - beds |
show details | |

|
#34
Zinc Ln
Red House, WV 25168
|
- sq. feet
|
- baths - beds |
show details | |

|
#35
Sleepy Hollow Dr
Hurricane, WV 25526
|
- sq. feet
|
- baths - beds |
show details | |

|
#36
Harbour Ln
Hurricane, WV 25526
|
- sq. feet
|
- baths - beds |
show details | |

|
#37
Hurricane Creek Rd
Hurricane, WV 25526
|
- sq. feet
|
- baths - beds |
show details | |

|
#38
Greenwood Ave
Charleston, WV 25302
|
- sq. feet
|
- baths - beds |
show details | |

|
#39
Chelsea Xing
Hurricane, WV 25526
|
- sq. feet
|
- baths - beds |
show details | |

|
#40
Roselane Dr # C
Charleston, WV 25302
|
- sq. feet
|
- baths - beds |
show details |
| Photo | Address | Area | Beds / Baths | Price | Details |
|---|---|---|---|---|---|

|
#41
Kens Lake Estates Rd
Winfield, WV 25213
|
- sq. feet
|
- baths - beds |
show details | |

|
#42
Venable Ave
Charleston, WV 25304
|
- sq. feet
|
- baths - beds |
show details | |

|
#43
W Gardner Ave
Belle, WV 25015
|
- sq. feet
|
- baths - beds |
show details | |

|
#44
Midway Rd
Alum Creek, WV 25003
|
- sq. feet
|
- baths - beds |
show details | |

|
#45
Wise Dr
Charleston, WV 25306
|
- sq. feet
|
- baths - beds |
show details | |

|
#46
Seville Dr
Hurricane, WV 25526
|
- sq. feet
|
- baths - beds |
show details | |

|
#47
136th St
Charleston, WV 25315
|
- sq. feet
|
- baths - beds |
show details | |

|
#48
Mccorkle Rd
Sod, WV 25564
|
- sq. feet
|
- baths - beds |
show details | |

|
#49
Southridge Way
Hurricane, WV 25526
|
- sq. feet
|
- baths - beds |
show details | |

|
Check over 1 million property listings on Foreclosure.com!
|
browse all offers | |||


- 5,45075.3%White alone
- 1,03514.3%Black alone
- 3805.3%Two or more races
- 2132.9%Hispanic
- 1492.1%Native Hawaiian and Other
Pacific Islander alone - 781.1%Asian alone
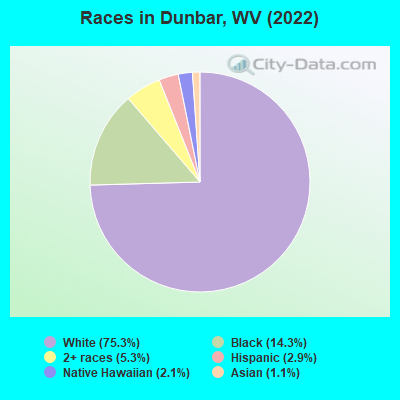
Races in Dunbar detailed stats: ancestries, foreign born residents, place of birth
According to our research of West Virginia and other state lists, there were 24 registered sex offenders living in Dunbar, West Virginia as of April 19, 2024.
The ratio of all residents to sex offenders in Dunbar is 319 to 1.
The ratio of registered sex offenders to all residents in this city is near the state average.
Type |
2009 |
2010 |
2011 |
2012 |
2013 |
2014 |
2015 |
2016 |
2017 |
2018 |
2019 |
2020 |
2021 |
2022 |
|---|---|---|---|---|---|---|---|---|---|---|---|---|---|---|
| Murders (per 100,000) | 0 (0.0) | 0 (0.0) | 1 (12.6) | 0 (0.0) | 1 (12.8) | 0 (0.0) | 0 (0.0) | 0 (0.0) | 1 (13.4) | 1 (13.8) | 1 (14.0) | 0 (0.0) | 0 (0.0) | 0 (0.0) |
| Rapes (per 100,000) | 1 (13.1) | 3 (37.9) | 3 (37.9) | 5 (63.5) | 4 (51.1) | 3 (38.4) | 2 (25.9) | 3 (39.4) | 2 (26.7) | 5 (68.9) | 6 (84.2) | 3 (42.8) | 5 (72.8) | 4 (55.4) |
| Robberies (per 100,000) | 6 (78.8) | 5 (63.2) | 9 (113.7) | 7 (88.9) | 6 (76.6) | 4 (51.1) | 8 (103.7) | 6 (78.8) | 3 (40.1) | 0 (0.0) | 11 (154.4) | 11 (156.9) | 2 (29.1) | 1 (13.9) |
| Assaults (per 100,000) | 12 (157.6) | 30 (379.4) | 24 (303.1) | 24 (304.7) | 13 (165.9) | 7 (89.5) | 22 (285.3) | 21 (275.9) | 32 (427.5) | 40 (550.8) | 67 (940.6) | 44 (627.7) | 32 (465.9) | 32 (443.3) |
| Burglaries (per 100,000) | 51 (669.8) | 50 (632.4) | 45 (568.4) | 71 (901.5) | 46 (587.2) | 55 (703.2) | 55 (713.3) | 68 (893.3) | 54 (721.3) | 73 (1,005) | 57 (800.2) | 48 (684.7) | 61 (888.2) | 26 (360.2) |
| Thefts (per 100,000) | 131 (1,721) | 140 (1,771) | 119 (1,503) | 154 (1,955) | 109 (1,391) | 136 (1,739) | 196 (2,542) | 147 (1,931) | 161 (2,151) | 198 (2,727) | 145 (2,036) | 136 (1,940) | 130 (1,893) | 69 (955.9) |
| Auto thefts (per 100,000) | 20 (262.7) | 11 (139.1) | 9 (113.7) | 13 (165.1) | 8 (102.1) | 5 (63.9) | 26 (337.2) | 19 (249.6) | 43 (574.4) | 43 (592.1) | 23 (322.9) | 21 (299.6) | 24 (349.4) | 9 (124.7) |
| Arson (per 100,000) | 5 (65.7) | 2 (25.3) | 5 (63.2) | 1 (12.7) | 1 (12.8) | 2 (25.6) | 1 (13.0) | 6 (78.8) | 0 (0.0) | 2 (27.5) | 2 (28.1) | 4 (57.1) | 3 (43.7) | 5 (69.3) |
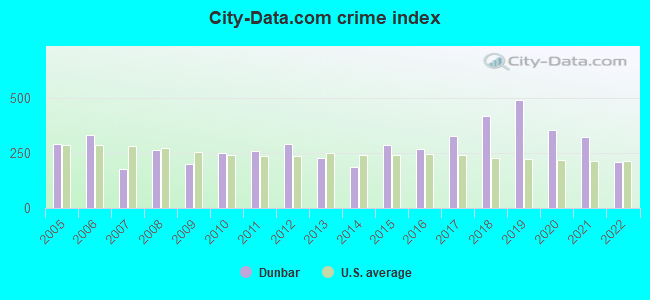
| City-Data.com crime index | 202.4 | 251.4 | 259.3 | 292.9 | 227.5 | 187.8 | 287.5 | 270.1 | 328.1 | 419.6 | 493.2 | 356.3 | 326.0 | 210.6 |
The City-Data.com crime index weighs serious crimes and violent crimes more heavily. Higher means more crime, U.S. average is 246.1. It adjusts for the number of visitors and daily workers commuting into cities.
Crime rate in Dunbar detailed stats: murders, rapes, robberies, assaults, burglaries, thefts, arson
Full-time law enforcement employees in 2021, including police officers: 17 (16 officers - 16 male; 0 female).
| Officers per 1,000 residents here: | 2.33 |
| West Virginia average: | 1.95 |
 Recent articles from our blog. Our writers, many of them Ph.D. graduates or candidates, create easy-to-read articles on a wide variety of topics.

 | Restaurants and Stores in Charleston are going up!!! (962 replies) |
| Little Creek Village & Park Place South Charleston (209 replies) |
| Alternate universe where Charleston continued to grow (36 replies) |
| Observations Of The Town (15 replies) |
| Can Charleston become the next Asheville? (47 replies) |
| Charleston Town Center sold? (296 replies) |
Latest news from Dunbar, WV collected exclusively by city-data.com from local newspapers, TV, and radio stations
Ancestries: English (13.7%), American (12.4%), Irish (11.4%), German (7.6%), Scotch-Irish (5.0%), European (3.5%).
Current Local Time: EST time zone
Incorporated on 04/19/1921
Elevation: 603 feet
Land area: 2.84 square miles.
Population density: 2,539 people per square mile (average).
20 residents are foreign born
| This city: | 0.3% |
| West Virginia: | 1.6% |
Median real estate property taxes paid for housing units with mortgages in 2022: $990 (0.7%)
Median real estate property taxes paid for housing units with no mortgage in 2022: $743 (0.7%)
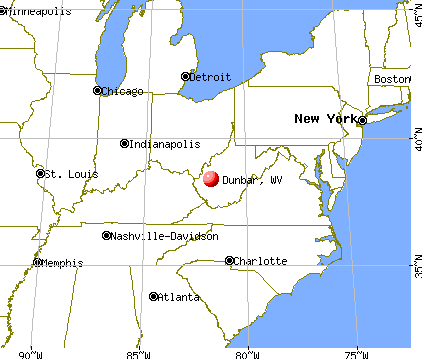
Nearest city with pop. 50,000+: Charleston, WV  (5.9 miles , pop. 53,421).
Nearest city with pop. 200,000+: Columbus, OH (130.9 miles , pop. 711,470).
Nearest city with pop. 1,000,000+: Philadelphia, PA (371.1 miles , pop. 1,517,550).
Nearest cities:
), ), )Latitude: 38.36 N, Longitude: 81.74 W
Daytime population change due to commuting: -1,267 (-17.5%)
Workers who live and work in this city: 535 (14.7%)
Area code commonly used in this area: 304
Property values in Dunbar, WV
Dunbar, West Virginia accommodation & food services, waste management - Economy and Business Data
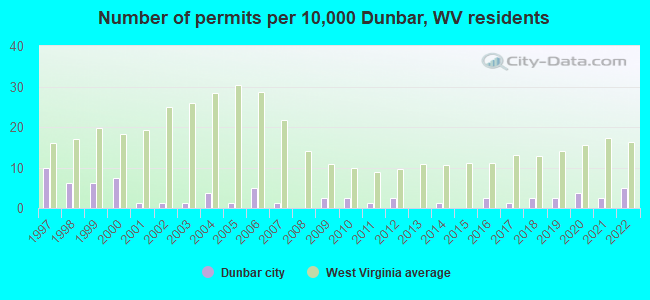
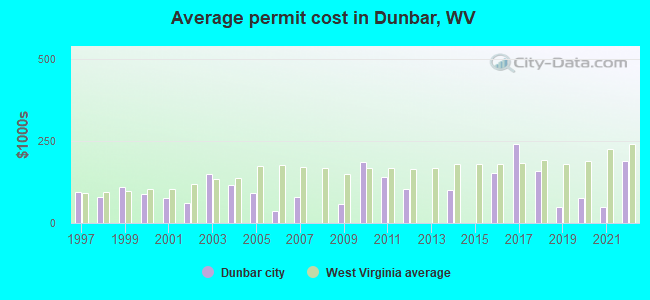
Single-family new house construction building permits:
- 2022: 4 buildings, average cost: $187,500
- 2021: 2 buildings, average cost: $50,000
- 2020: 3 buildings, average cost: $77,000
- 2019: 2 buildings, average cost: $47,500
- 2018: 2 buildings, average cost: $160,200
- 2017: 1 building, cost: $240,900
- 2016: 2 buildings, average cost: $153,000
- 2014: 1 building, cost: $100,000
- 2012: 2 buildings, average cost: $105,000
- 2011: 1 building, cost: $140,700
- 2010: 2 buildings, average cost: $185,000
- 2009: 2 buildings, average cost: $59,000
- 2007: 1 building, cost: $80,000
- 2006: 4 buildings, average cost: $36,800
- 2005: 1 building, cost: $91,100
- 2004: 3 buildings, average cost: $114,800
- 2003: 1 building, cost: $150,000
- 2002: 1 building, cost: $60,000
- 2001: 1 building, cost: $75,000
- 2000: 6 buildings, average cost: $87,700
- 1999: 5 buildings, average cost: $109,600
- 1998: 5 buildings, average cost: $78,400
- 1997: 8 buildings, average cost: $95,300
| Here: | 3.7% |
| West Virginia: | 4.0% |
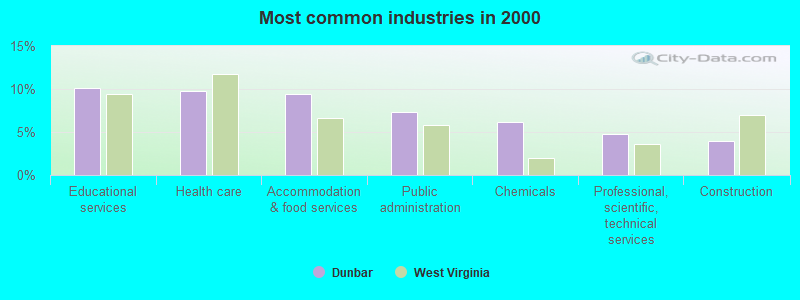
- Educational services (10.1%)
- Health care (9.8%)
- Accommodation & food services (9.4%)
- Public administration (7.3%)
- Chemicals (6.1%)
- Professional, scientific, technical services (4.8%)
- Construction (4.0%)
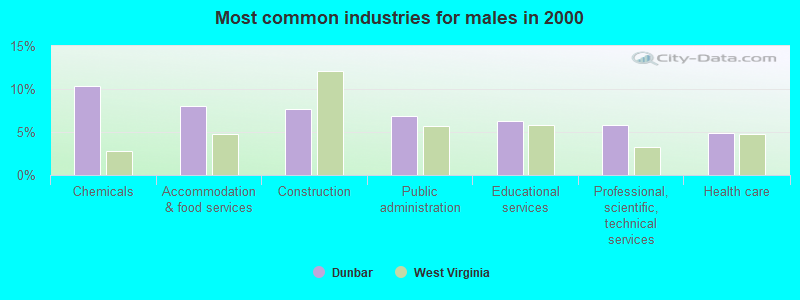
- Chemicals (10.4%)
- Accommodation & food services (8.1%)
- Construction (7.7%)
- Public administration (6.9%)
- Educational services (6.2%)
- Professional, scientific, technical services (5.8%)
- Health care (4.8%)
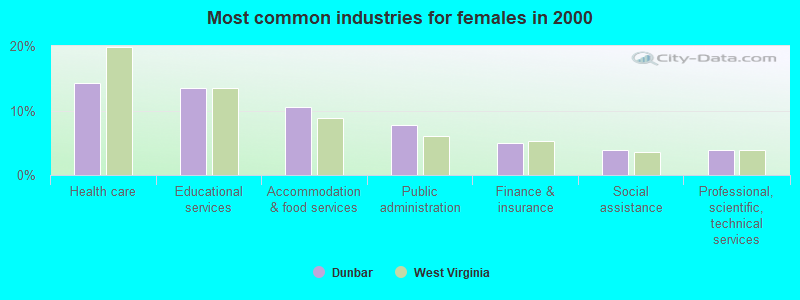
- Health care (14.2%)
- Educational services (13.5%)
- Accommodation & food services (10.6%)
- Public administration (7.7%)
- Finance & insurance (5.0%)
- Social assistance (3.9%)
- Professional, scientific, technical services (3.9%)
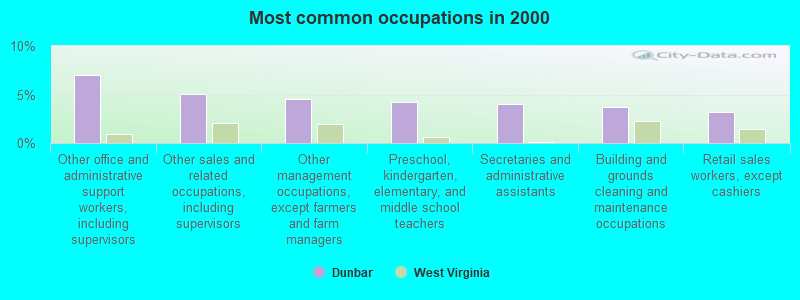
- Other office and administrative support workers, including supervisors (7.0%)
- Other sales and related occupations, including supervisors (5.0%)
- Other management occupations, except farmers and farm managers (4.6%)
- Preschool, kindergarten, elementary, and middle school teachers (4.2%)
- Secretaries and administrative assistants (4.1%)
- Building and grounds cleaning and maintenance occupations (3.7%)
- Retail sales workers, except cashiers (3.2%)
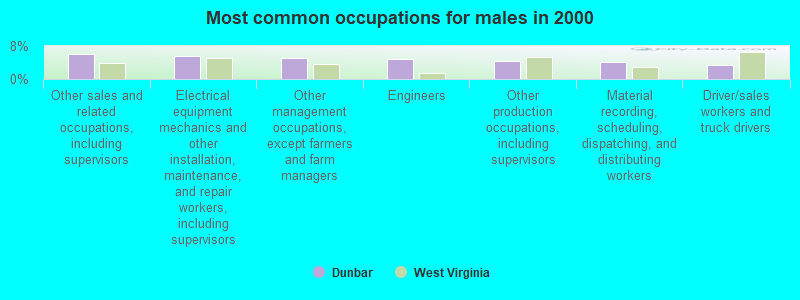
- Other sales and related occupations, including supervisors (6.1%)
- Electrical equipment mechanics and other installation, maintenance, and repair workers, including supervisors (5.7%)
- Other management occupations, except farmers and farm managers (5.1%)
- Engineers (5.0%)
- Other production occupations, including supervisors (4.4%)
- Material recording, scheduling, dispatching, and distributing workers (4.1%)
- Driver/sales workers and truck drivers (3.4%)
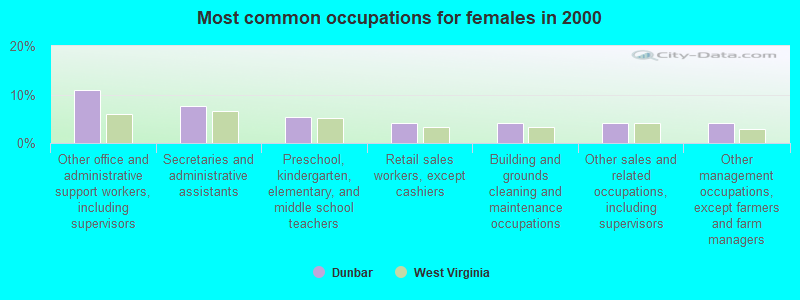
- Other office and administrative support workers, including supervisors (10.9%)
- Secretaries and administrative assistants (7.7%)
- Preschool, kindergarten, elementary, and middle school teachers (5.4%)
- Retail sales workers, except cashiers (4.2%)
- Building and grounds cleaning and maintenance occupations (4.1%)
- Other sales and related occupations, including supervisors (4.1%)
- Other management occupations, except farmers and farm managers (4.0%)
Average climate in Dunbar, West Virginia
Based on data reported by over 4,000 weather stations


|
|

(lower is better)
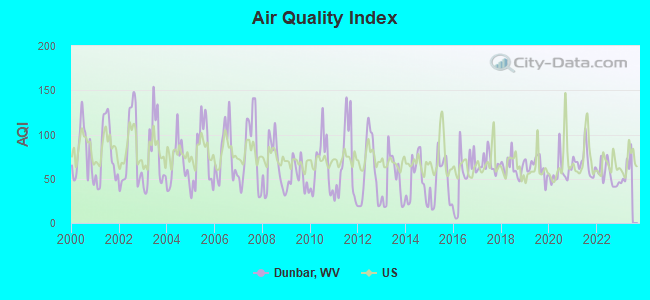
Air Quality Index (AQI) level in 2022 was 54.5. This is better than average.
| City: | 54.5 |
| U.S.: | 72.6 |
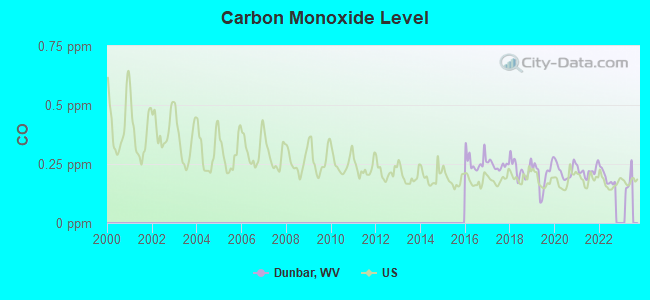
Carbon Monoxide (CO) [ppm] level in 2022 was 0.193. This is better than average. Closest monitor was 6.5 miles away from the city center.
| City: | 0.193 |
| U.S.: | 0.251 |
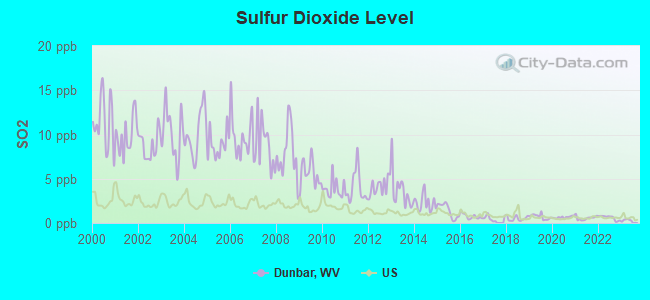
Sulfur Dioxide (SO2) [ppb] level in 2022 was 0.596. This is significantly better than average. Closest monitor was 1.5 miles away from the city center.
| City: | 0.596 |
| U.S.: | 1.515 |
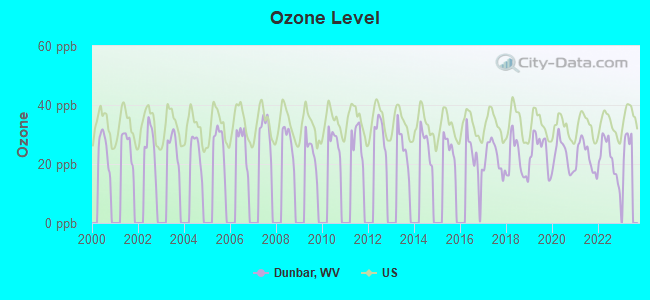
Ozone [ppb] level in 2022 was 21.7. This is significantly better than average. Closest monitor was 6.2 miles away from the city center.
| City: | 21.7 |
| U.S.: | 33.3 |
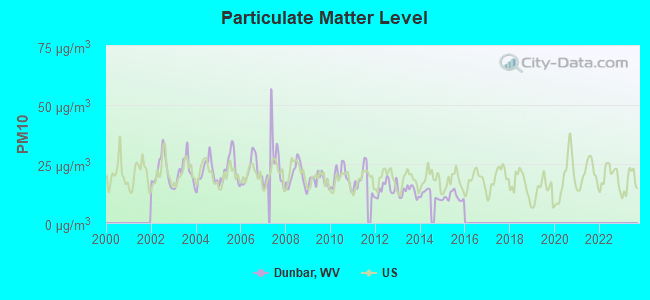
Particulate Matter (PM10) [µg/m3] level in 2015 was 11.1. This is significantly better than average. Closest monitor was 2.5 miles away from the city center.
| City: | 11.1 |
| U.S.: | 19.2 |
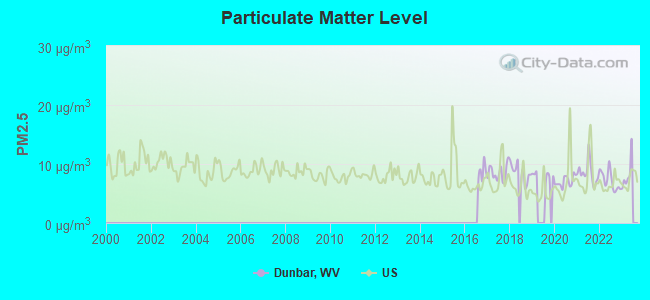
Particulate Matter (PM2.5) [µg/m3] level in 2022 was 7.21. This is about average. Closest monitor was 2.5 miles away from the city center.
| City: | 7.21 |
| U.S.: | 8.11 |
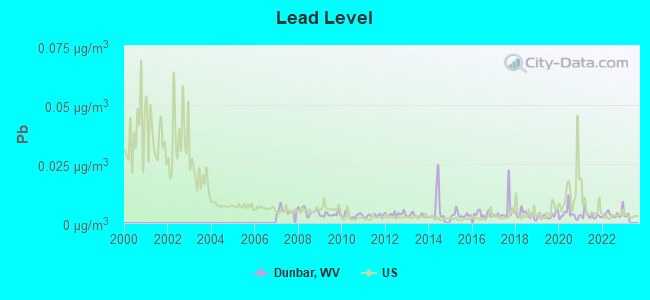
Lead (Pb) [µg/m3] level in 2022 was 0.00387. This is significantly better than average. Closest monitor was 1.8 miles away from the city center.
| City: | 0.00387 |
| U.S.: | 0.00931 |
Tornado activity:
Dunbar-area historical tornado activity is slightly below West Virginia state average. It is 75% smaller than the overall U.S. average.
On 4/23/1968, a category F5 (max. wind speeds 261-318 mph) tornado 40.2 miles away from the Dunbar city center killed 7 people and injured 93 people and caused between $500,000 and $5,000,000 in damages.
On 4/8/1965, a category F3 (max. wind speeds 158-206 mph) tornado 42.4 miles away from the city center injured 3 people and caused between $50,000 and $500,000 in damages.
Earthquake activity:
Dunbar-area historical earthquake activity is significantly above West Virginia state average. It is 6% smaller than the overall U.S. average.On 8/23/2011 at 17:51:04, a magnitude 5.8 (5.8 MW, Depth: 3.7 mi, Class: Moderate, Intensity: VI - VII) earthquake occurred 209.3 miles away from Dunbar center
On 7/27/1980 at 18:52:21, a magnitude 5.2 (5.1 MB, 4.7 MS, 5.0 UK, 5.2 UK) earthquake occurred 120.1 miles away from the city center
On 8/9/2020 at 12:07:37, a magnitude 5.1 (5.1 MW, Depth: 4.7 mi) earthquake occurred 135.4 miles away from the city center
On 9/25/1998 at 19:52:52, a magnitude 5.2 (4.8 MB, 4.3 MS, 5.2 LG, 4.5 MW, Depth: 3.1 mi) earthquake occurred 227.7 miles away from Dunbar center
On 9/7/1988 at 02:28:09, a magnitude 4.6 (4.5 MB, 4.6 LG, Class: Light, Intensity: IV - V) earthquake occurred 117.2 miles away from the city center
On 11/2/2006 at 17:53:02, a magnitude 4.3 (4.3 MB, Depth: 0.6 mi) earthquake occurred 81.1 miles away from Dunbar center
Magnitude types: regional Lg-wave magnitude (LG), body-wave magnitude (MB), surface-wave magnitude (MS), moment magnitude (MW)
Natural disasters:
The number of natural disasters in Kanawha County (28) is a lot greater than the US average (15).Major Disasters (Presidential) Declared: 22
Emergencies Declared: 5
Causes of natural disasters: Floods: 15, Storms: 14, Landslides: 8, Winter Storms: 5, Hurricanes: 3, Mudslides: 3, Blizzard: 1, Fire: 1, Heavy Rain: 1, Snowfall: 1, Snowstorm: 1, Tornado: 1, Wind: 1, Other: 2 (Note: some incidents may be assigned to more than one category).
Hospitals and medical centers in Dunbar:
Amtrak station near Dunbar:
College/University in Dunbar:
Colleges/universities with over 2000 students nearest to Dunbar:
- West Virginia State University (about 2 miles; Institute, WV; Full-time enrollment: 2,133)
- Marshall University (about 38 miles; Huntington, WV; FT enrollment: 11,450)
- New River Community and Technical College (about 49 miles; Beckley, WV; FT enrollment: 2,234)
- Ashland Community and Technical College (about 50 miles; Ashland, KY; FT enrollment: 2,482)
- West Virginia University at Parkersburg (about 61 miles; Parkersburg, WV; FT enrollment: 2,619)
- Ohio University-Main Campus (about 70 miles; Athens, OH; FT enrollment: 26,181)
- Shawnee State University (about 73 miles; Portsmouth, OH; FT enrollment: 4,160)
Public high schools in Dunbar:
Public elementary/middle schools in Dunbar:
- DUNBAR PRIMARY CENTER (Students: 565, Location: 2401 MYERS AVENUE, Grades: PK-2)
- DUNBAR MIDDLE SCHOOL (Students: 437, Location: 325 27TH STREET, Grades: 6-8)
- DUNBAR INTERMEDIATE CENTER (Students: 318, Location: 1330 MYERS AVENUE, Grades: PK-5)
User-submitted facts and corrections:
- West Virginia State University is only about 2 - 4 miles from anywhere in Dunbar. added by Scott
- The South Central Juvenile Detention Center is now the James H. "Tiger" Morton Juvenile Detention Center. The address has also changed to 60 Manfred Holland Way, Dunbar, WV
Points of interest:
Notable locations in Dunbar: Dunbar Fire Department Station 1 (A), Kanawha County Emergency Ambulance Authority Station 259 (B), Dunbar Fire Department Station 2 (C), Dunbar City Hall (D). Display/hide their locations on the map
Shopping Center: Dunbar Village Shopping Center (1). Display/hide its location on the map
Churches in Dunbar include: First Baptist Church of Dunbar (A), Fairlawn Baptist Church (B), Dunbar First Church of God (C), Dunbar Church of the Nazarene (D), Dunbar Church of Christ (E). Display/hide their locations on the map
Cemeteries: Grandview Memorial Cemetery (1), Thurston Cemetery (2). Display/hide their locations on the map
Reservoir: Cunningham Fly Ash Pond (A). Display/hide its location on the map
Creeks: Aarons Creek (A), Tyler Creek (B). Display/hide their locations on the map
Park in Dunbar: Dunbar Park (1). Display/hide its location on the map
Hotels: Super 8 Motel (911 Dunbar Avenue), Dunbar/Charleston Super 8 Motel (911 Dunbar Ave), Super 8 Dunbar Charleston Area (911 Dunbar Avenue), Jefferson Motel (6204 Maccorkle Av Sw).
Birthplace of: Blind Joe Hill - Blues singer.
| This city: | 2.0 people |
| West Virginia: | 2.4 people |
| This city: | 52.7% |
| Whole state: | 65.8% |
| This city: | 7.4% |
| Whole state: | 6.6% |
Likely homosexual households (counted as self-reported same-sex unmarried-partner households)
- Lesbian couples: 0.5% of all households
- Gay men: 0.3% of all households
4 people in group homes intended for adults in 2010
People in group quarters in Dunbar in 2000:
- 200 people in college dormitories (includes college quarters off campus)
- 106 people in nursing homes
- 76 people in other noninstitutional group quarters
- 7 people in homes for the mentally retarded
Banks with branches in Dunbar (2011 data):
- Wesbanco Bank, Inc.: Dunbar Branch at 11th Street And Myers Avenue, branch established on 1973/06/25. Info updated 2009/04/02: Bank assets: $5,520.2 mil, Deposits: $4,394.5 mil, headquarters in Wheeling, WV, positive income, Commercial Lending Specialization, 115 total offices, Holding Company: Wesbanco, Inc.
- United Bank: Dunbar Branch at 1200 Grosscup Ave., branch established on 1917/02/03. Info updated 2007/09/20: Bank assets: $3,625.4 mil, Deposits: $3,023.8 mil, headquarters in Parkersburg, WV, positive income, Commercial Lending Specialization, 56 total offices, Holding Company: United Bankshares, Inc.
- City National Bank of West Virginia: Dunbar Branch at 304 Tenth Street, branch established on 1997/09/08. Info updated 2008/01/10: Bank assets: $2,753.2 mil, Deposits: $2,223.1 mil, headquarters in Charleston, WV, positive income, Commercial Lending Specialization, 68 total offices, Holding Company: City Holding Company
For population 15 years and over in Dunbar:
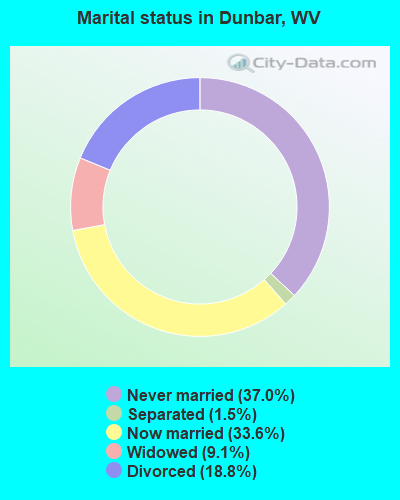
- Never married: 37.0%
- Now married: 33.6%
- Separated: 1.5%
- Widowed: 9.1%
- Divorced: 18.8%
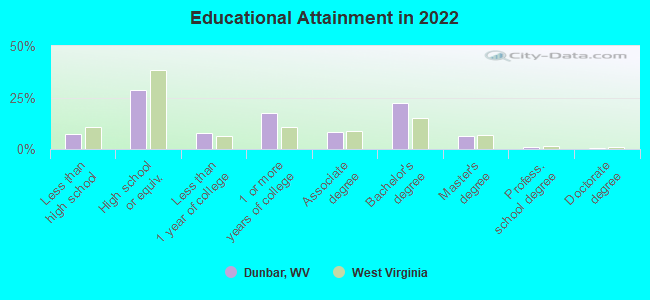
For population 25 years and over in Dunbar:
- High school or higher: 93.6%
- Bachelor's degree or higher: 28.7%
- Graduate or professional degree: 7.6%
- Unemployed: 5.9%
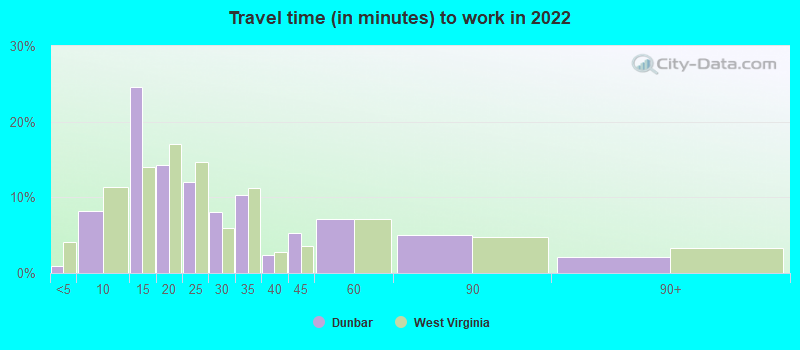
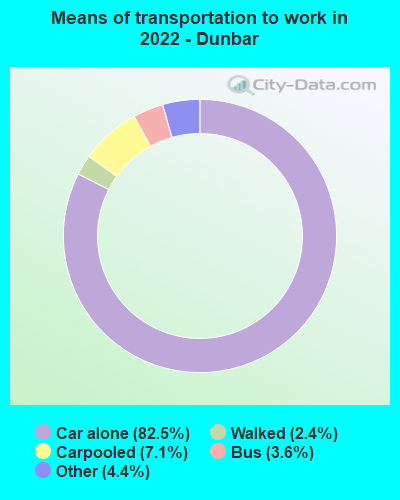
- Mean travel time to work (commute): 18.3 minutes
| Here: | 9.9 |
| West Virginia average: | 11.1 |
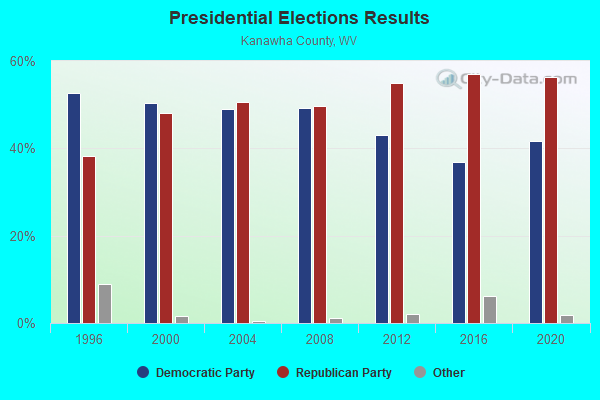
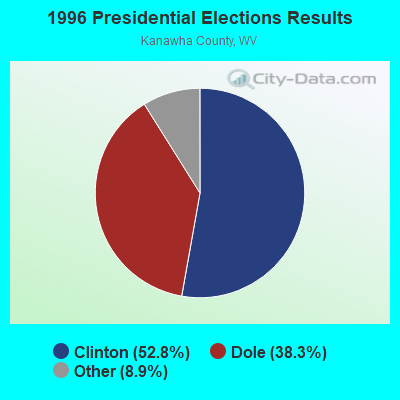
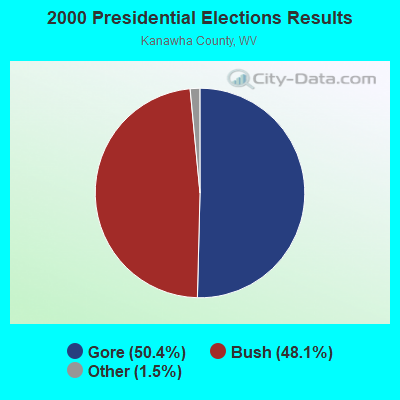
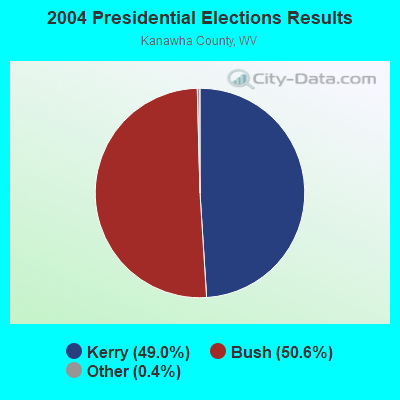
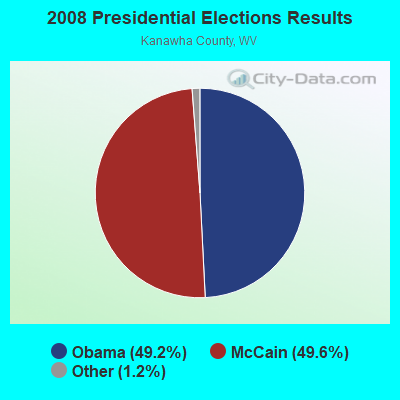
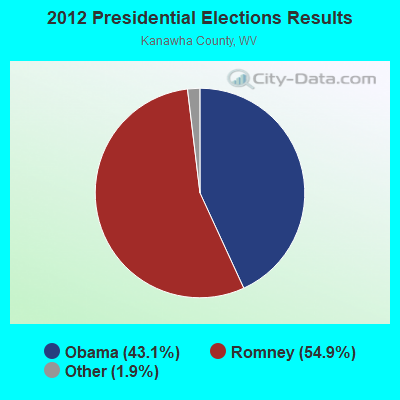
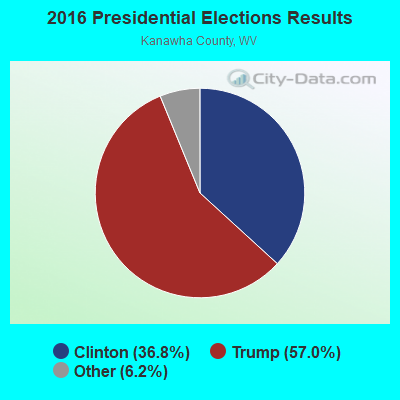
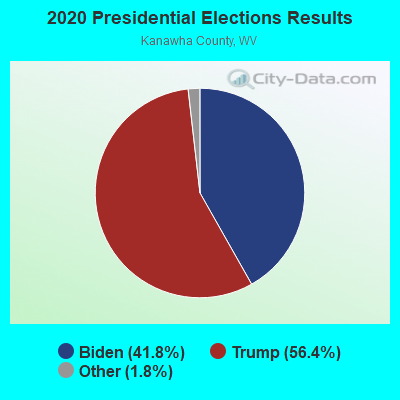
Graphs represent county-level data. Detailed 2008 Election Results
Religion statistics for Dunbar, WV (based on Kanawha County data)
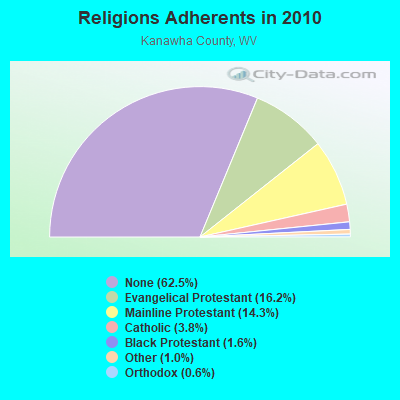
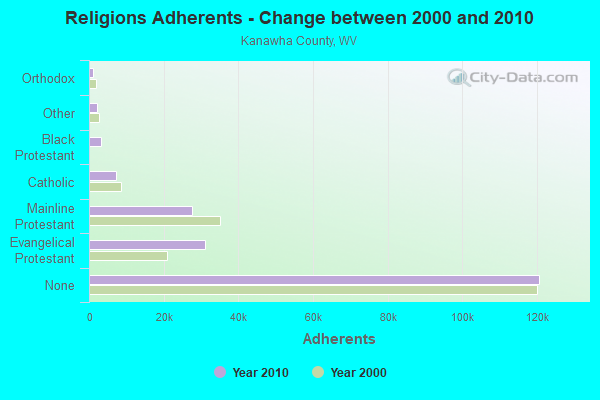
| Religion | Adherents | Congregations |
|---|---|---|
| Evangelical Protestant | 31,202 | 219 |
| Mainline Protestant | 27,583 | 114 |
| Catholic | 7,331 | 11 |
| Black Protestant | 3,114 | 12 |
| Other | 2,020 | 10 |
| Orthodox | 1,136 | 2 |
| None | 120,677 | - |
Food Environment Statistics:
| This county: | 2.46 / 10,000 pop. |
| West Virginia: | 2.41 / 10,000 pop. |
| This county: | 0.16 / 10,000 pop. |
| State: | 0.28 / 10,000 pop. |
| Kanawha County: | 0.52 / 10,000 pop. |
| West Virginia: | 1.09 / 10,000 pop. |
| This county: | 5.13 / 10,000 pop. |
| West Virginia: | 5.38 / 10,000 pop. |
| Kanawha County: | 6.90 / 10,000 pop. |
| State: | 6.22 / 10,000 pop. |
| This county: | 12.1% |
| West Virginia: | 12.2% |
| This county: | 29.6% |
| State: | 31.1% |
| Kanawha County: | 12.0% |
| State: | 13.1% |
Health and Nutrition:
| Here: | 55.3% |
| West Virginia: | 51.8% |
| This city: | 54.8% |
| West Virginia: | 49.7% |
| Dunbar: | 28.2 |
| West Virginia: | 28.6 |
| This city: | 17.9% |
| West Virginia: | 20.4% |
| This city: | 9.1% |
| West Virginia: | 9.7% |
| Dunbar: | 7.0 |
| West Virginia: | 6.9 |
| This city: | 33.9% |
| West Virginia: | 34.8% |
| Here: | 61.4% |
| West Virginia: | 58.4% |
| Dunbar: | 80.0% |
| State: | 78.6% |
More about Health and Nutrition of Dunbar, WV Residents
| Local government employment and payroll (March 2022) | |||||
| Function | Full-time employees | Monthly full-time payroll | Average yearly full-time wage | Part-time employees | Monthly part-time payroll |
|---|---|---|---|---|---|
| Police Protection - Officers | 16 | $41,837 | $31,378 | 0 | $0 |
| Sewerage | 14 | $40,699 | $34,885 | 3 | $1,400 |
| Firefighters | 13 | $41,294 | $38,118 | 0 | $0 |
| Solid Waste Management | 9 | $20,059 | $26,745 | 0 | $0 |
| Streets and Highways | 8 | $19,847 | $29,771 | 0 | $0 |
| Other Government Administration | 4 | $20,606 | $61,818 | 0 | $0 |
| Parks and Recreation | 3 | $8,658 | $34,632 | 5 | $3,833 |
| Police - Other | 1 | $2,887 | $34,644 | 2 | $1,464 |
| Financial Administration | 1 | $4,172 | $50,064 | 0 | $0 |
| Judicial and Legal | 0 | $0 | 2 | $2,597 | |
| Other and Unallocable | 0 | $0 | 9 | $15,677 | |
| Totals for Government | 69 | $200,059 | $34,793 | 21 | $24,971 |
Dunbar government finances - Expenditure in 2021 (per resident):
- Current Operations - Sewerage: $1,790,000 ($248.51)
Local Fire Protection: $1,736,000 ($241.01)
Police Protection: $1,072,000 ($148.83)
Regular Highways: $893,000 ($123.98)
Central Staff Services: $416,000 ($57.75)
Parks and Recreation: $412,000 ($57.20)
General - Other: $379,000 ($52.62)
Solid Waste Management: $373,000 ($51.78)
General Public Buildings: $143,000 ($19.85)
Judicial and Legal Services: $90,000 ($12.49)
Protective Inspection and Regulation - Other: $77,000 ($10.69)
Libraries: $67,000 ($9.30)
- Other Capital Outlay - General - Other: $120,000 ($16.66)
Police Protection: $84,000 ($11.66)
Protective Inspection and Regulation - Other: $1,000 ($0.14)
- Total Salaries and Wages: $3,450,000 ($478.97)
Dunbar government finances - Revenue in 2021 (per resident):
- Charges - Sewerage: $2,475,000 ($343.61)
Solid Waste Management: $1,176,000 ($163.27)
Other: $87,000 ($12.08)
Parking Facilities: $27,000 ($3.75)
Parks and Recreation: $15,000 ($2.08)
- Federal Intergovernmental - Other: $902,000 ($125.23)
- Local Intergovernmental - Other: $10,000 ($1.39)
- Miscellaneous - General Revenue - Other: $178,000 ($24.71)
Fines and Forfeits: $120,000 ($16.66)
Rents: $36,000 ($5.00)
Sale of Property: $14,000 ($1.94)
Interest Earnings: $7,000 ($0.97)
Donations From Private Sources: $5,000 ($0.69)
- State Intergovernmental - General Local Government Support: $36,000 ($5.00)
Other: $12,000 ($1.67)
- Tax - Occupation and Business License - Other: $1,783,000 ($247.54)
Property: $1,496,000 ($207.69)
General Sales and Gross Receipts: $962,000 ($133.56)
Public Utilities Sales: $423,000 ($58.73)
Other License: $131,000 ($18.19)
Alcoholic Beverage Sales: $115,000 ($15.97)
Other Selective Sales: $44,000 ($6.11)
Dunbar government finances - Debt in 2021 (per resident):
- Long Term Debt - Beginning Outstanding - Unspecified Public Purpose: $42,000 ($5.83)
Outstanding Unspecified Public Purpose: $30,000 ($4.16)
Retired Unspecified Public Purpose: $12,000 ($1.67)
Dunbar government finances - Cash and Securities in 2021 (per resident):
- Other Funds - Cash and Securities: $3,065,000 ($425.52)
| Businesses in Dunbar, WV | ||||
| Name | Count | Name | Count | |
|---|---|---|---|---|
| Advance Auto Parts | 1 | Rite Aid | 1 | |
| CVS | 1 | Ryder Rental & Truck Leasing | 1 | |
| Curves | 1 | Subway | 1 | |
| H&R Block | 1 | Super 8 | 1 | |
| Kroger | 1 | Travelodge | 1 | |
| MasterBrand Cabinets | 2 | UPS | 1 | |
| McDonald's | 1 | Wendy's | 1 | |
Strongest AM radio stations in Dunbar:
- WCHS (580 AM; 5 kW; CHARLESTON, WV; Owner: WEST VIRGINIA RADIO CORPORATION OF CHARLESTON)
- WVTS (950 AM; 5 kW; CHARLESTON, WV; Owner: BRISTOL BROADCASTING COMPANY, INC.)
- WSCW (1410 AM; daytime; 5 kW; SOUTH CHARLESTON, WV; Owner: L.M. COMMUNICATIONS OF KENTUCKY, LLC)
- WBES (1240 AM; 1 kW; CHARLESTON, WV; Owner: BRISTOL BROADCASTING COMPANY, INC.)
- WCAW (680 AM; 10 kW; CHARLESTON, WV; Owner: WEST VIRGINIA RADIO CORPORATION OF CHARLESTON)
- WJYP (1300 AM; 1 kW; ST. ALBANS, WV)
- WSWW (1490 AM; 1 kW; CHARLESTON, WV; Owner: WEST VIRGINIA RADIO CORPORATION OF CHARLESTON)
- WZZW (1600 AM; 5 kW; MILTON, WV; Owner: CAPSTAR TX LIMITED PARTNERSHIP)
- WBGS (1030 AM; daytime; 10 kW; POINT PLEASANT, WV; Owner: BIG RIVER RADIO, INC.)
- WTVN (610 AM; 50 kW; COLUMBUS, OH; Owner: CITICASTERS LICENSES, L.P.)
- WOAY (860 AM; 10 kW; OAK HILL, WV; Owner: COMMISSIONED COMMUNICATIONS, INC.)
- WVHU (800 AM; 5 kW; HUNTINGTON, WV; Owner: CAPSTAR TX LIMITED PARTNERSHIP)
- WIWS (1070 AM; daytime; 10 kW; BECKLEY, WV; Owner: SOUTHERN COMMUNICATIONS CORPORATION)
Strongest FM radio stations in Dunbar:
- WQBE-FM (97.5 FM; CHARLESTON, WV; Owner: BRISTOL BROADCASTING COMPANY)
- WJYP-FM (100.9 FM; SOUTH CHARLESTON, WV; Owner: L.M. COMMUNICATIONS OF KENTUCKY, LLC)
- WZJO (94.5 FM; DUNBAR, WV; Owner: BRISTOL BROADCASTING COMPANY, INC)
- WKLC-FM (105.1 FM; ST. ALBANS, WV; Owner: WKLC, INC.)
- WVSR-FM (102.7 FM; CHARLESTON, WV; Owner: BRISTOL BROADCASTING COMPANY, INC.)
- WKWS (96.1 FM; CHARLESTON, WV; Owner: WEST VIRGINIA RADIO CORPORATION OF CHARLESTON)
- WVAF (99.9 FM; CHARLESTON, WV; Owner: WEST VIRGINIA RADIO CORPORATION OF CHARLESTON)
- WRVZ (98.7 FM; POCATALICO, WV; Owner: WEST VIRGINIA RADIO CORPORATION OF CHARLESTON)
- WKAZ (107.3 FM; MIAMI, WV; Owner: WEST VIRGINIA RADIO CORPORATION OF CHARLESTON)
- WXAF (90.9 FM; CHARLESTON, WV; Owner: MARANATHA BROADCASTING, INC.)
- WVWV (89.9 FM; HUNTINGTON, WV; Owner: WEST VIRGINIA EDUCATIONAL BROADCASTING AUTHORITY)
- WVPN (88.5 FM; CHARLESTON, WV; Owner: WEST VIRGINIA EDUCATIONAL BROADCASTING AUTHORITY)
- WAMX (106.3 FM; MILTON, WV; Owner: CAPSTAR TX LIMITED PARTNERSHIP)
- WKVW (93.3 FM; MONTGOMERY, WV; Owner: EDUCATIONAL MEDIA FOUNDATION)
- WZAC-FM (92.5 FM; DANVILLE, WV; Owner: PRICE BROADCASTING COMPANY)
- W208AK (89.5 FM; CHARLESTON, WV; Owner: LOWER OHIO VALLEY EDUCATIONAL CORP.)
- WCIR-FM (103.7 FM; BECKLEY, WV; Owner: SOUTHERN COMMUNICATIONS CORPORATION)
- WDBS (97.1 FM; SUTTON, WV; Owner: SUMMIT MEDIA BROADCASTING, L.L.C.)
- WVOW-FM (101.9 FM; LOGAN, WV; Owner: LOGAN BROADCASTING CORP.)
- WEMM (107.9 FM; HUNTINGTON, WV; Owner: MORTENSON BROADCASTING CO. OF WEST VIRGINIA, LLC)
TV broadcast stations around Dunbar:
- WVAH-TV (Channel 11; CHARLESTON, WV; Owner: WVAH LICENSEE, LLC)
- WCHS-TV (Channel 8; CHARLESTON, WV; Owner: WCHS LICENSEE, LLC)
- WLPX-TV (Channel 29; CHARLESTON, WV; Owner: PAXSON CHARLESTON LICENSE, INC.)
- W31CA (Channel 31; CHARLESTON, WV; Owner: NATIONAL MINORITY T.V., INC.)
- W16CE (Channel 16; CHARLESTON, WV; Owner: EMMIS TELEVISION LICENSE CORPORATION)
- WPBY-TV (Channel 33; HUNTINGTON, WV; Owner: WEST VIRGINIA EDUCATIONAL BROADCASTING AUTHORITY)
- WSAZ-TV (Channel 3; HUNTINGTON, WV; Owner: EMMIS TELEVISION LICENSE CORPORATION)
- WOWK-TV (Channel 13; HUNTINGTON, WV; Owner: WEST VIRGINIA MEDIA HOLDINGS, LLC)
- WOWB-LP (Channel 53; CHARLESTON, WV; Owner: COMMONWEALTH BROADCASTING GROUP, INC.)
- W36CR (Channel 36; HUNTINGTON, WV; Owner: NATIONAL MINORITY T.V., INC.)
- National Bridge Inventory (NBI) Statistics
- 11Number of bridges
- 354ft / 108mTotal length
- $625,000Total costs
- 335,455Total average daily traffic
- 63,718Total average daily truck traffic
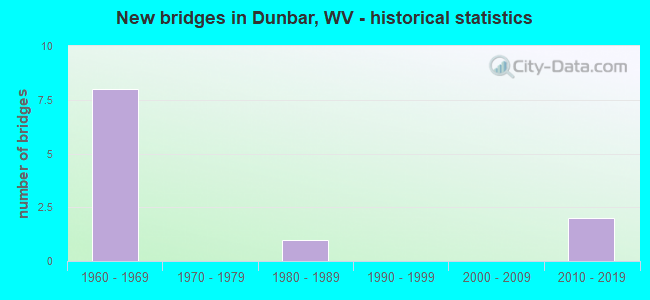
- New bridges - historical statistics
- 81960-1969
- 11980-1989
- 22010-2019
FCC Registered Antenna Towers:
19 (See the full list of FCC Registered Antenna Towers in Dunbar)FCC Registered Broadcast Land Mobile Towers:
6- City Building Int Of 13th St & 12th Ave (Lat: 38.367306 Lon: -81.750694), Call Sign: WYG250,
Assigned Frequencies: 155.145 MHz, 155.745 MHz, Grant Date: 09/12/2023, Expiration Date: 11/14/2033, Registrant: Metro 911 Kanawha County Emergency Operations Center, 200 Peyton Way, Charleston, WV 25309-8627, Phone: (304) 746-7911, Fax: (304) 746-7914, Email:
- Jct Of Dutch Hollow Rd & State Route 25 (Lat: 38.370917 Lon: -81.746806), Type: Pole, Structure height: 5 m, Overall height: 6 m, Call Sign: WPQI670,
Assigned Frequencies: 453.862 MHz, Grant Date: 06/18/2015, Expiration Date: 07/28/2025, Certifier: C B Rigney, Registrant: Cara Enterprises, Inc, Las Vegas, NV 89140-0124, Phone: (702) 838-9728, Fax: (702) 363-4607, Email:
- On Dunbar Ave 2 Km South Of Jct State Route 25 & State Route 62 (Lat: 38.363139 Lon: -81.720694), Type: Pole, Structure height: 5 m, Overall height: 6 m, Call Sign: WPQI671,
Assigned Frequencies: 453.862 MHz, Grant Date: 06/18/2015, Expiration Date: 07/28/2025, Certifier: C B Rigney, Registrant: Cara Enterprises, Inc, Las Vegas, NV 89140-0124, Phone: (702) 838-9728, Fax: (702) 363-4607, Email:
- Lat: 38.358333 Lon: -81.739444, Call Sign: WPCH357,
Assigned Frequencies: 464.037 MHz, 464.062 MHz, 464.087 MHz, 464.112 MHz, 464.137 MHz, 464.162 MHz, 464.187 MHz, 464.212 MHz, 464.237 MHz, 464.262 MHz... (+19 more), Grant Date: 03/13/2013, Expiration Date: 05/20/2023, Cancellation Date: 07/22/2023, Certifier: Michael T Folks, Registrant: Business Radio Licensing, 30251 Golden Lantern, Suite E # 501, Laguna Niguel, CA 92677, Phone: (949) 348-8510, Fax: (949) 348-8514, Email:
- WILLOW DR LFT STN, On Jordon St 215 Ft S Of Jordon St/Wv Rt 25 Intersection (Lat: 38.374250 Lon: -81.753333), Type: Pole, Structure height: 4 m, Overall height: 4.5 m, Call Sign: WRFV919,
Assigned Frequencies: 151.745 MHz, Grant Date: 05/13/2020, Expiration Date: 05/13/2030, Certifier: Ron Burnside, Registrant: Cara Enterprises, Inc., Las Vegas, NV 89140-0124, Phone: (702) 838-9728, Fax: (702) 363-4607, Email:
- REHAB LFT STN, On 4th Ave 0.23 Miles W Of 4th Ave/Wv Rt 25 Intersection (Lat: 38.381472 Lon: -81.768889), Type: Pole, Structure height: 4 m, Overall height: 4.5 m, Call Sign: WRFV920,
Assigned Frequencies: 151.745 MHz, Grant Date: 05/13/2020, Expiration Date: 05/13/2030, Certifier: Ron Burnside, Registrant: Cara Enterprises, Inc., Las Vegas, NV 89140-0124, Phone: (702) 838-9728, Fax: (702) 363-4607, Email:
FCC Registered Microwave Towers:
1- 68200, Spring Hill Mountain (Lat: 38.340083 Lon: -81.741056), Type: Ltower, Structure height: 46.6 m, Overall height: 48.8 m, Call Sign: WQYY368,
Assigned Frequencies: 5960.02 MHz, 5960.02 MHz, 5960.02 MHz, 5960.02 MHz, 5960.02 MHz, 5960.02 MHz, 5960.02 MHz, 5960.02 MHz, 5960.02 MHz, Grant Date: 02/28/2017, Expiration Date: 02/28/2027, Certifier: Steve Sharkey, Registrant: T-Mobile Usa, Inc., 12920 Se 38th Street, Bellevue, WA 98006, Phone: (425) 383-8401, Email:
FCC Registered Paging Towers:
1- 12 Marvin Country Estates (Lat: 38.341750 Lon: -81.735944), Call Sign: WRV945,
Assigned Frequencies: 158.700 MHz, Grant Date: 04/23/2019, Expiration Date: 04/01/2029, Certifier: J. Roy Pottle, Registrant: Wilkinson Barker Knauer, LLP, 1800 M Street, N.W., Suite 800n, Washington, DC 20036, Phone: (202) 783-4141, Fax: (202) 783-5851, Email:
FCC Registered Amateur Radio Licenses:
66 (See the full list of FCC Registered Amateur Radio Licenses in Dunbar)FAA Registered Aircraft:
1- Aircraft: PIPER PA-28-180 (Category: Land, Seats: 4, Weight: Up to 12,499 Pounds, Speed: 107 mph), Engine: LYCOMING O&VO-360 SER (180 HP) (Reciprocating)
N-Number: 55340, N55340, N-55340, Serial Number: 28-7305363, Year manufactured: 1973, Airworthiness Date: 03/27/1973, Certificate Issue Date: 08/14/2002
Registrant (Individual): Gregg A Brewer, 156 Taylor Rd, Dunbar, WV 25064
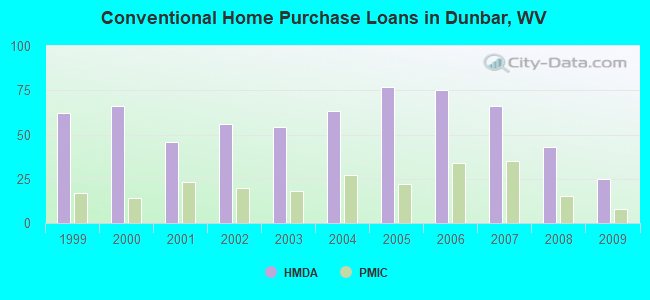
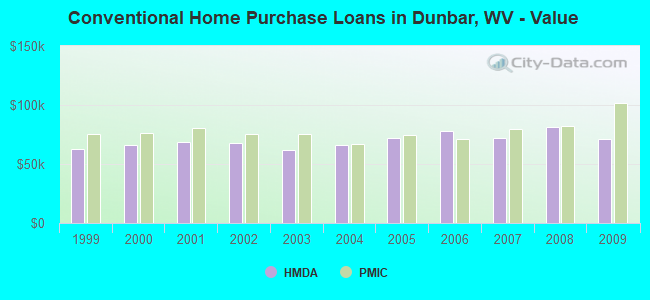
| Home Mortgage Disclosure Act Aggregated Statistics For Year 2009 (Based on 1 full and 2 partial tracts) | ||||||||||||
| A) FHA, FSA/RHS & VA Home Purchase Loans | B) Conventional Home Purchase Loans | C) Refinancings | D) Home Improvement Loans | F) Non-occupant Loans on < 5 Family Dwellings (A B C & D) | G) Loans On Manufactured Home Dwelling (A B C & D) | |||||||
|---|---|---|---|---|---|---|---|---|---|---|---|---|
| Number | Average Value | Number | Average Value | Number | Average Value | Number | Average Value | Number | Average Value | Number | Average Value | |
| LOANS ORIGINATED | 29 | $83,508 | 25 | $70,786 | 56 | $79,432 | 10 | $50,829 | 13 | $63,524 | 0 | $0 |
| APPLICATIONS APPROVED, NOT ACCEPTED | 1 | $53,750 | 1 | $67,310 | 2 | $82,140 | 3 | $47,247 | 0 | $0 | 0 | $0 |
| APPLICATIONS DENIED | 6 | $75,237 | 8 | $109,576 | 30 | $99,038 | 11 | $35,445 | 1 | $86,720 | 1 | $68,880 |
| APPLICATIONS WITHDRAWN | 2 | $92,060 | 5 | $60,994 | 20 | $93,148 | 3 | $73,780 | 1 | $57,000 | 1 | $33,400 |
| FILES CLOSED FOR INCOMPLETENESS | 0 | $0 | 1 | $90,120 | 2 | $103,855 | 0 | $0 | 0 | $0 | 0 | $0 |
Detailed HMDA statistics for the following Tracts: 0101.00 , 0102.00, 0103.00
| Private Mortgage Insurance Companies Aggregated Statistics For Year 2009 (Based on 1 full and 2 partial tracts) | ||||
| A) Conventional Home Purchase Loans | B) Refinancings | |||
|---|---|---|---|---|
| Number | Average Value | Number | Average Value | |
| LOANS ORIGINATED | 8 | $101,481 | 1 | $59,810 |
| APPLICATIONS APPROVED, NOT ACCEPTED | 3 | $99,210 | 0 | $0 |
| APPLICATIONS DENIED | 0 | $0 | 1 | $41,740 |
| APPLICATIONS WITHDRAWN | 1 | $104,000 | 0 | $0 |
| FILES CLOSED FOR INCOMPLETENESS | 0 | $0 | 0 | $0 |
Detailed PMIC statistics for the following Tracts: 0101.00 , 0102.00, 0103.00
2004 - 2018 National Fire Incident Reporting System (NFIRS) incidents
- Fire incident types reported to NFIRS in Dunbar, WV
- 25754.7%Structure Fires
- 11624.7%Outside Fires
- 8918.9%Mobile Property/Vehicle Fires
- 81.7%Other
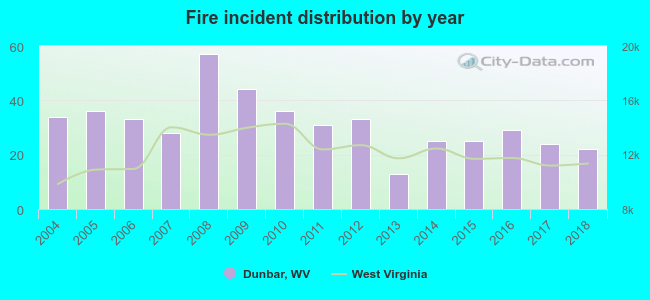 Based on the data from the years 2004 - 2018 the average number of fires per year is 31. The highest number of fires - 57 took place in 2008, and the least - 13 in 2013. The data has a dropping trend.
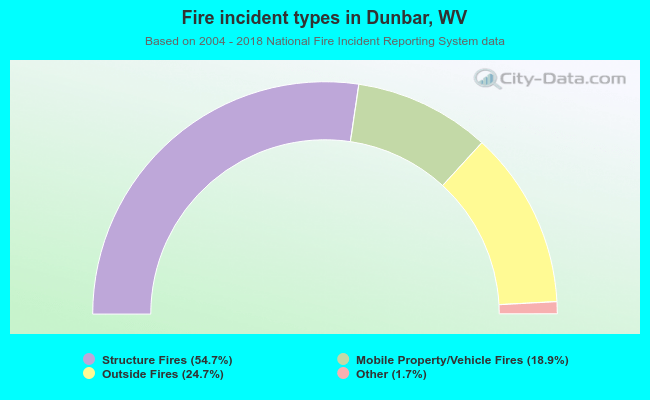 When looking into fire subcategories, the most reports belonged to: Structure Fires (54.7%), and Outside Fires (24.7%).
Fire-safe hotels and motels in Dunbar, West Virginia:
- Super 8 Motel Dunbar/Charleston, 911 Dunbar Ave, Dunbar, West Virginia 25064 , Phone: (304) 768-6888, Fax: (304) 768-6888
- Travelodge, 1007 Dunbar Ave, Dunbar, West Virginia 25064 , Phone: (304) 768-1000, Fax: (304) 768-2705
| Most common first names in Dunbar, WV among deceased individuals | ||
| Name | Count | Lived (average) |
|---|---|---|
| William | 118 | 75.4 years |
| James | 97 | 71.1 years |
| Mary | 97 | 78.2 years |
| John | 79 | 74.5 years |
| Robert | 61 | 70.8 years |
| Charles | 57 | 75.3 years |
| George | 47 | 73.5 years |
| Margaret | 41 | 79.2 years |
| Ruby | 30 | 80.2 years |
| Helen | 30 | 76.2 years |
| Most common last names in Dunbar, WV among deceased individuals | ||
| Last name | Count | Lived (average) |
|---|---|---|
| Smith | 80 | 77.3 years |
| Jones | 43 | 73.4 years |
| Casto | 38 | 76.1 years |
| Miller | 38 | 74.4 years |
| Williams | 36 | 75.0 years |
| Fisher | 34 | 78.4 years |
| Taylor | 32 | 79.1 years |
| Johnson | 27 | 73.2 years |
| Parsons | 26 | 80.6 years |
| Young | 25 | 77.5 years |
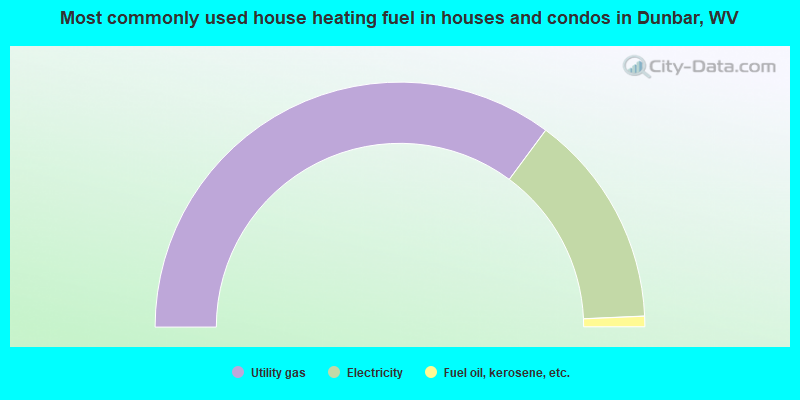
- 70.3%Utility gas
- 28.3%Electricity
- 1.4%Fuel oil, kerosene, etc.
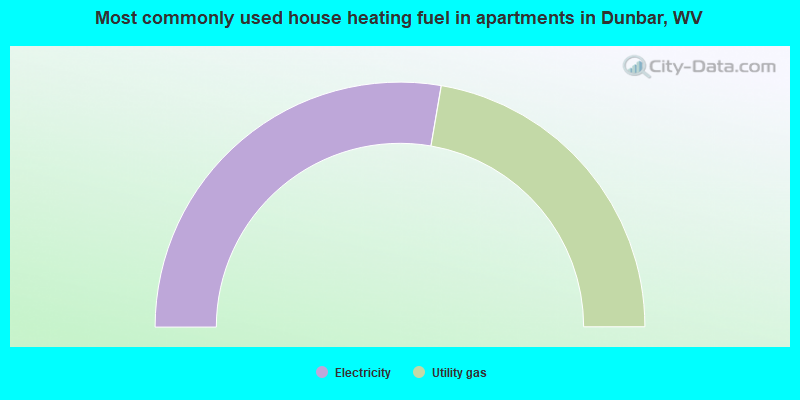
- 55.4%Electricity
- 44.6%Utility gas
Dunbar compared to West Virginia state average:
- Unemployed percentage below state average.
- Black race population percentage significantly above state average.
- Foreign-born population percentage significantly below state average.
- Renting percentage above state average.
- Length of stay since moving in above state average.
- Percentage of population with a bachelor's degree or higher above state average.

|
|
Total of 14 patent applications in 2008-2024.