Graham, Washington Submit your own pictures of this place and show them to the world
OSM Map
General Map
Google Map
MSN Map
OSM Map
General Map
Google Map
MSN Map
OSM Map
General Map
Google Map
MSN Map
OSM Map
General Map
Google Map
MSN Map
Please wait while loading the map...
Population in 2010: 23,491. Population change since 2000: +168.8%Males: 12,413 Females: 11,078
March 2022 cost of living index in Graham: 109.4 (more than average, U.S. average is 100) Percentage of residents living in poverty in 2022: 5.8%for White Non-Hispanic residents , 2.2% for Black residents , 2.0% for Hispanic or Latino residents , 0.9% for American Indian residents , 1.7% for other race residents , 4.4% for two or more races residents )
Profiles of local businesses
Business Search - 14 Million verified businesses
Data:
Median household income ($)
Median household income (% change since 2000)
Household income diversity
Ratio of average income to average house value (%)
Ratio of average income to average rent
Median household income ($) - White
Median household income ($) - Black or African American
Median household income ($) - Asian
Median household income ($) - Hispanic or Latino
Median household income ($) - American Indian and Alaska Native
Median household income ($) - Multirace
Median household income ($) - Other Race
Median household income for houses/condos with a mortgage ($)
Median household income for apartments without a mortgage ($)
Races - White alone (%)
Races - White alone (% change since 2000)
Races - Black alone (%)
Races - Black alone (% change since 2000)
Races - American Indian alone (%)
Races - American Indian alone (% change since 2000)
Races - Asian alone (%)
Races - Asian alone (% change since 2000)
Races - Hispanic (%)
Races - Hispanic (% change since 2000)
Races - Native Hawaiian and Other Pacific Islander alone (%)
Races - Native Hawaiian and Other Pacific Islander alone (% change since 2000)
Races - Two or more races (%)
Races - Two or more races (% change since 2000)
Races - Other race alone (%)
Races - Other race alone (% change since 2000)
Racial diversity
Unemployment (%)
Unemployment (% change since 2000)
Unemployment (%) - White
Unemployment (%) - Black or African American
Unemployment (%) - Asian
Unemployment (%) - Hispanic or Latino
Unemployment (%) - American Indian and Alaska Native
Unemployment (%) - Multirace
Unemployment (%) - Other Race
Population density (people per square mile)
Population - Males (%)
Population - Females (%)
Population - Males (%) - White
Population - Males (%) - Black or African American
Population - Males (%) - Asian
Population - Males (%) - Hispanic or Latino
Population - Males (%) - American Indian and Alaska Native
Population - Males (%) - Multirace
Population - Males (%) - Other Race
Population - Females (%) - White
Population - Females (%) - Black or African American
Population - Females (%) - Asian
Population - Females (%) - Hispanic or Latino
Population - Females (%) - American Indian and Alaska Native
Population - Females (%) - Multirace
Population - Females (%) - Other Race
Coronavirus confirmed cases (Apr 23, 2024)
Deaths caused by coronavirus (Apr 23, 2024)
Coronavirus confirmed cases (per 100k population) (Apr 23, 2024)
Deaths caused by coronavirus (per 100k population) (Apr 23, 2024)
Daily increase in number of cases (Apr 23, 2024)
Weekly increase in number of cases (Apr 23, 2024)
Cases doubled (in days) (Apr 23, 2024)
Hospitalized patients (Apr 18, 2022)
Negative test results (Apr 18, 2022)
Total test results (Apr 18, 2022)
COVID Vaccine doses distributed (per 100k population) (Sep 19, 2023)
COVID Vaccine doses administered (per 100k population) (Sep 19, 2023)
COVID Vaccine doses distributed (Sep 19, 2023)
COVID Vaccine doses administered (Sep 19, 2023)
Likely homosexual households (%)
Likely homosexual households (% change since 2000)
Likely homosexual households - Lesbian couples (%)
Likely homosexual households - Lesbian couples (% change since 2000)
Likely homosexual households - Gay men (%)
Likely homosexual households - Gay men (% change since 2000)
Cost of living index
Median gross rent ($)
Median contract rent ($)
Median monthly housing costs ($)
Median house or condo value ($)
Median house or condo value ($ change since 2000)
Mean house or condo value by units in structure - 1, detached ($)
Mean house or condo value by units in structure - 1, attached ($)
Mean house or condo value by units in structure - 2 ($)
Mean house or condo value by units in structure by units in structure - 3 or 4 ($)
Mean house or condo value by units in structure - 5 or more ($)
Mean house or condo value by units in structure - Boat, RV, van, etc. ($)
Mean house or condo value by units in structure - Mobile home ($)
Median house or condo value ($) - White
Median house or condo value ($) - Black or African American
Median house or condo value ($) - Asian
Median house or condo value ($) - Hispanic or Latino
Median house or condo value ($) - American Indian and Alaska Native
Median house or condo value ($) - Multirace
Median house or condo value ($) - Other Race
Median resident age
Resident age diversity
Median resident age - Males
Median resident age - Females
Median resident age - White
Median resident age - Black or African American
Median resident age - Asian
Median resident age - Hispanic or Latino
Median resident age - American Indian and Alaska Native
Median resident age - Multirace
Median resident age - Other Race
Median resident age - Males - White
Median resident age - Males - Black or African American
Median resident age - Males - Asian
Median resident age - Males - Hispanic or Latino
Median resident age - Males - American Indian and Alaska Native
Median resident age - Males - Multirace
Median resident age - Males - Other Race
Median resident age - Females - White
Median resident age - Females - Black or African American
Median resident age - Females - Asian
Median resident age - Females - Hispanic or Latino
Median resident age - Females - American Indian and Alaska Native
Median resident age - Females - Multirace
Median resident age - Females - Other Race
Commute - mean travel time to work (minutes)
Travel time to work - Less than 5 minutes (%)
Travel time to work - Less than 5 minutes (% change since 2000)
Travel time to work - 5 to 9 minutes (%)
Travel time to work - 5 to 9 minutes (% change since 2000)
Travel time to work - 10 to 19 minutes (%)
Travel time to work - 10 to 19 minutes (% change since 2000)
Travel time to work - 20 to 29 minutes (%)
Travel time to work - 20 to 29 minutes (% change since 2000)
Travel time to work - 30 to 39 minutes (%)
Travel time to work - 30 to 39 minutes (% change since 2000)
Travel time to work - 40 to 59 minutes (%)
Travel time to work - 40 to 59 minutes (% change since 2000)
Travel time to work - 60 to 89 minutes (%)
Travel time to work - 60 to 89 minutes (% change since 2000)
Travel time to work - 90 or more minutes (%)
Travel time to work - 90 or more minutes (% change since 2000)
Marital status - Never married (%)
Marital status - Now married (%)
Marital status - Separated (%)
Marital status - Widowed (%)
Marital status - Divorced (%)
Median family income ($)
Median family income (% change since 2000)
Median non-family income ($)
Median non-family income (% change since 2000)
Median per capita income ($)
Median per capita income (% change since 2000)
Median family income ($) - White
Median family income ($) - Black or African American
Median family income ($) - Asian
Median family income ($) - Hispanic or Latino
Median family income ($) - American Indian and Alaska Native
Median family income ($) - Multirace
Median family income ($) - Other Race
Median year house/condo built
Median year apartment built
Year house built - Built 2005 or later (%)
Year house built - Built 2000 to 2004 (%)
Year house built - Built 1990 to 1999 (%)
Year house built - Built 1980 to 1989 (%)
Year house built - Built 1970 to 1979 (%)
Year house built - Built 1960 to 1969 (%)
Year house built - Built 1950 to 1959 (%)
Year house built - Built 1940 to 1949 (%)
Year house built - Built 1939 or earlier (%)
Average household size
Household density (households per square mile)
Average household size - White
Average household size - Black or African American
Average household size - Asian
Average household size - Hispanic or Latino
Average household size - American Indian and Alaska Native
Average household size - Multirace
Average household size - Other Race
Occupied housing units (%)
Vacant housing units (%)
Owner occupied housing units (%)
Renter occupied housing units (%)
Vacancy status - For rent (%)
Vacancy status - For sale only (%)
Vacancy status - Rented or sold, not occupied (%)
Vacancy status - For seasonal, recreational, or occasional use (%)
Vacancy status - For migrant workers (%)
Vacancy status - Other vacant (%)
Residents with income below the poverty level (%)
Residents with income below 50% of the poverty level (%)
Children below poverty level (%)
Poor families by family type - Married-couple family (%)
Poor families by family type - Male, no wife present (%)
Poor families by family type - Female, no husband present (%)
Poverty status for native-born residents (%)
Poverty status for foreign-born residents (%)
Poverty among high school graduates not in families (%)
Poverty among people who did not graduate high school not in families (%)
Residents with income below the poverty level (%) - White
Residents with income below the poverty level (%) - Black or African American
Residents with income below the poverty level (%) - Asian
Residents with income below the poverty level (%) - Hispanic or Latino
Residents with income below the poverty level (%) - American Indian and Alaska Native
Residents with income below the poverty level (%) - Multirace
Residents with income below the poverty level (%) - Other Race
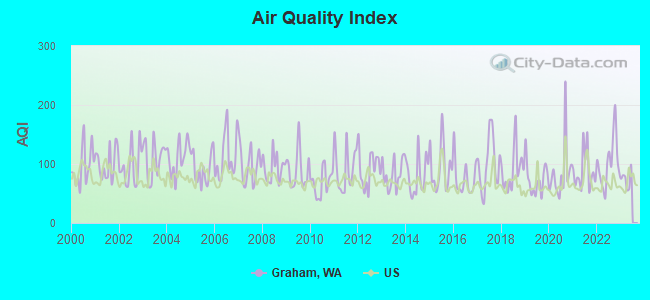
Air pollution - Air Quality Index (AQI)
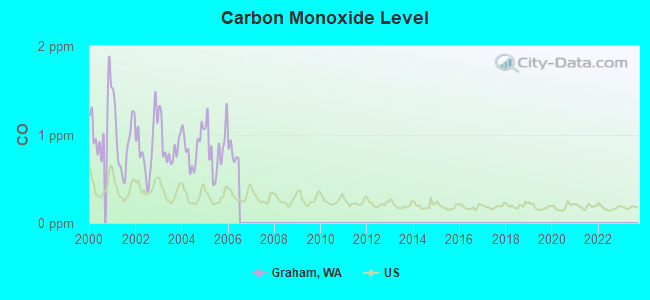
Air pollution - CO
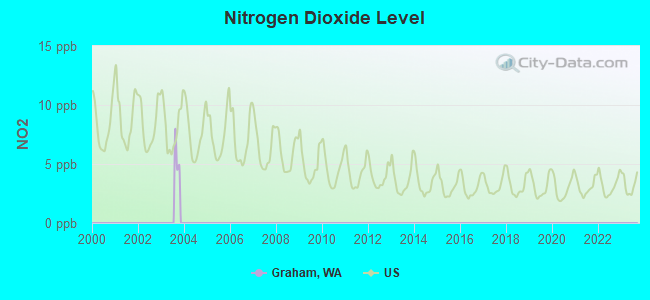
Air pollution - NO2
Air pollution - SO2
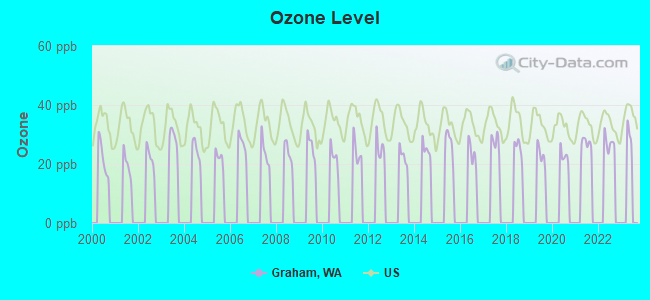
Air pollution - Ozone
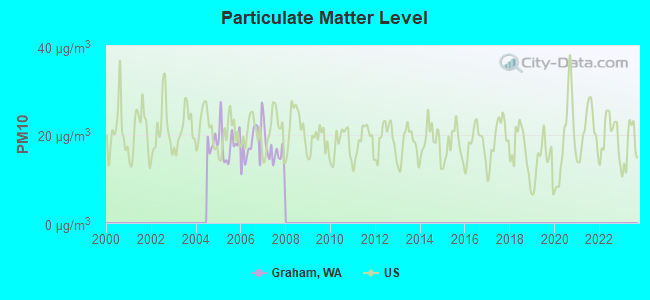
Air pollution - PM10
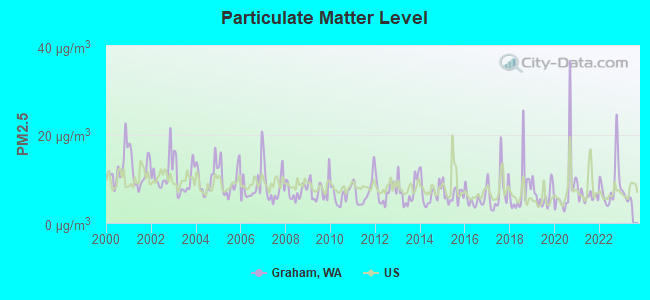
Air pollution - PM25
Air pollution - Pb
Crime - Murders per 100,000 population
Crime - Rapes per 100,000 population
Crime - Robberies per 100,000 population
Crime - Assaults per 100,000 population
Crime - Burglaries per 100,000 population
Crime - Thefts per 100,000 population
Crime - Auto thefts per 100,000 population
Crime - Arson per 100,000 population
Crime - City-data.com crime index
Crime - Violent crime index
Crime - Property crime index
Crime - Murders per 100,000 population (5 year average)
Crime - Rapes per 100,000 population (5 year average)
Crime - Robberies per 100,000 population (5 year average)
Crime - Assaults per 100,000 population (5 year average)
Crime - Burglaries per 100,000 population (5 year average)
Crime - Thefts per 100,000 population (5 year average)
Crime - Auto thefts per 100,000 population (5 year average)
Crime - Arson per 100,000 population (5 year average)
Crime - City-data.com crime index (5 year average)
Crime - Violent crime index (5 year average)
Crime - Property crime index (5 year average)
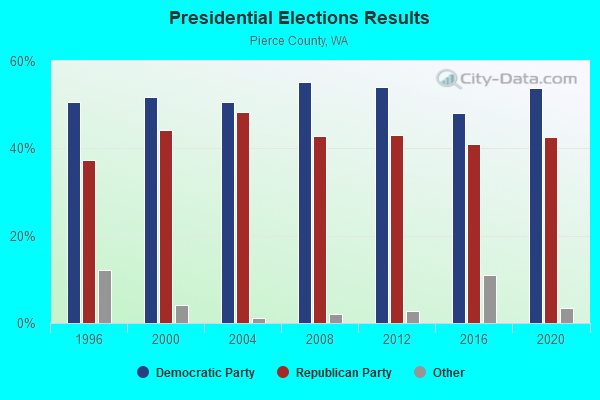
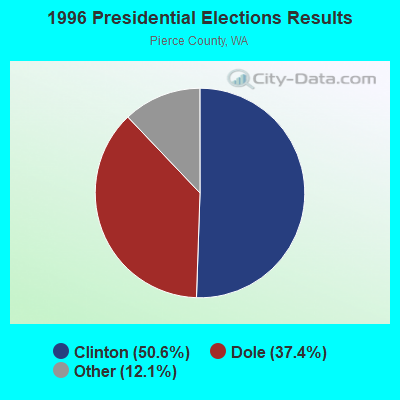
1996 Presidential Elections Results (%) - Democratic Party (Clinton)
1996 Presidential Elections Results (%) - Republican Party (Dole)
1996 Presidential Elections Results (%) - Other
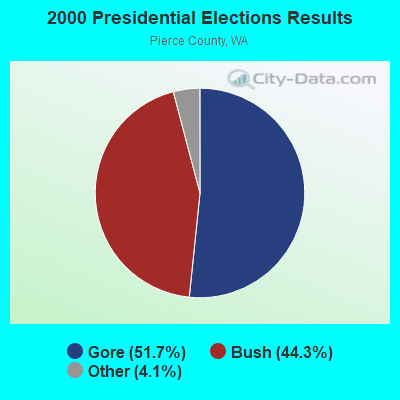
2000 Presidential Elections Results (%) - Democratic Party (Gore)
2000 Presidential Elections Results (%) - Republican Party (Bush)
2000 Presidential Elections Results (%) - Other
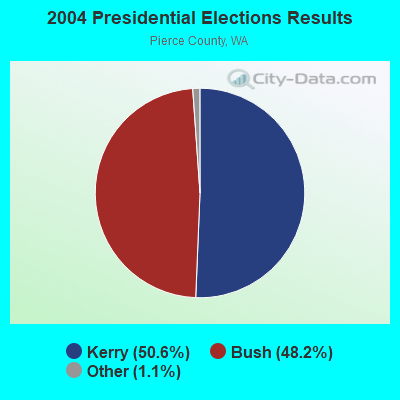
2004 Presidential Elections Results (%) - Democratic Party (Kerry)
2004 Presidential Elections Results (%) - Republican Party (Bush)
2004 Presidential Elections Results (%) - Other
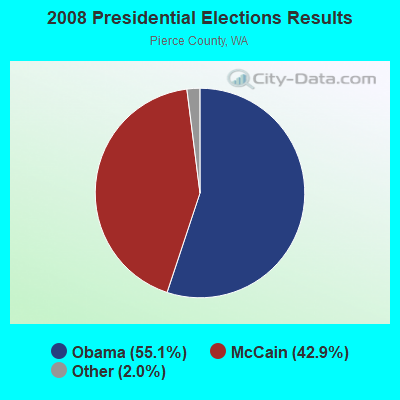
2008 Presidential Elections Results (%) - Democratic Party (Obama)
2008 Presidential Elections Results (%) - Republican Party (McCain)
2008 Presidential Elections Results (%) - Other
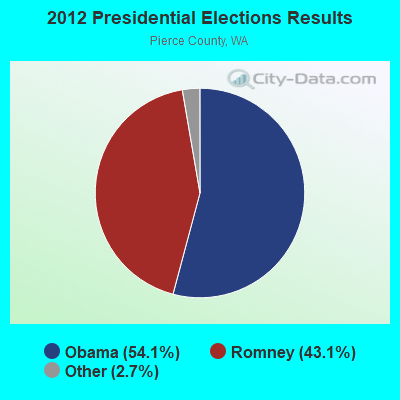
2012 Presidential Elections Results (%) - Democratic Party (Obama)
2012 Presidential Elections Results (%) - Republican Party (Romney)
2012 Presidential Elections Results (%) - Other
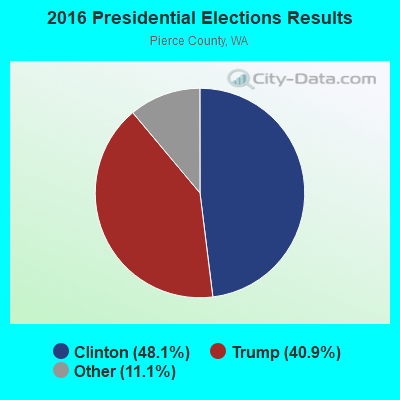
2016 Presidential Elections Results (%) - Democratic Party (Clinton)
2016 Presidential Elections Results (%) - Republican Party (Trump)
2016 Presidential Elections Results (%) - Other
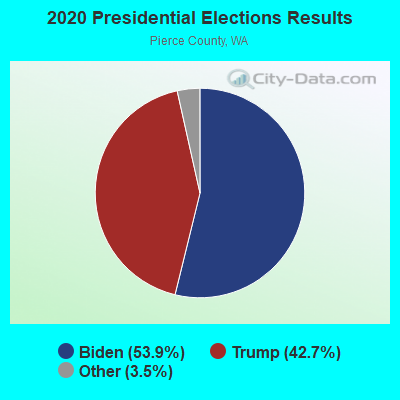
2020 Presidential Elections Results (%) - Democratic Party (Biden)
2020 Presidential Elections Results (%) - Republican Party (Trump)
2020 Presidential Elections Results (%) - Other
Ancestries Reported - Arab (%)
Ancestries Reported - Czech (%)
Ancestries Reported - Danish (%)
Ancestries Reported - Dutch (%)
Ancestries Reported - English (%)
Ancestries Reported - French (%)
Ancestries Reported - French Canadian (%)
Ancestries Reported - German (%)
Ancestries Reported - Greek (%)
Ancestries Reported - Hungarian (%)
Ancestries Reported - Irish (%)
Ancestries Reported - Italian (%)
Ancestries Reported - Lithuanian (%)
Ancestries Reported - Norwegian (%)
Ancestries Reported - Polish (%)
Ancestries Reported - Portuguese (%)
Ancestries Reported - Russian (%)
Ancestries Reported - Scotch-Irish (%)
Ancestries Reported - Scottish (%)
Ancestries Reported - Slovak (%)
Ancestries Reported - Subsaharan African (%)
Ancestries Reported - Swedish (%)
Ancestries Reported - Swiss (%)
Ancestries Reported - Ukrainian (%)
Ancestries Reported - United States (%)
Ancestries Reported - Welsh (%)
Ancestries Reported - West Indian (%)
Ancestries Reported - Other (%)
Educational Attainment - No schooling completed (%)
Educational Attainment - Less than high school (%)
Educational Attainment - High school or equivalent (%)
Educational Attainment - Less than 1 year of college (%)
Educational Attainment - 1 or more years of college (%)
Educational Attainment - Associate degree (%)
Educational Attainment - Bachelor's degree (%)
Educational Attainment - Master's degree (%)
Educational Attainment - Professional school degree (%)
Educational Attainment - Doctorate degree (%)
School Enrollment - Nursery, preschool (%)
School Enrollment - Kindergarten (%)
School Enrollment - Grade 1 to 4 (%)
School Enrollment - Grade 5 to 8 (%)
School Enrollment - Grade 9 to 12 (%)
School Enrollment - College undergrad (%)
School Enrollment - Graduate or professional (%)
School Enrollment - Not enrolled in school (%)
School enrollment - Public schools (%)
School enrollment - Private schools (%)
School enrollment - Not enrolled (%)
Median number of rooms in houses and condos
Median number of rooms in apartments
Housing units lacking complete plumbing facilities (%)
Housing units lacking complete kitchen facilities (%)
Density of houses
Urban houses (%)
Rural houses (%)
Households with people 60 years and over (%)
Households with people 65 years and over (%)
Households with people 75 years and over (%)
Households with one or more nonrelatives (%)
Households with no nonrelatives (%)
Population in households (%)
Family households (%)
Nonfamily households (%)
Population in families (%)
Family households with own children (%)
Median number of bedrooms in owner occupied houses
Mean number of bedrooms in owner occupied houses
Median number of bedrooms in renter occupied houses
Mean number of bedrooms in renter occupied houses
Median number of vehichles in owner occupied houses
Mean number of vehichles in owner occupied houses
Median number of vehichles in renter occupied houses
Mean number of vehichles in renter occupied houses
Mortgage status - with mortgage (%)
Mortgage status - with second mortgage (%)
Mortgage status - with home equity loan (%)
Mortgage status - with both second mortgage and home equity loan (%)
Mortgage status - without a mortgage (%)
Average family size
Average family size - White
Average family size - Black or African American
Average family size - Asian
Average family size - Hispanic or Latino
Average family size - American Indian and Alaska Native
Average family size - Multirace
Average family size - Other Race
Geographical mobility - Same house 1 year ago (%)
Geographical mobility - Moved within same county (%)
Geographical mobility - Moved from different county within same state (%)
Geographical mobility - Moved from different state (%)
Geographical mobility - Moved from abroad (%)
Place of birth - Born in state of residence (%)
Place of birth - Born in other state (%)
Place of birth - Native, outside of US (%)
Place of birth - Foreign born (%)
Housing units in structures - 1, detached (%)
Housing units in structures - 1, attached (%)
Housing units in structures - 2 (%)
Housing units in structures - 3 or 4 (%)
Housing units in structures - 5 to 9 (%)
Housing units in structures - 10 to 19 (%)
Housing units in structures - 20 to 49 (%)
Housing units in structures - 50 or more (%)
Housing units in structures - Mobile home (%)
Housing units in structures - Boat, RV, van, etc. (%)
House/condo owner moved in on average (years ago)
Renter moved in on average (years ago)
Year householder moved into unit - Moved in 1999 to March 2000 (%)
Year householder moved into unit - Moved in 1995 to 1998 (%)
Year householder moved into unit - Moved in 1990 to 1994 (%)
Year householder moved into unit - Moved in 1980 to 1989 (%)
Year householder moved into unit - Moved in 1970 to 1979 (%)
Year householder moved into unit - Moved in 1969 or earlier (%)
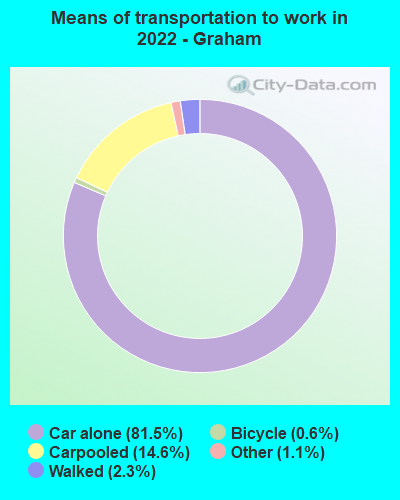
Means of transportation to work - Drove car alone (%)
Means of transportation to work - Carpooled (%)
Means of transportation to work - Public transportation (%)
Means of transportation to work - Bus or trolley bus (%)
Means of transportation to work - Streetcar or trolley car (%)
Means of transportation to work - Subway or elevated (%)
Means of transportation to work - Railroad (%)
Means of transportation to work - Ferryboat (%)
Means of transportation to work - Taxicab (%)
Means of transportation to work - Motorcycle (%)
Means of transportation to work - Bicycle (%)
Means of transportation to work - Walked (%)
Means of transportation to work - Other means (%)
Working at home (%)
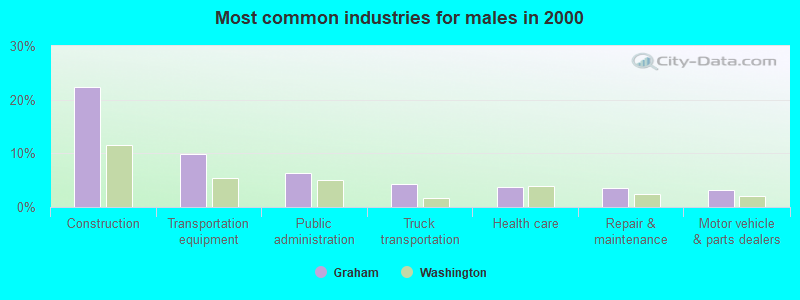
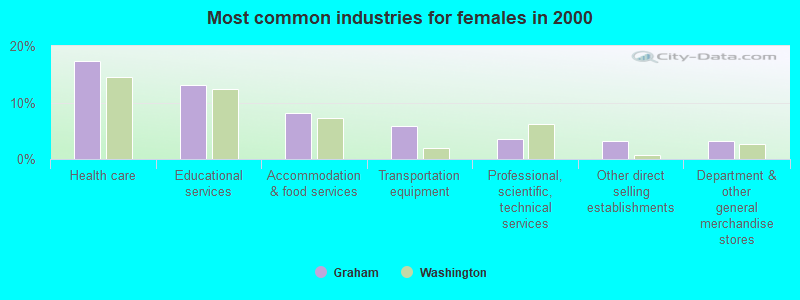
Industry diversity
Most Common Industries - Agriculture, forestry, fishing and hunting, and mining (%)
Most Common Industries - Agriculture, forestry, fishing and hunting (%)
Most Common Industries - Mining, quarrying, and oil and gas extraction (%)
Most Common Industries - Construction (%)
Most Common Industries - Manufacturing (%)
Most Common Industries - Wholesale trade (%)
Most Common Industries - Retail trade (%)
Most Common Industries - Transportation and warehousing, and utilities (%)
Most Common Industries - Transportation and warehousing (%)
Most Common Industries - Utilities (%)
Most Common Industries - Information (%)
Most Common Industries - Finance and insurance, and real estate and rental and leasing (%)
Most Common Industries - Finance and insurance (%)
Most Common Industries - Real estate and rental and leasing (%)
Most Common Industries - Professional, scientific, and management, and administrative and waste management services (%)
Most Common Industries - Professional, scientific, and technical services (%)
Most Common Industries - Management of companies and enterprises (%)
Most Common Industries - Administrative and support and waste management services (%)
Most Common Industries - Educational services, and health care and social assistance (%)
Most Common Industries - Educational services (%)
Most Common Industries - Health care and social assistance (%)
Most Common Industries - Arts, entertainment, and recreation, and accommodation and food services (%)
Most Common Industries - Arts, entertainment, and recreation (%)
Most Common Industries - Accommodation and food services (%)
Most Common Industries - Other services, except public administration (%)
Most Common Industries - Public administration (%)
Occupation diversity
Most Common Occupations - Management, business, science, and arts occupations (%)
Most Common Occupations - Management, business, and financial occupations (%)
Most Common Occupations - Management occupations (%)
Most Common Occupations - Business and financial operations occupations (%)
Most Common Occupations - Computer, engineering, and science occupations (%)
Most Common Occupations - Computer and mathematical occupations (%)
Most Common Occupations - Architecture and engineering occupations (%)
Most Common Occupations - Life, physical, and social science occupations (%)
Most Common Occupations - Education, legal, community service, arts, and media occupations (%)
Most Common Occupations - Community and social service occupations (%)
Most Common Occupations - Legal occupations (%)
Most Common Occupations - Education, training, and library occupations (%)
Most Common Occupations - Arts, design, entertainment, sports, and media occupations (%)
Most Common Occupations - Healthcare practitioners and technical occupations (%)
Most Common Occupations - Health diagnosing and treating practitioners and other technical occupations (%)
Most Common Occupations - Health technologists and technicians (%)
Most Common Occupations - Service occupations (%)
Most Common Occupations - Healthcare support occupations (%)
Most Common Occupations - Protective service occupations (%)
Most Common Occupations - Fire fighting and prevention, and other protective service workers including supervisors (%)
Most Common Occupations - Law enforcement workers including supervisors (%)
Most Common Occupations - Food preparation and serving related occupations (%)
Most Common Occupations - Building and grounds cleaning and maintenance occupations (%)
Most Common Occupations - Personal care and service occupations (%)
Most Common Occupations - Sales and office occupations (%)
Most Common Occupations - Sales and related occupations (%)
Most Common Occupations - Office and administrative support occupations (%)
Most Common Occupations - Natural resources, construction, and maintenance occupations (%)
Most Common Occupations - Farming, fishing, and forestry occupations (%)
Most Common Occupations - Construction and extraction occupations (%)
Most Common Occupations - Installation, maintenance, and repair occupations (%)
Most Common Occupations - Production, transportation, and material moving occupations (%)
Most Common Occupations - Production occupations (%)
Most Common Occupations - Transportation occupations (%)
Most Common Occupations - Material moving occupations (%)
People in Group quarters - Institutionalized population (%)
People in Group quarters - Correctional institutions (%)
People in Group quarters - Federal prisons and detention centers (%)
People in Group quarters - Halfway houses (%)
People in Group quarters - Local jails and other confinement facilities (including police lockups) (%)
People in Group quarters - Military disciplinary barracks (%)
People in Group quarters - State prisons (%)
People in Group quarters - Other types of correctional institutions (%)
People in Group quarters - Nursing homes (%)
People in Group quarters - Hospitals/wards, hospices, and schools for the handicapped (%)
People in Group quarters - Hospitals/wards and hospices for chronically ill (%)
People in Group quarters - Hospices or homes for chronically ill (%)
People in Group quarters - Military hospitals or wards for chronically ill (%)
People in Group quarters - Other hospitals or wards for chronically ill (%)
People in Group quarters - Hospitals or wards for drug/alcohol abuse (%)
People in Group quarters - Mental (Psychiatric) hospitals or wards (%)
People in Group quarters - Schools, hospitals, or wards for the mentally retarded (%)
People in Group quarters - Schools, hospitals, or wards for the physically handicapped (%)
People in Group quarters - Institutions for the deaf (%)
People in Group quarters - Institutions for the blind (%)
People in Group quarters - Orthopedic wards and institutions for the physically handicapped (%)
People in Group quarters - Wards in general hospitals for patients who have no usual home elsewhere (%)
People in Group quarters - Wards in military hospitals for patients who have no usual home elsewhere (%)
People in Group quarters - Juvenile institutions (%)
People in Group quarters - Long-term care (%)
People in Group quarters - Homes for abused, dependent, and neglected children (%)
People in Group quarters - Residential treatment centers for emotionally disturbed children (%)
People in Group quarters - Training schools for juvenile delinquents (%)
People in Group quarters - Short-term care, detention or diagnostic centers for delinquent children (%)
People in Group quarters - Type of juvenile institution unknown (%)
People in Group quarters - Noninstitutionalized population (%)
People in Group quarters - College dormitories (includes college quarters off campus) (%)
People in Group quarters - Military quarters (%)
People in Group quarters - On base (%)
People in Group quarters - Barracks, unaccompanied personnel housing (UPH), (Enlisted/Officer), ;and similar group living quarters for military personnel (%)
People in Group quarters - Transient quarters for temporary residents (%)
People in Group quarters - Military ships (%)
People in Group quarters - Group homes (%)
People in Group quarters - Homes or halfway houses for drug/alcohol abuse (%)
People in Group quarters - Homes for the mentally ill (%)
People in Group quarters - Homes for the mentally retarded (%)
People in Group quarters - Homes for the physically handicapped (%)
People in Group quarters - Other group homes (%)
People in Group quarters - Religious group quarters (%)
People in Group quarters - Dormitories (%)
People in Group quarters - Agriculture workers' dormitories on farms (%)
People in Group quarters - Job Corps and vocational training facilities (%)
People in Group quarters - Other workers' dormitories (%)
People in Group quarters - Crews of maritime vessels (%)
People in Group quarters - Other nonhousehold living situations (%)
People in Group quarters - Other noninstitutional group quarters (%)
Residents speaking English at home (%)
Residents speaking English at home - Born in the United States (%)
Residents speaking English at home - Native, born elsewhere (%)
Residents speaking English at home - Foreign born (%)
Residents speaking Spanish at home (%)
Residents speaking Spanish at home - Born in the United States (%)
Residents speaking Spanish at home - Native, born elsewhere (%)
Residents speaking Spanish at home - Foreign born (%)
Residents speaking other language at home (%)
Residents speaking other language at home - Born in the United States (%)
Residents speaking other language at home - Native, born elsewhere (%)
Residents speaking other language at home - Foreign born (%)
Class of Workers - Employee of private company (%)
Class of Workers - Self-employed in own incorporated business (%)
Class of Workers - Private not-for-profit wage and salary workers (%)
Class of Workers - Local government workers (%)
Class of Workers - State government workers (%)
Class of Workers - Federal government workers (%)
Class of Workers - Self-employed workers in own not incorporated business and Unpaid family workers (%)
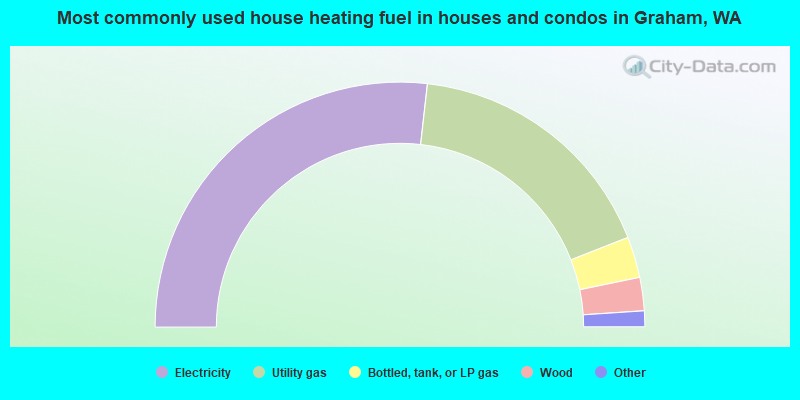
House heating fuel used in houses and condos - Utility gas (%)
House heating fuel used in houses and condos - Bottled, tank, or LP gas (%)
House heating fuel used in houses and condos - Electricity (%)
House heating fuel used in houses and condos - Fuel oil, kerosene, etc. (%)
House heating fuel used in houses and condos - Coal or coke (%)
House heating fuel used in houses and condos - Wood (%)
House heating fuel used in houses and condos - Solar energy (%)
House heating fuel used in houses and condos - Other fuel (%)
House heating fuel used in houses and condos - No fuel used (%)
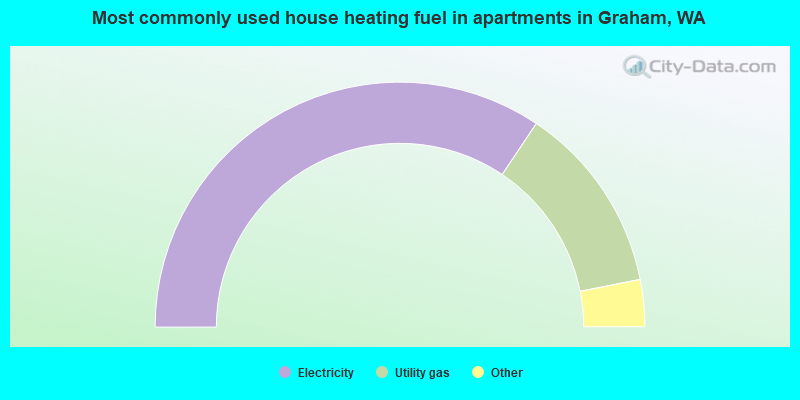
House heating fuel used in apartments - Utility gas (%)
House heating fuel used in apartments - Bottled, tank, or LP gas (%)
House heating fuel used in apartments - Electricity (%)
House heating fuel used in apartments - Fuel oil, kerosene, etc. (%)
House heating fuel used in apartments - Coal or coke (%)
House heating fuel used in apartments - Wood (%)
House heating fuel used in apartments - Solar energy (%)
House heating fuel used in apartments - Other fuel (%)
House heating fuel used in apartments - No fuel used (%)
Armed forces status - In Armed Forces (%)
Armed forces status - Civilian (%)
Armed forces status - Civilian - Veteran (%)
Armed forces status - Civilian - Nonveteran (%)
Fatal accidents locations in years 2005-2021
Fatal accidents locations in 2005
Fatal accidents locations in 2006
Fatal accidents locations in 2007
Fatal accidents locations in 2008
Fatal accidents locations in 2009
Fatal accidents locations in 2010
Fatal accidents locations in 2011
Fatal accidents locations in 2012
Fatal accidents locations in 2013
Fatal accidents locations in 2014
Fatal accidents locations in 2015
Fatal accidents locations in 2016
Fatal accidents locations in 2017
Fatal accidents locations in 2018
Fatal accidents locations in 2019
Fatal accidents locations in 2020
Fatal accidents locations in 2021
Alcohol use - People drinking some alcohol every month (%)
Alcohol use - People not drinking at all (%)
Alcohol use - Average days/month drinking alcohol
Alcohol use - Average drinks/week
Alcohol use - Average days/year people drink much
Audiometry - Average condition of hearing (%)
Audiometry - People that can hear a whisper from across a quiet room (%)
Audiometry - People that can hear normal voice from across a quiet room (%)
Audiometry - Ears ringing, roaring, buzzing (%)
Audiometry - Had a job exposure to loud noise (%)
Audiometry - Had off-work exposure to loud noise (%)
Blood Pressure & Cholesterol - Has high blood pressure (%)
Blood Pressure & Cholesterol - Checking blood pressure at home (%)
Blood Pressure & Cholesterol - Frequently checking blood cholesterol (%)
Blood Pressure & Cholesterol - Has high cholesterol level (%)
Consumer Behavior - Money monthly spent on food at supermarket/grocery store
Consumer Behavior - Money monthly spent on food at other stores
Consumer Behavior - Money monthly spent on eating out
Consumer Behavior - Money monthly spent on carryout/delivered foods
Consumer Behavior - Income spent on food at supermarket/grocery store (%)
Consumer Behavior - Income spent on food at other stores (%)
Consumer Behavior - Income spent on eating out (%)
Consumer Behavior - Income spent on carryout/delivered foods (%)
Current Health Status - General health condition (%)
Current Health Status - Blood donors (%)
Current Health Status - Has blood ever tested for HIV virus (%)
Current Health Status - Left-handed people (%)
Dermatology - People using sunscreen (%)
Diabetes - Diabetics (%)
Diabetes - Had a blood test for high blood sugar (%)
Diabetes - People taking insulin (%)
Diet Behavior & Nutrition - Diet health (%)
Diet Behavior & Nutrition - Milk product consumption (# of products/month)
Diet Behavior & Nutrition - Meals not home prepared (#/week)
Diet Behavior & Nutrition - Meals from fast food or pizza place (#/week)
Diet Behavior & Nutrition - Ready-to-eat foods (#/month)
Diet Behavior & Nutrition - Frozen meals/pizza (#/month)
Drug Use - People that ever used marijuana or hashish (%)
Drug Use - Ever used hard drugs (%)
Drug Use - Ever used any form of cocaine (%)
Drug Use - Ever used heroin (%)
Drug Use - Ever used methamphetamine (%)
Health Insurance - People covered by health insurance (%)
Kidney Conditions-Urology - Avg. # of times urinating at night
Medical Conditions - People with asthma (%)
Medical Conditions - People with anemia (%)
Medical Conditions - People with psoriasis (%)
Medical Conditions - People with overweight (%)
Medical Conditions - Elderly people having difficulties in thinking or remembering (%)
Medical Conditions - People who ever received blood transfusion (%)
Medical Conditions - People having trouble seeing even with glass/contacts (%)
Medical Conditions - People with arthritis (%)
Medical Conditions - People with gout (%)
Medical Conditions - People with congestive heart failure (%)
Medical Conditions - People with coronary heart disease (%)
Medical Conditions - People with angina pectoris (%)
Medical Conditions - People who ever had heart attack (%)
Medical Conditions - People who ever had stroke (%)
Medical Conditions - People with emphysema (%)
Medical Conditions - People with thyroid problem (%)
Medical Conditions - People with chronic bronchitis (%)
Medical Conditions - People with any liver condition (%)
Medical Conditions - People who ever had cancer or malignancy (%)
Mental Health - People who have little interest in doing things (%)
Mental Health - People feeling down, depressed, or hopeless (%)
Mental Health - People who have trouble sleeping or sleeping too much (%)
Mental Health - People feeling tired or having little energy (%)
Mental Health - People with poor appetite or overeating (%)
Mental Health - People feeling bad about themself (%)
Mental Health - People who have trouble concentrating on things (%)
Mental Health - People moving or speaking slowly or too fast (%)
Mental Health - People having thoughts they would be better off dead (%)
Oral Health - Average years since last visit a dentist
Oral Health - People embarrassed because of mouth (%)
Oral Health - People with gum disease (%)
Oral Health - General health of teeth and gums (%)
Oral Health - Average days a week using dental floss/device
Oral Health - Average days a week using mouthwash for dental problem
Oral Health - Average number of teeth
Pesticide Use - Households using pesticides to control insects (%)
Pesticide Use - Households using pesticides to kill weeds (%)
Physical Activity - People doing vigorous-intensity work activities (%)
Physical Activity - People doing moderate-intensity work activities (%)
Physical Activity - People walking or bicycling (%)
Physical Activity - People doing vigorous-intensity recreational activities (%)
Physical Activity - People doing moderate-intensity recreational activities (%)
Physical Activity - Average hours a day doing sedentary activities
Physical Activity - Average hours a day watching TV or videos
Physical Activity - Average hours a day using computer
Physical Functioning - People having limitations keeping them from working (%)
Physical Functioning - People limited in amount of work they can do (%)
Physical Functioning - People that need special equipment to walk (%)
Physical Functioning - People experiencing confusion/memory problems (%)
Physical Functioning - People requiring special healthcare equipment (%)
Prescription Medications - Average number of prescription medicines taking
Preventive Aspirin Use - Adults 40+ taking low-dose aspirin (%)
Reproductive Health - Vaginal deliveries (%)
Reproductive Health - Cesarean deliveries (%)
Reproductive Health - Deliveries resulted in a live birth (%)
Reproductive Health - Pregnancies resulted in a delivery (%)
Reproductive Health - Women breastfeeding newborns (%)
Reproductive Health - Women that had a hysterectomy (%)
Reproductive Health - Women that had both ovaries removed (%)
Reproductive Health - Women that have ever taken birth control pills (%)
Reproductive Health - Women taking birth control pills (%)
Reproductive Health - Women that have ever used Depo-Provera or injectables (%)
Reproductive Health - Women that have ever used female hormones (%)
Sexual Behavior - People 18+ that ever had sex (vaginal, anal, or oral) (%)
Sexual Behavior - Males 18+ that ever had vaginal sex with a woman (%)
Sexual Behavior - Males 18+ that ever performed oral sex on a woman (%)
Sexual Behavior - Males 18+ that ever had anal sex with a woman (%)
Sexual Behavior - Males 18+ that ever had any sex with a man (%)
Sexual Behavior - Females 18+ that ever had vaginal sex with a man (%)
Sexual Behavior - Females 18+ that ever performed oral sex on a man (%)
Sexual Behavior - Females 18+ that ever had anal sex with a man (%)
Sexual Behavior - Females 18+ that ever had any kind of sex with a woman (%)
Sexual Behavior - Average age people first had sex
Sexual Behavior - Average number of female sex partners in lifetime (males 18+)
Sexual Behavior - Average number of female vaginal sex partners in lifetime (males 18+)
Sexual Behavior - Average age people first performed oral sex on a woman (18+)
Sexual Behavior - Average number of woman performed oral sex on in lifetime (18+)
Sexual Behavior - Average number of male sex partners in lifetime (males 18+)
Sexual Behavior - Average number of male anal sex partners in lifetime (males 18+)
Sexual Behavior - Average age people first performed oral sex on a man (18+)
Sexual Behavior - Average number of male oral sex partners in lifetime (18+)
Sexual Behavior - People using protection when performing oral sex (%)
Sexual Behavior - Average number of times people have vaginal or anal sex a year
Sexual Behavior - People having sex without condom (%)
Sexual Behavior - Average number of male sex partners in lifetime (females 18+)
Sexual Behavior - Average number of male vaginal sex partners in lifetime (females 18+)
Sexual Behavior - Average number of female sex partners in lifetime (females 18+)
Sexual Behavior - Circumcised males 18+ (%)
Sleep Disorders - Average hours sleeping at night
Sleep Disorders - People that has trouble sleeping (%)
Smoking-Cigarette Use - People smoking cigarettes (%)
Taste & Smell - People 40+ having problems with smell (%)
Taste & Smell - People 40+ having problems with taste (%)
Taste & Smell - People 40+ that ever had wisdom teeth removed (%)
Taste & Smell - People 40+ that ever had tonsils teeth removed (%)
Taste & Smell - People 40+ that ever had a loss of consciousness because of a head injury (%)
Taste & Smell - People 40+ that ever had a broken nose or other serious injury to face or skull (%)
Taste & Smell - People 40+ that ever had two or more sinus infections (%)
Weight - Average height (inches)
Weight - Average weight (pounds)
Weight - Average BMI
Weight - People that are obese (%)
Weight - People that ever were obese (%)
Weight - People trying to lose weight (%)
According to our research of Washington and other state lists, there were 15 registered sex offenders living in Graham, Washington as of April 23, 2024 . The ratio of all residents to sex offenders in Graham is 1,785 to 1.The ratio of registered sex offenders to all residents in this city is lower than the state average.
Latest news from Graham, WA collected exclusively by city-data.com from local newspapers, TV, and radio stations
Ancestries: German (10.7%), American (10.4%), Irish (5.1%), Scandinavian (4.8%), Italian (3.8%), English (3.7%).
Current Local Time:
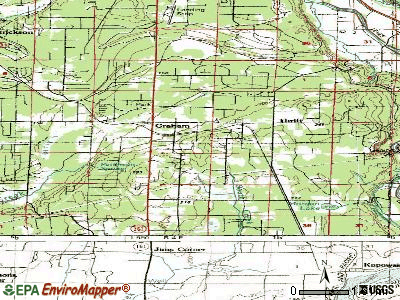
Land area: 21.4 square miles.
Population density: 1,097 people per square mile (low).
2,560 residents are foreign born (2.6% Asia , 1.7% Europe , 1.4% Latin America ).
This place:
7.3%Washington:
14.9%
Median real estate property taxes paid for housing units with mortgages in 2022: $4,483 (0.8%)Median real estate property taxes paid for housing units with no mortgage in 2022: $4,506 (1.0%)
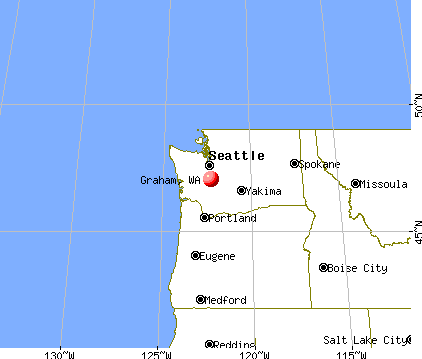
Nearest city with pop. 50,000+: Graham-Thrift, WA (0.7 miles
Nearest city with pop. 200,000+: East Seattle, WA (40.2 miles
Nearest city with pop. 1,000,000+: Los Angeles, CA
Nearest cities:
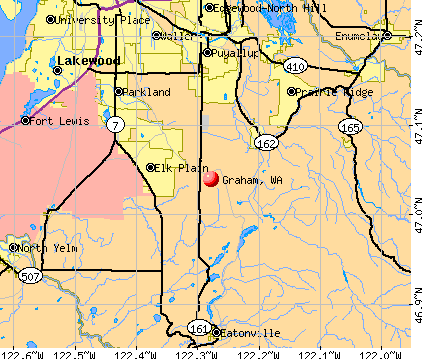
Latitude: 47.04 N, Longitude: 122.28 W
Daytime population change due to commuting: -12,423 (-35.4%)Workers who live and work in this place: 2,582 (15.9%)
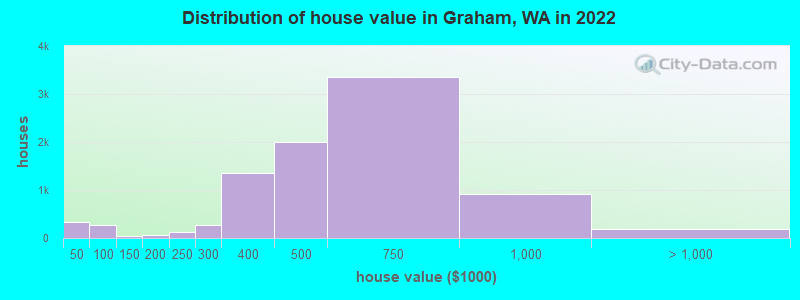
Property values in Graham, WA
Unemployment in December 2023:
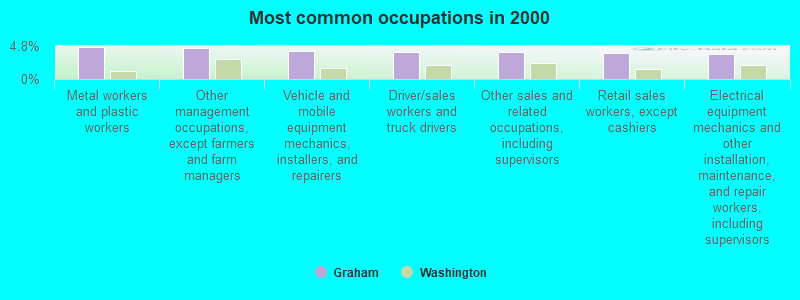
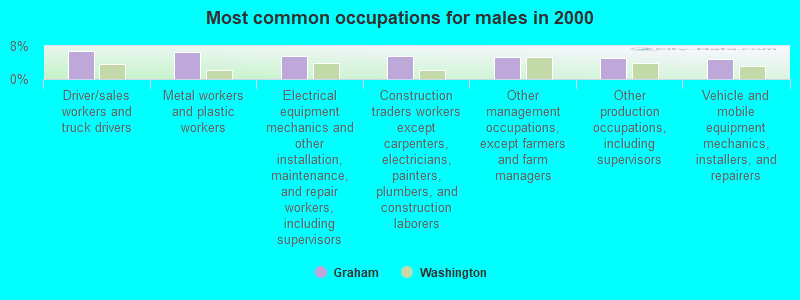
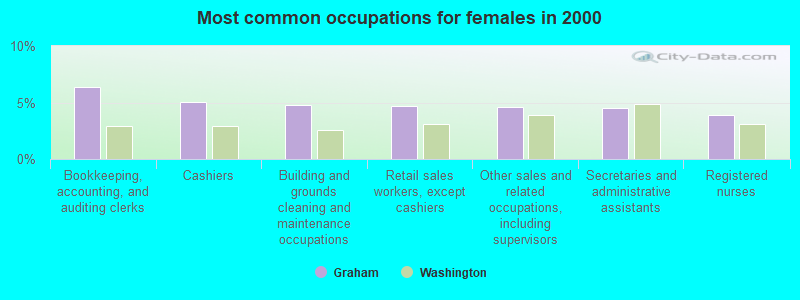
Most common occupations in Graham, WA (%)
Both Males Females
Metal workers and plastic workers (4.6%)
Other management occupations, except farmers and farm managers (4.5%)
Vehicle and mobile equipment mechanics, installers, and repairers (4.0%)
Driver/sales workers and truck drivers (3.9%)
Other sales and related occupations, including supervisors (3.9%)
Retail sales workers, except cashiers (3.7%)
Electrical equipment mechanics and other installation, maintenance, and repair workers, including supervisors (3.7%)
Driver/sales workers and truck drivers (6.7%)
Metal workers and plastic workers (6.6%)
Electrical equipment mechanics and other installation, maintenance, and repair workers, including supervisors (5.6%)
Construction traders workers except carpenters, electricians, painters, plumbers, and construction laborers (5.6%)
Other management occupations, except farmers and farm managers (5.3%)
Other production occupations, including supervisors (5.1%)
Vehicle and mobile equipment mechanics, installers, and repairers (4.7%)
Bookkeeping, accounting, and auditing clerks (6.4%)
Cashiers (5.1%)
Building and grounds cleaning and maintenance occupations (4.8%)
Retail sales workers, except cashiers (4.7%)
Other sales and related occupations, including supervisors (4.6%)
Secretaries and administrative assistants (4.5%)
Registered nurses (3.9%)
Earthquake activity:
Graham-area historical earthquake activity is significantly above Washington state average. It is 1423% greater than the overall U.S. average. On 4/13/1949 at 19:55:42, a magnitude 7.0 (7.0 UK, Class: Major, Intensity: VIII - XII) earthquake occurred 17.9 miles away from Graham center, causing $80,000,000 total damage On 2/28/2001 at 18:54:32, a magnitude 6.8 (6.5 MB, 6.6 MS, 6.8 MW, Class: Strong, Intensity: VII - IX) earthquake occurred 14.6 miles away from the city center, causing $2,000,000,000 total damage and $305,000,000 insured lossesOn 2/28/2001 at 18:54:32, a magnitude 6.8 (6.8 MD, Depth: 32.2 mi) earthquake occurred 22.4 miles away from Graham center On 4/29/1965 at 15:28:43, a magnitude 6.6 (6.6 UK) earthquake occurred 19.3 miles away from the city center, causing $28,000,000 total damage On 7/3/1999 at 01:43:54, a magnitude 5.8 (5.4 MB, 5.5 MS, 5.8 MW, 5.3 ME, Depth: 25.2 mi, Class: Moderate, Intensity: VI - VII) earthquake occurred 45.1 miles away from Graham center On 1/31/1922 at 13:17:28, a magnitude 7.6 (7.6 UK) earthquake occurred 467.8 miles away from Graham center Magnitude types: body-wave magnitude (MB), duration magnitude (MD), energy magnitude (ME), surface-wave magnitude (MS), moment magnitude (MW) Natural disasters: The number of natural disasters in Pierce County (21) is greater than the US average (15).Major Disasters (Presidential) Declared: 20Emergencies Declared: 1Floods: 13, Storms: 10, Mudslides: 5, Landslides: 4, Winter Storms: 4, Earthquakes: 2, Heavy Rains: 2, Winds: 2, Hurricane: 1, Volcanic Eruption: 1, Other: 1 (Note: some incidents may be assigned to more than one category). Hospitals and medical centers in Graham: GRAHAM DIALYSIS CENTER (10219 196TH ST CT E STE C)
Other hospitals and medical centers near Graham: GREATER PUYALLUP DIALYSIS CENTER (Dialysis Facility, about 9 miles away; PUYALLUP, WA)
PUYALLUP COMMUNITY DIALYSIS CENTER (Dialysis Facility, about 9 miles away; PUYALLUP, WA)
REGENCY AT PUYALLUP REHABILITATION CENTER (Nursing Home, about 9 miles away; PUYALLUP, WA)
MULTICARE GOOD SAMARITAN HOSPITAL (about 10 miles away; PUYALLUP, WA)
PARKLAND DIALYSIS CENTER (Dialysis Facility, about 10 miles away; TACOMA, WA)
KINDRED TRANSITIONAL CARE AND REHAB - RAINIER VISTA (Nursing Home, about 10 miles away; PUYALLUP, WA)
LIFE CARE CENTER OF PUYALLUP (Nursing Home, about 10 miles away; PUYALLUP, WA)
Heliports located in Graham: Amtrak station near Graham: 16 miles: TACOMA (1001 PUYALLUP AVE.) Services: ticket office, partially wheelchair accessible, enclosed waiting area, public restrooms, public payphones, full-service food facilities, free short-term parking, free long-term parking, call for taxi service, intercity bus service, public transit connection.
Colleges/universities with over 2000 students nearest to Graham:
Pierce College at Puyallup (about 9 miles; Puyallup, WA ; Full-time enrollment: 2,529)
Pacific Lutheran University (about 11 miles; Tacoma, WA ; FT enrollment: 3,548)
Clover Park Technical College (about 14 miles; Lakewood, WA ; FT enrollment: 4,185)
University of Washington-Tacoma Campus (about 17 miles; Tacoma, WA ; FT enrollment: 3,788)
Pierce College at Fort Steilacoom (about 17 miles; Lakewood, WA ; FT enrollment: 5,228)
Bates Technical College (about 17 miles; Tacoma, WA ; FT enrollment: 4,929)
University of Puget Sound (about 19 miles; Tacoma, WA ; FT enrollment: 2,788)
Public high schools in Graham:
Public elementary/middle schools in Graham: KAPOWSIN ELEMENTARY Location: 10412 264TH STREET EAST, Grades: PK-6)ROCKY RIDGE ELEMENTARY Location: 6514 260TH STREET EAST, Grades: PK-6)GRAHAM ELEMENTARY Location: 10026 204TH STREET EAST, Grades: PK-6)CENTENNIAL ELEMENTARY BETHEL Location: 24323 54TH AVENUE EAST, Grades: PK-6)
NORTH STAR ELEMENTARY Location: 7719 224TH STREET EAST, Grades: PK-6)NELSON ELEMENTARY SCHOOL Location: 22109 108TH AVE E, Grades: PK-6)
See full list of schools located in Graham User-submitted facts and corrections:
Mary Bridge Childrens Hospital is closer to 30 miles than 12 miles.
bethel is the best jr high that you could be apart of in graham.
Birthplace of: Steve Dildine - Football player.
Pierce County has a predicted average indoor radon screening level less than 2 pCi/L (pico curies per liter) - Low Potential Drinking water stations with addresses in Graham and their reported violations in the past:
BETHEL WATER CO (Population served: 230, Groundwater):
Past monitoring violations:
116 regular monitoring violations
Population served: 136, Groundwater):
Past health violations:
MCL, Monthly (TCR) - In AUG-2006, Contaminant: Coliform
MCL, Monthly (TCR) - In JUL-2006, Contaminant: Coliform
Past monitoring violations:
27 regular monitoring violations
Drinking water stations with addresses in Graham that have no violations reported:
BETHEL RANCHETTES MUTUAL WATER CO (Population served: 65, Primary Water Source Type: Groundwater)
MARTINEZ WATER SYSTEM (Population served: 35, Primary Water Source Type: Groundwater)
Average household size: This place:
3.0 peopleWashington:
2.5 people
Percentage of family households: This place:
79.5%Whole state:
64.4%
Percentage of households with unmarried partners: This place:
7.6%Whole state:
7.7%
Likely homosexual households (counted as self-reported same-sex unmarried-partner households)
Lesbian couples: 0.4% of all households Gay men: 0.4% of all households
People in group quarters in Graham in 2010:
35 people in other noninstitutional facilities
20 people in nursing facilities/skilled-nursing facilities
11 people in residential treatment centers for adults
7 people in workers' group living quarters and job corps centers
4 people in group homes intended for adults
people in homes or halfway houses for drug/alcohol abuse in 2000Banks with branches in Graham (2011 data):
Valley Bank: Graham Branch at 9921 224th Street East, branch established on 1998/11/09. Info updated 2006/11/03: Bank assets: $236.9 mil, Deposits: $207.6 mil, headquarters in Puyallup, WA, positive income , Commercial Lending Specialization, 9 total offices , Holding Company: Valley Community Bancshares, Inc.
KeyBank National Association: Graham Branch at 22115 Meridian Ave., East, branch established on 1983/06/25. Info updated 2008/03/03: Bank assets: $86,198.8 mil, Deposits: $64,214.8 mil, headquarters in Cleveland, OH, positive income , Commercial Lending Specialization, 1067 total offices , Holding Company: Keycorp
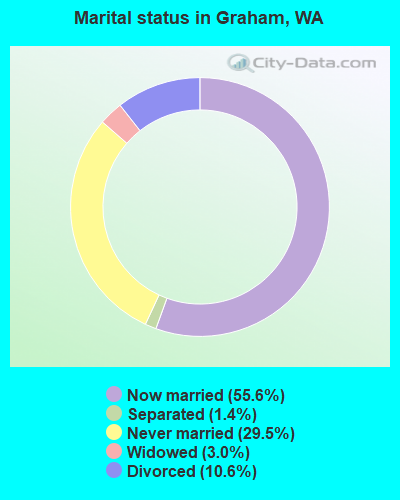
For population 15 years and over in Graham:
Never married: 29.5%Now married: 55.6%Separated: 1.4%Widowed: 3.0%Divorced: 10.6% For population 25 years and over in Graham:
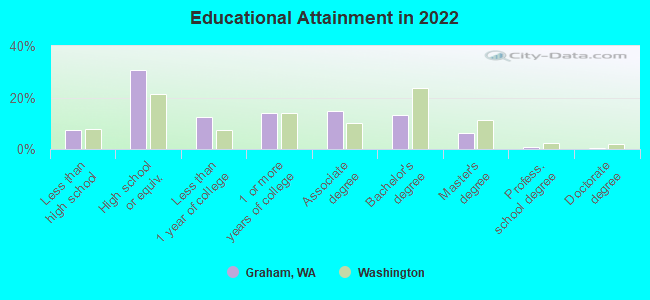
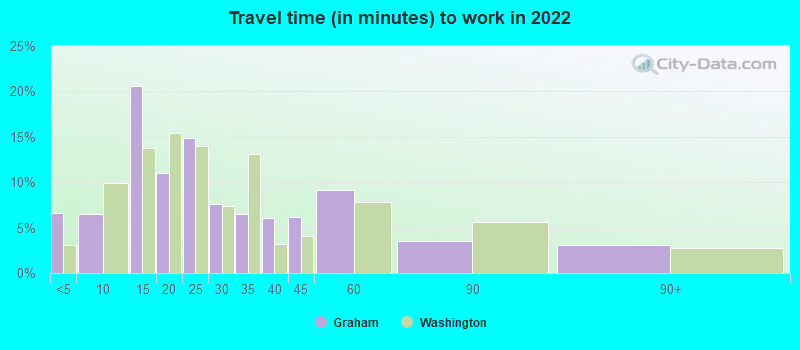
High school or higher: 92.2%Bachelor's degree or higher: 19.9%Graduate or professional degree: 6.6%Unemployed: 5.0%Mean travel time to work (commute): 35.2 minutes
Education Gini index (Inequality in education) Here:
8.7Washington average:
11.6
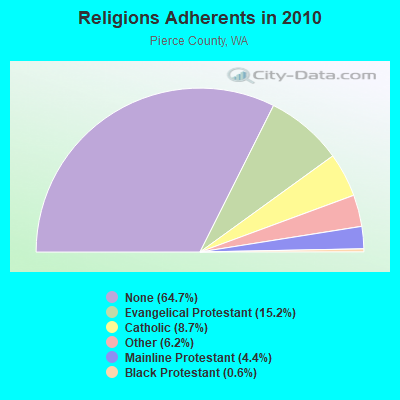
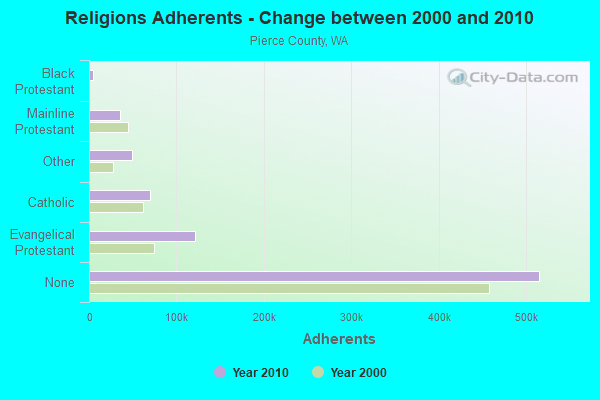
Religion statistics for Graham, WA (based on Pierce County data)
Religion Adherents Congregations Evangelical Protestant 121,041 365 Catholic 69,558 26 Other 49,446 109 Mainline Protestant 34,906 123 Black Protestant 4,817 17 Orthodox 605 4 None 514,852 -
Source: Clifford Grammich, Kirk Hadaway, Richard Houseal, Dale E.Jones, Alexei Krindatch, Richie Stanley and Richard H.Taylor. 2012. 2010 U.S.Religion Census: Religious Congregations & Membership Study. Association of Statisticians of American Religious Bodies. Jones, Dale E., et al. 2002. Congregations and Membership in the United States 2000. Nashville, TN: Glenmary Research Center. Graphs represent county-level data
Food Environment Statistics: Number of grocery stores : 132Pierce County :
1.71 / 10,000 pop.Washington :
2.06 / 10,000 pop.
Number of supercenters and club stores : 13Here :
0.17 / 10,000 pop.Washington :
0.19 / 10,000 pop.
Number of convenience stores (no gas) : 105This county :
1.36 / 10,000 pop.State :
1.18 / 10,000 pop.
Number of convenience stores (with gas) : 152Pierce County :
1.97 / 10,000 pop.State :
2.67 / 10,000 pop.
Number of full-service restaurants : 511This county :
6.61 / 10,000 pop.State :
8.26 / 10,000 pop.
Adult diabetes rate : Pierce County :
8.4%Washington :
7.7%
Adult obesity rate : This county :
29.3%Washington :
25.7%
Low-income preschool obesity rate : Here :
14.1%Washington :
13.9%
Health and Nutrition: Healthy diet rate : This city:
50.3%State:
49.9%
Average overall health of teeth and gums : Graham:
48.8%Washington:
47.2%
People feeling badly about themselves : People not drinking alcohol at all : Graham:
9.1%Washington:
10.5%
Average hours sleeping at night : Overweight people : Graham:
36.3%Washington:
32.8%
General health condition : Average condition of hearing : More about Health and Nutrition of Graham, WA Residents
8.45% of this county's 2021 resident taxpayers lived in other counties in 2020 ($69,857 average adjusted gross income )
Here:
8.45%Washington average:
7.53%
0.15% of residents moved from foreign countries ($1,028 average AGI )Pierce County:
0.15%Washington average:
0.05%
Top counties from which taxpayers relocated into this county between 2020 and 2021:
8.36% of this county's 2020 resident taxpayers moved to other counties in 2021 ($66,301 average adjusted gross income )
Here:
8.36%Washington average:
7.40%
0.12% of residents moved to foreign countries ($853 average AGI )Pierce County:
0.12%Washington average:
0.04%
Top counties to which taxpayers relocated from this county between 2020 and 2021:
Businesses in Graham, WA
Name Count Name Count
Ace Hardware 1 Rite Aid 1 AutoZone 1 Starbucks 1 Curves 1 Subway 1 Domino's Pizza 1 U-Haul 3 H&R Block 1 UPS 1 MasterBrand Cabinets 2 Vons 1
Strongest AM radio stations in Graham:
KJR (950 AM; 50 kW; SEATTLE, WA)
KIRO (710 AM; 50 kW; SEATTLE, WA; Owner: ENTERCOM SEATTLE LICENSE, LLC)
KTTH (770 AM; 50 kW; SEATTLE, WA; Owner: ENTERCOM SEATTLE LICENSE, LLC)
KGNW (820 AM; 50 kW; BURIEN-SEATTLE, WA; Owner: INSPIRATION MEDIA, INC.)
KYCW (1090 AM; 50 kW; SEATTLE, WA; Owner: INFINITY RADIO SUBSIDIARY OPERATIONS INC.)
KNWX (1210 AM; 28 kW; AUBURN-FEDERAL WAY, WA; Owner: ENTERCOM SEATTLE LICENSE, LLC)
KHHO (850 AM; 10 kW; TACOMA, WA; Owner: ACKERLEY MEDIA GROUP, INC.)
KOMO (1000 AM; 50 kW; SEATTLE, WA; Owner: FISHER BROADCASTING - SEATTLE RADIO, L.L.C.)
KLAY (1180 AM; 5 kW; LAKEWOOD, WA; Owner: CLAY FRANK HUNTINGTON)
KIXI (880 AM; 50 kW; MERCER ISLAND/SEATTL, WA; Owner: BELLEVUE RADIO, INC.)
KKOL (1300 AM; 50 kW; SEATTLE, WA; Owner: INSPIRATION MEDIA, INC.)
KZIZ (1560 AM; 5 kW; SUMNER, WA; Owner: KRIZ BROADCASTING, INC.)
KVI (570 AM; 5 kW; SEATTLE, WA; Owner: FISHER BROADCASTING - SEATTLE RADIO, L.L.C.)
Strongest FM radio stations in Graham:
K201EX (88.1 FM; GREENWATER, WA; Owner: CALVARY CHAPEL OF TWIN FALLS, INC.)
KXXO (96.1 FM; OLYMPIA, WA; Owner: 3 CITIES, INC.)
KBSG-FM (97.3 FM; TACOMA, WA; Owner: ENTERCOM SEATTLE LICENSE, LLC)
KBKS (106.1 FM; TACOMA, WA; Owner: INFINITY RADIO SUBSIDIARY OPERATIONS INC.)
KING-FM (98.1 FM; SEATTLE, WA; Owner: CLASSIC RADIO, INC.)
KLSY-FM (92.5 FM; BELLEVUE, WA; Owner: BELLEVUE RADIO INC.)
KPLU-FM (88.5 FM; TACOMA, WA; Owner: PACIFIC LUTHERAN UNIVERSITY, INC.)
KWJZ (98.9 FM; SEATTLE, WA; Owner: ORCA RADIO, INC.)
KZOK-FM (102.5 FM; SEATTLE, WA; Owner: INFINITY RADIO SUBSIDIARY OPERATIONS INC.)
KMPS-FM (94.1 FM; SEATTLE, WA; Owner: INFINITY RADIO SUBSIDIARY OPERATIONS INC.)
KMTT (103.7 FM; TACOMA, WA; Owner: ENTERCOM SEATTLE LICENSE, LLC)
KNDD (107.7 FM; SEATTLE, WA; Owner: ENTERCOM SEATTLE LICENSE, LLC)
KYPT (96.5 FM; SEATTLE, WA; Owner: INFINITY RADIO SUBSIDIARY OPERATIONS INC.)
KQBZ (100.7 FM; SEATTLE, WA; Owner: ENTERCOM SEATTLE LICENSE, LLC)
KFNK (104.9 FM; EATONVILLE, WA; Owner: ACKERLEY MEDIA GROUP, INC.)
KISW (99.9 FM; SEATTLE, WA; Owner: ENTERCOM SEATTLE LICENSE, LLC)
KMNT (102.9 FM; CENTRALIA, WA; Owner: CITICASTERS LICENSES, L.P.)
KJR-FM (95.7 FM; SEATTLE, WA; Owner: ACKERLEY MEDIA GROUP, INC.)
KUBE (93.3 FM; SEATTLE, WA; Owner: ACKERLEY MEDIA GROUP, INC.)
KBTC-FM (91.7 FM; TACOMA, WA; Owner: BATES TECHNICAL COLLEGE)
TV broadcast stations around Graham:
KBTC-TV (Channel 28; TACOMA, WA; Owner: BATES TECHNICAL COLLEGE)
KSTW (Channel 11; TACOMA, WA; Owner: UPN TELEVISION STATIONS INC.)
KHCV (Channel 45; SEATTLE, WA; Owner: NORTH PACIFIC INTERNATIONAL TELEVISION, INC.)
KING-TV (Channel 5; SEATTLE, WA; Owner: KING BROADCASTING COMPANY)
KWPX (Channel 33; BELLEVUE, WA; Owner: PAXSON COMMUNICATIONS LICENSE COMPANY, LLC)
K58DP (Channel 58; SEATTLE, WA; Owner: WORD OF GOD FELLOWSHIP, INC.)
KTWB-TV (Channel 22; SEATTLE, WA; Owner: TRIBUNE TELEVISION HOLDINGS, INC.)
KOMO-TV (Channel 4; SEATTLE, WA; Owner: FISHER BROADCASTING - SEATTLE TV, L.L.C.)
KWDK (Channel 56; TACOMA, WA; Owner: PUGET SOUND EDUCATIONAL TV, INC.)
K54GS (Channel 54; PUYALLUP, WA; Owner: KIRO-TV HOLDINGS, INC.)
National Bridge Inventory (NBI) Statistics 4 Number of bridges20ft / 6.2m Total length $7,357,000 Total costs8,275 Total average daily traffic487 Total average daily truck traffic13,660 Total future (year 2040) average daily traffic
FCC Registered Cell Phone Towers: 2 (
See the full list of FCC Registered Cell Phone Towers in Graham )
FCC Registered Antenna Towers: 62 (
See the full list of FCC Registered Antenna Towers )
FCC Registered Broadcast Land Mobile Towers: 7
500 W Of 25016 Meridian St E (Lat: 47.029833 Lon: -122.302333), Call Sign: WNAG888, Licensee ID: L00006847, Assigned Frequencies: 156.240 MHz, Grant Date: 08/14/2014, Expiration Date: 08/23/2024, Registrant: Pierce County, 2501 So. 35th Street Suite D, Tacoma, WA 98409-7405, Phone: (253) 798-7011, Fax: (253) 798-3307, Email:
24511 104th Ave Ct E (Lat: 47.030389 Lon: -122.291222), Call Sign: KNGP749, Licensee ID: L00111490, Assigned Frequencies: 35.2800 MHz, Grant Date: 05/21/2003, Expiration Date: 06/13/2013, Cancellation Date: 08/17/2013, Registrant: Hokkaido Drilling & Developing Corp, Graham, WA 98338, Phone: (206) 847-3579 500 W Of 25016 Meridian St E (Lat: 47.029833 Lon: -122.302333), Call Sign: KNAL366, Assigned Frequencies: 451.125 MHz, 451.025 MHz, Grant Date: 03/30/2022, Expiration Date: 06/22/2032, Registrant: Tacoma Public Utilities, 3628 South 35th Street, Tacoma, WA 98409, Phone: (253) 502-8551, Fax: (253) 396-3205, Email:
THRIFT, Lat: 47.048833 Lon: -122.262889, Call Sign: WQFQ715, Assigned Frequencies: 452.312 MHz, 457.312 MHz, Grant Date: 09/12/2006, Expiration Date: 09/12/2016, Cancellation Date: 11/12/2016, Certifier: Chuck Warner, Registrant: Federal Licensing Inc, 1588 Fairfield Road, Gettysburg, PA 17325, Phone: (717) 334-9262, Fax: (717) 334-6440 GRAHAM HILL, 25016 Meridian St (Lat: 47.029139 Lon: -122.300556), Type: Gtower, Structure height: 60.3 m, Call Sign: WQPZ542, Assigned Frequencies: 773.856 MHz, 774.006 MHz, Grant Date: 08/17/2022, Expiration Date: 09/27/2032, Certifier: Tim Lenk, Registrant: Stantec, 3400 188th Street, Suite 285, Lynnwood, WA 98037, Phone: (206) 667-0547, Email:
Lat: 47.058056 Lon: -122.286528, Call Sign: WQVI298, Assigned Frequencies: 151.722 MHz, 152.915 MHz, 159.802 MHz, 160.057 MHz, 160.200 MHz, Grant Date: 02/19/2015, Expiration Date: 02/19/2025, Certifier: Michael Presswood, Registrant: Puget Sound Instrument, 5007 Pacific Highway East, Ste 5, Tacoma, WA 98424, Phone: (253) 922-7890, Fax: (253) 922-2650, Email:
Lat: 47.029639 Lon: -122.299000, Call Sign: WROP789, Assigned Frequencies: 457.825 MHz, Grant Date: 11/16/2021, Expiration Date: 11/16/2031, Certifier: Jose D Mena, Registrant: Kamstrup Water Metering, LLC, 245 Hembree Park Drive, Ste. 110, Roswell, GA 30076, Phone: (404) 835-6716, Email:
FCC Registered Microwave Towers: 14 (
See the full list of FCC Registered Microwave Towers in this town )
FCC Registered Amateur Radio Licenses: 254 (
See the full list of FCC Registered Amateur Radio Licenses in Graham )
FAA Registered Aircraft: 58 (
See the full list of FAA Registered Aircraft in Graham )
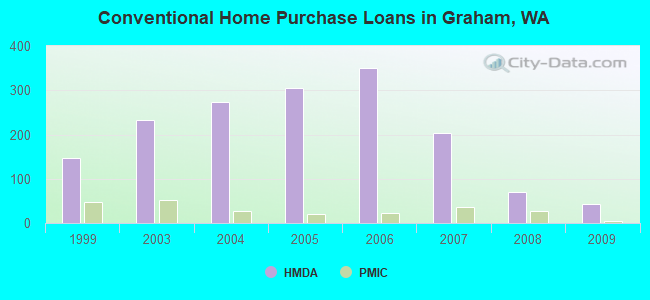
Home Mortgage Disclosure Act Aggregated Statistics For Year 2009(Based on 1 full and 3 partial tracts) A) FHA, FSA/RHS & VA B) Conventional C) Refinancings D) Home Improvement Loans E) Loans on Dwellings For 5+ Families F) Non-occupant Loans on G) Loans On Manufactured Number Average Value Number Average Value Number Average Value Number Average Value Number Average Value Number Average Value Number Average Value
LOANS ORIGINATED 103 $257,554 43 $221,400 389 $234,751 7 $119,303 0 $0 12 $198,008 47 $177,784 APPLICATIONS APPROVED, NOT ACCEPTED 7 $224,793 6 $145,212 44 $242,566 4 $76,985 0 $0 5 $186,026 7 $139,631 APPLICATIONS DENIED 29 $248,437 10 $205,128 166 $256,881 10 $83,708 1 $306,000 8 $210,959 27 $162,750 APPLICATIONS WITHDRAWN 17 $227,244 7 $191,837 94 $250,527 1 $81,270 0 $0 2 $159,500 13 $161,232 FILES CLOSED FOR INCOMPLETENESS 1 $314,700 1 $65,100 23 $243,412 0 $0 0 $0 1 $197,240 5 $114,706
Aggregated Statistics For Year 2008(Based on 1 full and 3 partial tracts) A) FHA, FSA/RHS & VA B) Conventional C) Refinancings D) Home Improvement Loans F) Non-occupant Loans on G) Loans On Manufactured Number Average Value Number Average Value Number Average Value Number Average Value Number Average Value Number Average Value
LOANS ORIGINATED 84 $262,531 69 $256,476 258 $239,429 20 $149,572 15 $190,014 54 $185,055 APPLICATIONS APPROVED, NOT ACCEPTED 7 $246,896 16 $220,545 50 $265,034 4 $49,542 11 $235,908 9 $162,490 APPLICATIONS DENIED 15 $237,940 24 $239,228 181 $245,134 30 $129,219 11 $274,825 41 $150,067 APPLICATIONS WITHDRAWN 15 $239,237 13 $267,975 87 $242,206 7 $106,896 7 $198,371 12 $181,487 FILES CLOSED FOR INCOMPLETENESS 1 $216,540 1 $316,280 22 $245,209 1 $55,930 0 $0 2 $210,415
Aggregated Statistics For Year 2007(Based on 1 full and 3 partial tracts) A) FHA, FSA/RHS & VA B) Conventional C) Refinancings D) Home Improvement Loans E) Loans on Dwellings For 5+ Families F) Non-occupant Loans on G) Loans On Manufactured Number Average Value Number Average Value Number Average Value Number Average Value Number Average Value Number Average Value Number Average Value
LOANS ORIGINATED 26 $252,250 203 $232,968 354 $231,956 51 $123,108 1 $850,000 33 $226,228 68 $163,541 APPLICATIONS APPROVED, NOT ACCEPTED 2 $233,545 36 $192,730 60 $237,206 10 $109,551 0 $0 4 $284,642 20 $138,132 APPLICATIONS DENIED 5 $223,508 48 $216,285 270 $239,432 64 $131,092 0 $0 10 $245,809 61 $147,198 APPLICATIONS WITHDRAWN 2 $304,055 23 $227,932 110 $238,036 11 $138,629 0 $0 5 $226,070 12 $167,816 FILES CLOSED FOR INCOMPLETENESS 0 $0 7 $235,914 35 $254,388 0 $0 0 $0 1 $371,940 5 $163,732
Aggregated Statistics For Year 2006(Based on 1 full and 3 partial tracts) A) FHA, FSA/RHS & VA B) Conventional C) Refinancings D) Home Improvement Loans F) Non-occupant Loans on G) Loans On Manufactured Number Average Value Number Average Value Number Average Value Number Average Value Number Average Value Number Average Value
LOANS ORIGINATED 40 $241,871 350 $186,483 428 $198,693 55 $113,824 59 $177,494 94 $155,758 APPLICATIONS APPROVED, NOT ACCEPTED 5 $221,686 42 $190,845 78 $199,805 6 $103,848 6 $209,633 15 $126,803 APPLICATIONS DENIED 12 $209,435 82 $169,512 257 $204,260 64 $119,533 16 $164,164 66 $118,972 APPLICATIONS WITHDRAWN 8 $220,179 41 $163,450 138 $202,356 16 $122,428 6 $142,048 16 $145,121 FILES CLOSED FOR INCOMPLETENESS 1 $172,210 9 $163,190 45 $266,578 3 $108,117 2 $122,570 2 $173,295
Aggregated Statistics For Year 2005(Based on 1 full and 3 partial tracts) A) FHA, FSA/RHS & VA B) Conventional C) Refinancings D) Home Improvement Loans E) Loans on Dwellings For 5+ Families F) Non-occupant Loans on G) Loans On Manufactured Number Average Value Number Average Value Number Average Value Number Average Value Number Average Value Number Average Value Number Average Value
LOANS ORIGINATED 41 $208,051 304 $157,812 437 $183,701 39 $94,932 1 $889,000 44 $146,306 67 $128,974 APPLICATIONS APPROVED, NOT ACCEPTED 5 $198,974 39 $146,330 64 $178,422 6 $50,180 0 $0 6 $174,847 21 $109,499 APPLICATIONS DENIED 7 $173,997 82 $150,619 231 $176,695 44 $67,902 0 $0 10 $168,023 88 $112,738 APPLICATIONS WITHDRAWN 3 $123,817 46 $147,077 197 $185,353 16 $123,856 0 $0 6 $145,218 32 $132,974 FILES CLOSED FOR INCOMPLETENESS 0 $0 9 $151,153 32 $190,938 1 $187,550 0 $0 1 $78,320 4 $112,610
Aggregated Statistics For Year 2004(Based on 1 full and 3 partial tracts) A) FHA, FSA/RHS & VA B) Conventional C) Refinancings D) Home Improvement Loans F) Non-occupant Loans on G) Loans On Manufactured Number Average Value Number Average Value Number Average Value Number Average Value Number Average Value Number Average Value
LOANS ORIGINATED 65 $186,201 274 $156,030 359 $164,013 31 $48,417 31 $129,595 72 $122,963 APPLICATIONS APPROVED, NOT ACCEPTED 2 $202,490 31 $147,799 93 $172,180 3 $115,643 5 $117,274 17 $117,815 APPLICATIONS DENIED 15 $176,067 49 $165,564 261 $156,674 34 $61,286 13 $116,496 68 $114,709 APPLICATIONS WITHDRAWN 6 $172,157 25 $169,896 207 $167,145 12 $81,806 6 $150,003 26 $116,658 FILES CLOSED FOR INCOMPLETENESS 1 $272,770 9 $168,148 23 $169,223 1 $58,750 2 $173,180 4 $122,930
Aggregated Statistics For Year 2003(Based on 1 full and 3 partial tracts) A) FHA, FSA/RHS & VA B) Conventional C) Refinancings D) Home Improvement Loans F) Non-occupant Loans on Number Average Value Number Average Value Number Average Value Number Average Value Number Average Value
LOANS ORIGINATED 64 $175,293 233 $145,592 727 $152,657 39 $43,612 34 $121,247 APPLICATIONS APPROVED, NOT ACCEPTED 5 $151,498 37 $136,159 90 $149,108 3 $16,330 5 $123,710 APPLICATIONS DENIED 7 $162,270 62 $124,005 208 $140,936 32 $21,677 8 $145,468 APPLICATIONS WITHDRAWN 7 $168,706 38 $125,621 139 $167,062 17 $41,222 6 $139,210 FILES CLOSED FOR INCOMPLETENESS 1 $94,180 4 $189,288 25 $165,825 0 $0 0 $0
Aggregated Statistics For Year 1999(Based on 3 partial tracts) A) FHA, FSA/RHS & VA B) Conventional C) Refinancings D) Home Improvement Loans E) Loans on Dwellings For 5+ Families F) Non-occupant Loans on Number Average Value Number Average Value Number Average Value Number Average Value Number Average Value Number Average Value
LOANS ORIGINATED 65 $140,475 146 $119,020 189 $118,465 30 $20,505 1 $195,630 12 $96,642 APPLICATIONS APPROVED, NOT ACCEPTED 2 $166,780 27 $102,912 45 $109,667 12 $19,711 0 $0 1 $127,660 APPLICATIONS DENIED 6 $123,030 64 $87,164 104 $108,052 31 $22,467 0 $0 4 $99,215 APPLICATIONS WITHDRAWN 6 $146,890 24 $132,218 61 $106,264 4 $43,745 0 $0 2 $70,820 FILES CLOSED FOR INCOMPLETENESS 1 $131,760 6 $107,442 23 $111,445 1 $48,070 0 $0 2 $71,275
Detailed HMDA statistics for the following Tracts:
0731.09
, 0731.13 , 0731.16 , 0731.18
Private Mortgage Insurance Companies Aggregated Statistics For Year 2009(Based on 1 full and 3 partial tracts) A) Conventional B) Refinancings Number Average Value Number Average Value
LOANS ORIGINATED 4 $303,640 9 $272,543 APPLICATIONS APPROVED, NOT ACCEPTED 4 $266,588 8 $302,824 APPLICATIONS DENIED 1 $132,670 6 $326,890 APPLICATIONS WITHDRAWN 0 $0 0 $0 FILES CLOSED FOR INCOMPLETENESS 0 $0 1 $324,920
Aggregated Statistics For Year 2008(Based on 1 full and 3 partial tracts) A) Conventional B) Refinancings C) Non-occupant Loans on D) Loans On Manufactured Number Average Value Number Average Value Number Average Value Number Average Value
LOANS ORIGINATED 28 $293,288 24 $308,757 2 $284,255 1 $94,770 APPLICATIONS APPROVED, NOT ACCEPTED 12 $281,449 11 $293,689 0 $0 0 $0 APPLICATIONS DENIED 4 $287,805 4 $322,615 1 $322,120 0 $0 APPLICATIONS WITHDRAWN 2 $319,490 1 $344,330 0 $0 0 $0 FILES CLOSED FOR INCOMPLETENESS 1 $358,430 0 $0 0 $0 0 $0
Aggregated Statistics For Year 2007(Based on 1 full and 3 partial tracts) A) Conventional B) Refinancings C) Non-occupant Loans on D) Loans On Manufactured Number Average Value Number Average Value Number Average Value Number Average Value
LOANS ORIGINATED 37 $288,970 27 $285,233 1 $355,890 2 $137,305 APPLICATIONS APPROVED, NOT ACCEPTED 9 $271,203 4 $298,622 1 $131,670 0 $0 APPLICATIONS DENIED 0 $0 0 $0 0 $0 0 $0 APPLICATIONS WITHDRAWN 2 $224,455 3 $254,593 0 $0 0 $0 FILES CLOSED FOR INCOMPLETENESS 1 $171,120 1 $339,300 0 $0 0 $0
Aggregated Statistics For Year 2006(Based on 1 full and 3 partial tracts) A) Conventional B) Refinancings C) Non-occupant Loans on D) Loans On Manufactured Number Average Value Number Average Value Number Average Value Number Average Value
LOANS ORIGINATED 22 $270,430 13 $281,588 2 $217,725 6 $203,257 APPLICATIONS APPROVED, NOT ACCEPTED 2 $199,810 6 $288,725 0 $0 1 $100,280 APPLICATIONS DENIED 0 $0 0 $0 0 $0 0 $0 APPLICATIONS WITHDRAWN 1 $219,710 1 $471,430 0 $0 0 $0 FILES CLOSED FOR INCOMPLETENESS 0 $0 0 $0 0 $0 0 $0
Aggregated Statistics For Year 2005(Based on 1 full and 3 partial tracts) A) Conventional B) Refinancings C) Non-occupant Loans on D) Loans On Manufactured Number Average Value Number Average Value Number Average Value Number Average Value
LOANS ORIGINATED 20 $208,057 15 $239,043 2 $147,925 5 $140,980 APPLICATIONS APPROVED, NOT ACCEPTED 2 $284,810 5 $214,764 1 $150,430 1 $172,470 APPLICATIONS DENIED 0 $0 0 $0 0 $0 0 $0 APPLICATIONS WITHDRAWN 1 $101,540 1 $216,320 0 $0 1 $101,540 FILES CLOSED FOR INCOMPLETENESS 0 $0 0 $0 0 $0 0 $0
Aggregated Statistics For Year 2004(Based on 1 full and 3 partial tracts) A) Conventional B) Refinancings C) Non-occupant Loans on D) Loans On Manufactured Number Average Value Number Average Value Number Average Value Number Average Value
LOANS ORIGINATED 27 $211,778 20 $192,545 2 $153,155 6 $176,528 APPLICATIONS APPROVED, NOT ACCEPTED 10 $200,342 11 $209,169 1 $140,910 1 $153,480 APPLICATIONS DENIED 0 $0 0 $0 0 $0 0 $0 APPLICATIONS WITHDRAWN 1 $114,040 3 $240,803 0 $0 0 $0 FILES CLOSED FOR INCOMPLETENESS 0 $0 0 $0 0 $0 0 $0
Aggregated Statistics For Year 2003(Based on 1 full and 3 partial tracts) A) Conventional B) Refinancings C) Non-occupant Loans on Number Average Value Number Average Value Number Average Value
LOANS ORIGINATED 52 $182,581 80 $178,839 4 $142,962 APPLICATIONS APPROVED, NOT ACCEPTED 7 $179,099 21 $162,951 0 $0 APPLICATIONS DENIED 2 $102,180 6 $154,215 0 $0 APPLICATIONS WITHDRAWN 2 $126,735 3 $180,620 0 $0 FILES CLOSED FOR INCOMPLETENESS 1 $74,720 0 $0 1 $74,720
Aggregated Statistics For Year 1999(Based on 3 partial tracts) A) Conventional B) Refinancings C) Non-occupant Loans on Number Average Value Number Average Value Number Average Value
LOANS ORIGINATED 47 $149,024 29 $143,229 1 $107,180 APPLICATIONS APPROVED, NOT ACCEPTED 5 $144,164 6 $142,953 0 $0 APPLICATIONS DENIED 1 $216,110 1 $159,300 0 $0 APPLICATIONS WITHDRAWN 0 $0 1 $102,070 0 $0 FILES CLOSED FOR INCOMPLETENESS 1 $91,040 0 $0 0 $0
Detailed PMIC statistics for the following Tracts:
0731.09
, 0731.13 , 0731.16 , 0731.18
Most common first names in Graham, WA among deceased individuals Name Count Lived (average)
Robert 51 67.0 years James 47 69.7 years William 40 73.1 years John 38 72.4 years Mary 33 78.4 years Dorothy 30 79.9 years George 26 74.8 years Edward 24 76.4 years Charles 22 71.4 years Helen 19 84.4 years
Most common last names in Graham, WA among deceased individuals Last name Count Lived (average)
Anderson 21 73.6 years Johnson 19 70.9 years Clark 14 74.7 years Smith 14 76.4 years Nelson 13 79.4 years Miller 13 71.3 years Davis 10 77.5 years Stewart 9 73.9 years Brown 9 81.0 years Martin 9 77.6 years
Graham compared to Washington state average:
Unemployed percentage significantly below state average. Black race population percentage significantly above state average. Hispanic race population percentage significantly above state average. Foreign-born population percentage above state average. Renting percentage significantly below state average. Length of stay since moving in significantly above state average. House age significantly below state average. Number of college students above state average.
#68 on the list of "Top 100 cities with longest commuting times (pop. 5,000+)"
#28 on the list of "Top 101 counties with the highest average weight of females"
#41 on the list of "Top 101 counties with the largest increase in the number of births per 1000 residents 2000-2006 to 2007-2013 (pop 50,000+)"
#41 on the list of "Top 101 counties with the highest ground withdrawal of fresh water for public supply"
#48 on the list of "Top 101 counties with the highest percentage of residents relocating from foreign countries between 2010 and 2011 (pop. 50,000+)"
#50 on the list of "Top 101 counties with the most Evangelical Protestant congregations"
Top Patent Applicants
William J. Tapia (6)
Kevin E. Mccrary (3)
Lisa K. Dodge (2)
William Pellegrini (2)
Monty W. Dodge Sr. (2)
Glen P. Gordon (2)
Todd Matthew Harris (2)
Anthony P. Valpiani (2)
Marcus Paul Pascua (1)
Darrin Johnson (1)
Total of 43 patent applications in 2008-2024.


 Recent articles from our blog. Our writers, many of them Ph.D. graduates or candidates, create easy-to-read articles on a wide variety of topics.

 , pop. 56,970).
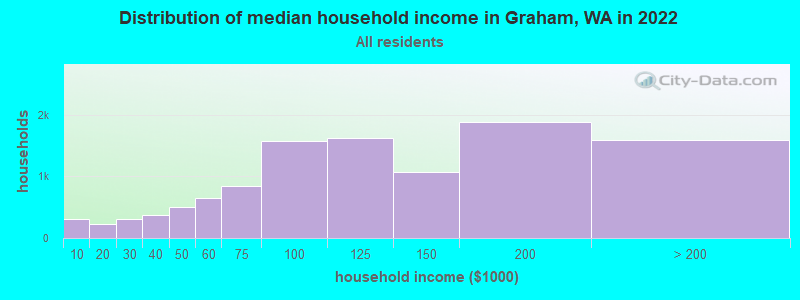


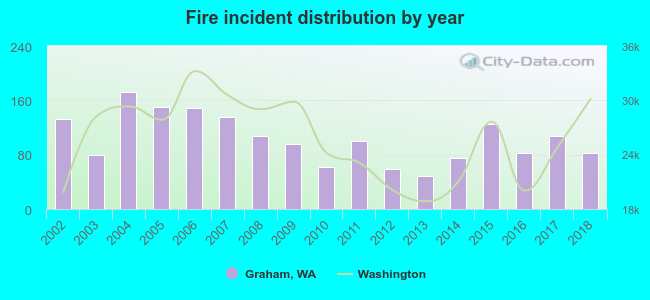 According to the data from the years 2002 - 2018 the average number of fires per year is 104. The highest number of reported fires - 173 took place in 2004, and the least - 48 in 2013. The data has a declining trend.
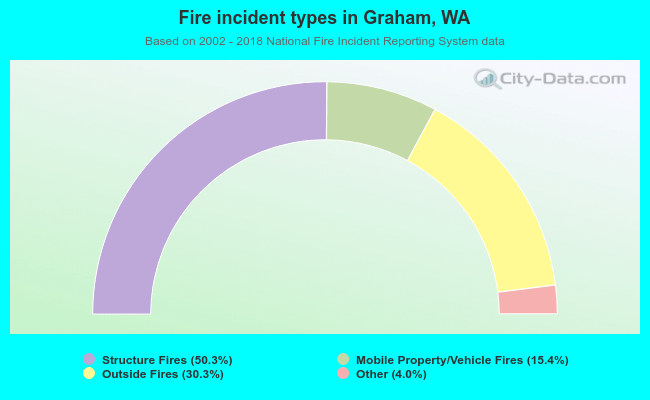 When looking into fire subcategories, the most reports belonged to: Structure Fires (50.3%), and Outside Fires (30.3%).