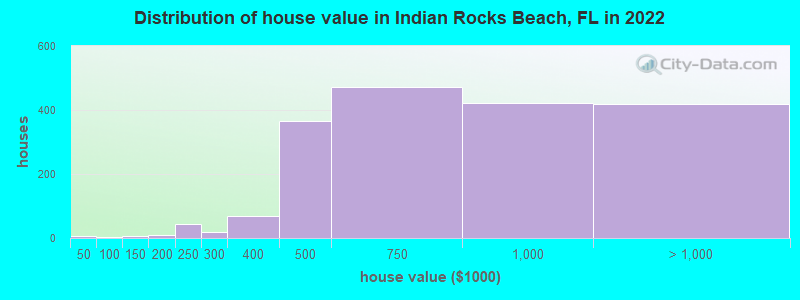
Estimated median house or condo value in 2022: $843,446 (it was $184,400 in 2000)
Indian Rocks Beach:
$843,446
FL:
$354,100
Mean prices in 2022:all housing units: over $1,000,000; detached houses: over $1,000,000; townhouses or other attached units: $769,896; in 2-unit structures: $785,635; in 3-to-4-unit structures: over $1,000,000; in 5-or-more-unit structures: over $1,000,000
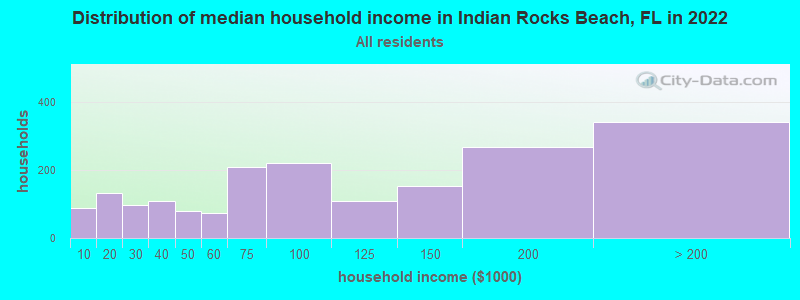
Median gross rent in 2022: $1,540.
March 2022 cost of living index in Indian Rocks Beach: 107.6 (more than average, U.S. average is 100)
Percentage of residents living in poverty in 2022: 9.0%
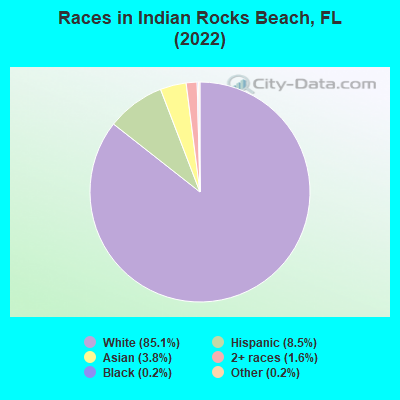
(8.5% for White Non-Hispanic residents, 12.0% for Hispanic or Latino residents, 23.6% for other race residents, 14.2% for two or more races residents)
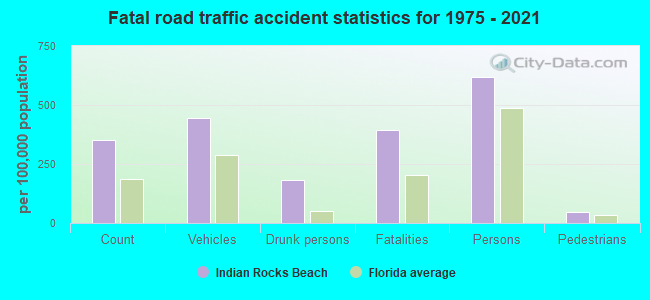
According to our research of Florida and other state lists, there were 3 registered sex offenders living in Indian Rocks Beach, Florida as of April 18, 2024. The ratio of all residents to sex offenders in Indian Rocks Beach is 1,436 to 1. The ratio of registered sex offenders to all residents in this city is lower than the state average.
Crime rates in Indian Rocks Beach by year
Type
2009
2010
2011
2012
2013
2014
2015
2016
2017
2018
2019
2020
2021
2022
Murders (per 100,000)
0 (0.0)
0 (0.0)
2 (48.0)
0 (0.0)
0 (0.0)
0 (0.0)
1 (23.7)
0 (0.0)
0 (0.0)
0 (0.0)
0 (0.0)
0 (0.0)
0 (0.0)
0 (0.0)
Rapes (per 100,000)
1 (19.4)
6 (145.9)
1 (24.0)
1 (24.0)
1 (24.1)
2 (47.7)
2 (47.4)
0 (0.0)
5 (114.9)
1 (23.2)
2 (46.3)
5 (116.0)
1 (23.3)
0 (0.0)
Robberies (per 100,000)
1 (19.4)
1 (24.3)
1 (24.0)
1 (24.0)
0 (0.0)
1 (23.8)
1 (23.7)
0 (0.0)
1 (23.0)
0 (0.0)
0 (0.0)
1 (23.2)
0 (0.0)
0 (0.0)
Assaults (per 100,000)
14 (272.2)
15 (364.7)
7 (167.9)
17 (407.4)
9 (216.9)
9 (214.5)
4 (94.8)
6 (140.2)
0 (0.0)
5 (116.1)
6 (139.0)
9 (208.8)
4 (93.1)
1 (27.4)
Burglaries (per 100,000)
26 (505.5)
22 (534.9)
30 (719.6)
22 (527.2)
14 (337.3)
15 (357.5)
20 (474.2)
12 (280.4)
12 (275.8)
10 (232.1)
6 (139.0)
4 (92.8)
3 (69.8)
10 (274.0)
Thefts (per 100,000)
139 (2,703)
81 (1,969)
94 (2,255)
104 (2,492)
79 (1,904)
72 (1,716)
91 (2,157)
75 (1,752)
75 (1,724)
70 (1,625)
55 (1,275)
72 (1,670)
40 (931.1)
34 (931.8)
Auto thefts (per 100,000)
5 (97.2)
4 (97.3)
9 (215.9)
8 (191.7)
2 (48.2)
6 (143.0)
8 (189.7)
7 (163.6)
5 (114.9)
7 (162.5)
6 (139.0)
2 (46.4)
2 (46.6)
4 (109.6)
Arson (per 100,000)
0 (0.0)
0 (0.0)
0 (0.0)
0 (0.0)
0 (0.0)
0 (0.0)
0 (0.0)
0 (0.0)
0 (0.0)
0 (0.0)
0 (0.0)
0 (0.0)
0 (0.0)
0 (0.0)
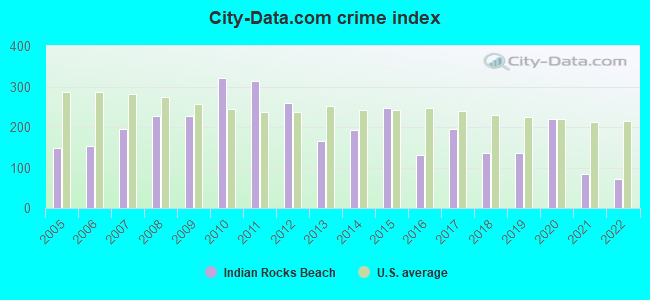
City-Data.com crime index
227.1
320.9
313.7
259.8
166.3
193.3
246.1
130.8
196.3
136.0
136.7
218.5
83.1
70.7
The City-Data.com crime index weighs serious crimes and violent crimes more heavily. Higher means more crime, U.S. average is 246.1. It adjusts for the number of visitors and daily workers commuting into cities.
Latest news from Indian Rocks Beach, FL collected exclusively by city-data.com from local newspapers, TV, and radio stations
Ancestries: English (13.5%), German (12.6%), Italian (11.9%), American (9.1%), European (8.1%), Irish (6.5%).
Current Local Time: EST time zone
Elevation: 10 feet
Land area: 0.93 square miles.
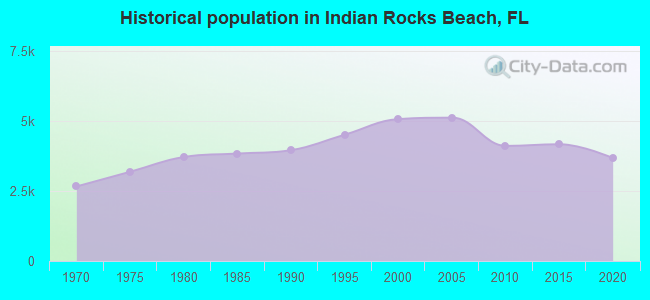
Population density: 3,934 people per square mile (average).
359 residents are foreign born (2.8% Europe, 2.5% Latin America, 2.0% Asia, 1.9% North America).
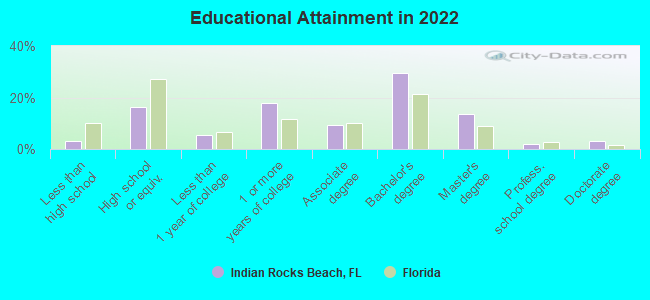
This city:
9.7%
Florida:
21.1%
Median real estate property taxes paid for housing units with mortgages in 2022: $4,877 (0.6%) Median real estate property taxes paid for housing units with no mortgage in 2022: $4,920 (0.6%)
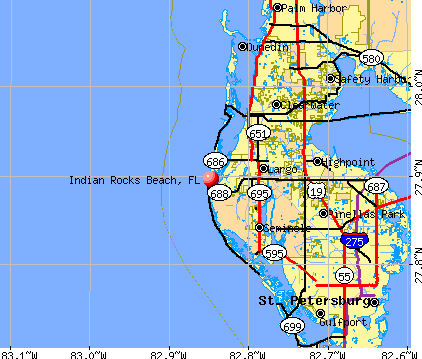
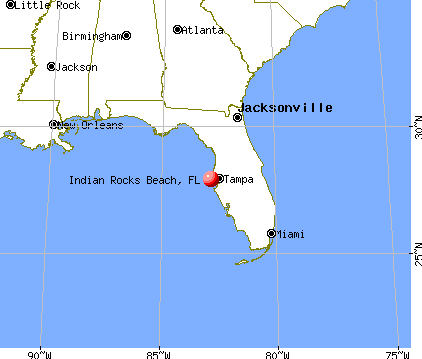
Nearest city with pop. 50,000+: Largo, FL (4.4 miles , pop. 69,371).
Nearest city with pop. 200,000+: St. Petersburg, FL (13.5 miles , pop. 248,232).
Nearest city with pop. 1,000,000+: Houston, TX (770.1 miles , pop. 1,953,631).
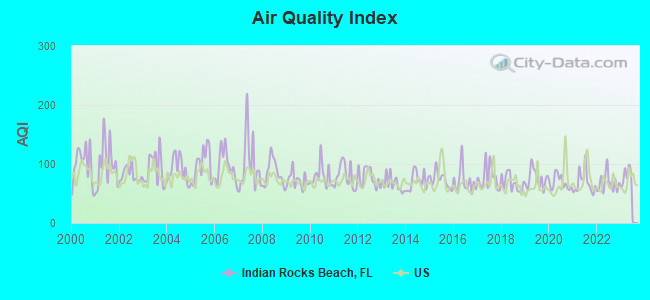
Air Quality Index (AQI) level in 2022 was 67.2. This is about average.
City:
67.2
U.S.:
72.6
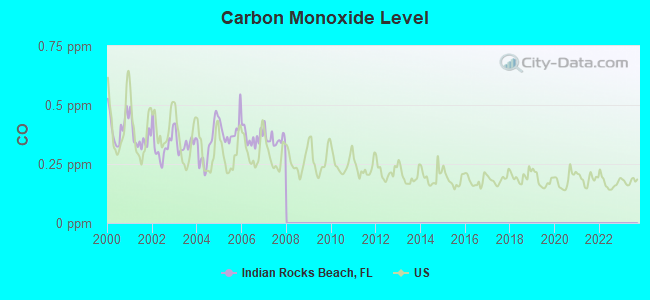
Carbon Monoxide (CO) [ppm] level in 2007 was 0.358. This is significantly worse than average.Closest monitor was 3.4 miles away from the city center.
City:
0.358
U.S.:
0.251
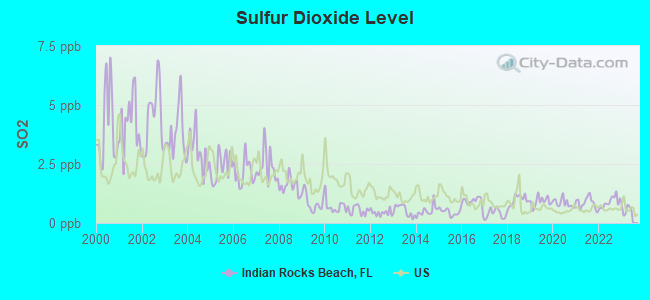
Sulfur Dioxide (SO2) [ppb] level in 2022 was 0.886. This is significantly better than average.Closest monitor was 3.4 miles away from the city center.
City:
0.886
U.S.:
1.515
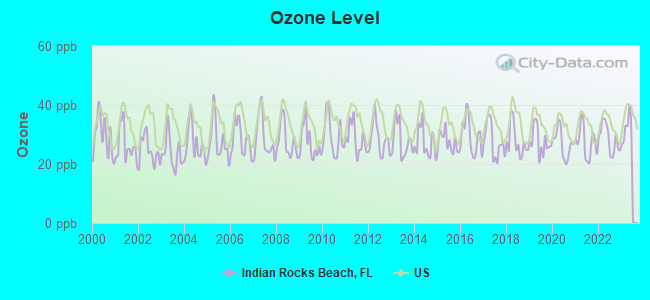
Ozone [ppb] level in 2022 was 28.7. This is about average.Closest monitor was 5.0 miles away from the city center.
City:
28.7
U.S.:
33.3
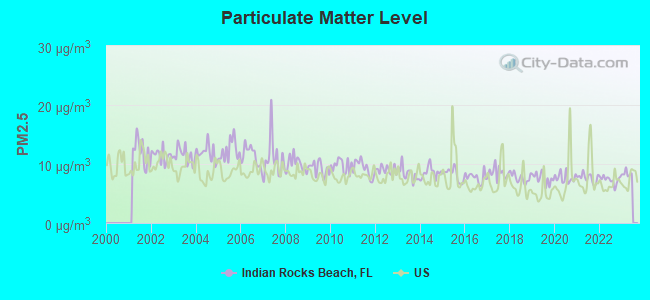
Particulate Matter (PM10) [µg/m3] level in 2022 was 18.7. This is about average.Closest monitor was 4.5 miles away from the city center.
City:
18.7
U.S.:
19.2
Particulate Matter (PM2.5) [µg/m3] level in 2022 was 7.32. This is about average.Closest monitor was 7.9 miles away from the city center.
City:
7.32
U.S.:
8.11
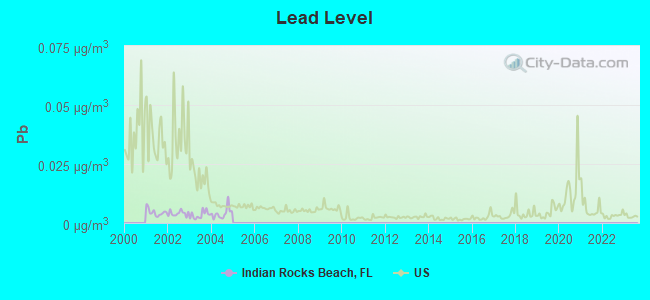
Lead (Pb) [µg/m3] level in 2004 was 0.00408. This is significantly better than average.Closest monitor was 3.4 miles away from the city center.
City:
0.00408
U.S.:
0.00931
Tornado activity:
Indian Rocks Beach-area historical tornado activity is slightly above Florida state average. It is 18% greater than the overall U.S. average.
On 4/4/1966, a category F4 (max. wind speeds 207-260 mph) tornado 3.4 miles away from the Indian Rocks Beach city center killed 11 peopleand injured 530 peopleand causedbetween $5,000,000 and $50,000,000 in damages.
On 5/4/1978, a category F3 (max. wind speeds 158-206 mph) tornado 9.2 miles away from the city center killed 3 peopleand injured 94 peopleand causedbetween $500,000 and $5,000,000 in damages.
Earthquake activity:
Indian Rocks Beach-area historical earthquake activity is significantly above Florida state average. It is 89% smaller than the overall U.S. average.
On 9/10/2006 at 14:56:08, a magnitude 5.9 (5.9 MB, 5.5 MS, 5.8 MW, Class: Moderate, Intensity: VI - VII) earthquake occurred 259.3 miles away from Indian Rocks Beach center On 10/24/1997 at 08:35:17, a magnitude 4.9 (4.8 MB, 4.2 MS, 4.9 LG, Depth: 6.2 mi, Class: Light, Intensity: IV - V) earthquake occurred 347.4 miles away from Indian Rocks Beach center On 5/6/2018 at 16:47:09, a magnitude 4.6 (4.6 MB, Depth: 6.2 mi) earthquake occurred 356.4 miles away from the city center On 3/31/1992 at 14:59:39, a magnitude 3.8 (3.8 MB, Depth: 3.1 mi, Class: Light, Intensity: II - III) earthquake occurred 220.1 miles away from Indian Rocks Beach center On 11/22/1974 at 05:25:55, a magnitude 4.7 (4.7 MB) earthquake occurred 381.8 miles away from the city center On 8/2/1974 at 08:52:09, a magnitude 4.9 (4.3 MB, 4.9 LG) earthquake occurred 413.9 miles away from the city center Magnitude types: regional Lg-wave magnitude (LG), body-wave magnitude (MB), surface-wave magnitude (MS), moment magnitude (MW)
Natural disasters:
The number of natural disasters in Pinellas County (24) is greater than the US average (15). Major Disasters (Presidential) Declared: 14 Emergencies Declared: 5
Causes of natural disasters: Hurricanes: 10, Fires: 5, Floods: 4, Tornadoes: 4, Tropical Storms: 4, Storms: 3, Freeze: 1, Wind: 1, Other: 1 (Note: some incidents may be assigned to more than one category).
Hospitals and medical centers near Indian Rocks Beach:
SUN COAST HOSPITAL (Hospital, about 2 miles away; LARGO, FL)
OAK MANOR HEALTHCARE AND REHABILITATION CENTER (Nursing Home, about 2 miles away; LARGO, FL)
ADVANTAGE HOME ASSISTED CARE, INC (Home Health Center, about 2 miles away; LARGO, FL)
LARGO MEDICAL CENTER Acute Care Hospitals (about 4 miles away; LARGO, FL)
BAY BREEZE DIALYSIS CLINIC INC (Dialysis Facility, about 4 miles away; LARGO, FL)
WRIGHTS HEALTH CARE AND REHABILITATION CENTER (Nursing Home, about 4 miles away; SEMINOLE, FL)
PALM GARDEN OF PINELLAS (Nursing Home, about 4 miles away; LARGO, FL)
Amtrak stations near Indian Rocks Beach:
10 miles: CLEARWATER (20967 U.S. 19) - Bus Station
11 miles: PINELLAS PARK (PARK BLVD. AT U.S. 19) - Bus Station . Services: ticket office, enclosed waiting area, public restrooms, public payphones, full-service food facilities, free short-term parking, call for car rental service, call for taxi service, public transit connection.
18 miles: TARPON SPRINGS (2337 U.S. 19) - Bus Station
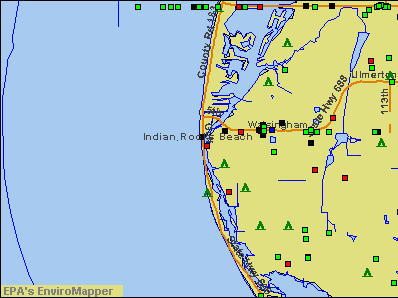
Notable locations in Indian Rocks Beach: 15th Avenue Boat Ramp (A), Pinellas Suncoast Fire and Rescue Station 27 (B). Display/hide their locations on the map
Parks in Indian Rocks Beach include: Kolb Park (1), South Park (2), 12th Avenue Park (3), Brown Park (4), Chief Chic-A-Si Park (5), Keegan Clair Park (6), Leash-Free Dog Park (7), Indian Rocks Beach Nature Preserve (8), 1st Street Boardwalk (9). Display/hide their locations on the map
Hotels: Boston Mallory Cottages (610 Barry Pl), Colonial Court Inn (318 Gulf Boulevard), Anchor Court Apartments (940 Gulf Blvd).
Pinellas County has a predicted average indoor radon screening level less than 2 pCi/L (pico curies per liter) - Low Potential
Average household size:
This city:
1.9 people
Florida:
2.5 people
Percentage of family households:
This city:
49.9%
Whole state:
65.2%
Percentage of households with unmarried partners:
This city:
8.8%
Whole state:
7.3%
Likely homosexual households (counted as self-reported same-sex unmarried-partner households)
Lesbian couples: 0.7% of all households
Gay men: 0.3% of all households
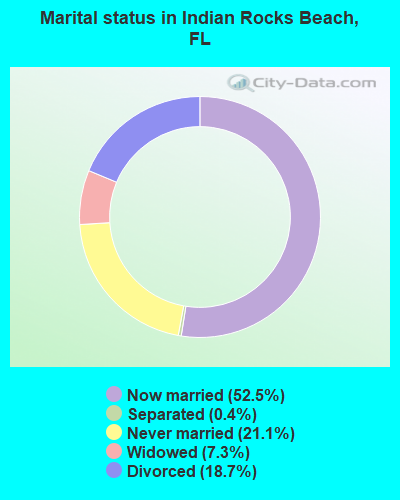
For population 15 years and over in Indian Rocks Beach:
Never married: 21.1%
Now married: 52.5%
Separated: 0.4%
Widowed: 7.3%
Divorced: 18.7%
For population 25 years and over in Indian Rocks Beach:
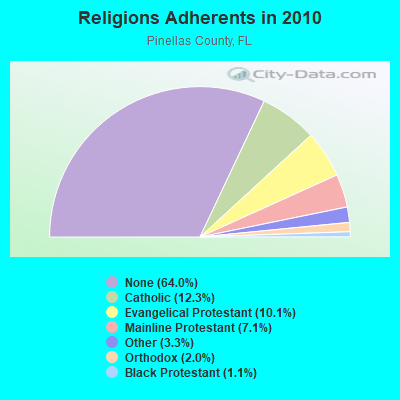
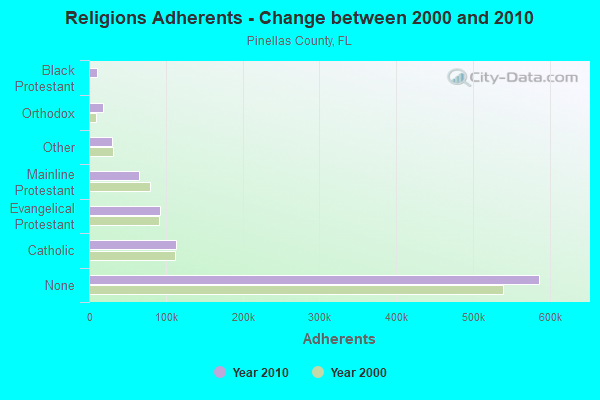
Religion statistics for Indian Rocks Beach, FL (based on Pinellas County data)
Religion
Adherents
Congregations
Catholic
112,948
33
Evangelical Protestant
93,022
324
Mainline Protestant
65,326
122
Other
30,563
85
Orthodox
18,285
14
Black Protestant
9,955
40
None
586,443
-
Source: Clifford Grammich, Kirk Hadaway, Richard Houseal, Dale E.Jones, Alexei Krindatch, Richie Stanley and Richard H.Taylor. 2012. 2010 U.S.Religion Census: Religious Congregations & Membership Study. Association of Statisticians of American Religious Bodies. Jones, Dale E., et al. 2002. Congregations and Membership in the United States 2000. Nashville, TN: Glenmary Research Center. Graphs represent county-level data
Aircraft: BEECH 95-B55 (T42A) (Category: Land, Engines: 2, Seats: 6, Weight: Up to 12,499 Pounds, Speed: 165 mph), Engine: CONT MOTOR I0-470 SERIES (260 HP) (Reciprocating) N-Number: 140WL, N140WL, N-140WL, Serial Number: TC-2231, Year manufactured: 1979, Airworthiness Date: 04/17/1979, Certificate Issue Date: 08/30/2006 Registrant (LLC): Morning Air LLC, 321 10th Ave, Indian Rocks Beach, FL 33785
Aircraft: DIAMOND AIRCRAFT IND INC DA 40 (Category: Land, Seats: 4, Weight: Up to 12,499 Pounds), Engine: LYCOMING IO-360-M1A+ (180 HP) (Reciprocating) N-Number: 446SB, N446SB, N-446SB, Serial Number: 40.488, Year manufactured: 2005, Airworthiness Date: 12/21/2016, Certificate Issue Date: 12/16/2016 Registrant (Individual): Steven B Cohen, 419 Harbor Dr S, Indian Rocks Beach, FL 33785
Home Mortgage Disclosure Act Aggregated Statistics For Year 2009 (Based on 1 full tract)
A) FHA, FSA/RHS & VA Home Purchase Loans
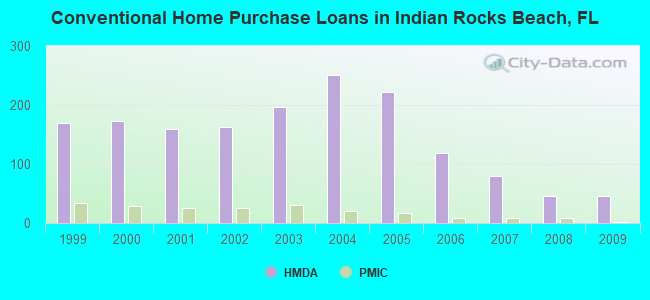
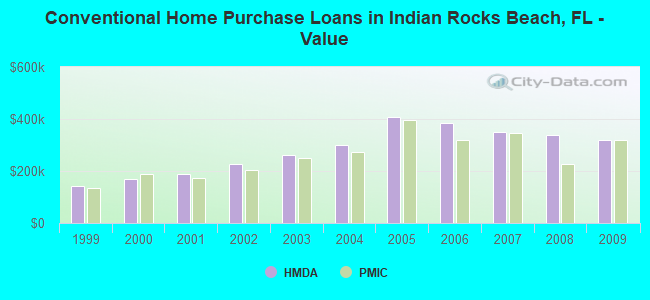
B) Conventional Home Purchase Loans
C) Refinancings
D) Home Improvement Loans
E) Loans on Dwellings For 5+ Families
F) Non-occupant Loans on < 5 Family Dwellings (A B C & D)
Number
Average Value
Number
Average Value
Number
Average Value
Number
Average Value
Number
Average Value
Number
Average Value
LOANS ORIGINATED
5
$191,600
46
$320,587
70
$255,271
2
$92,500
2
$1,032,500
41
$233,122
APPLICATIONS APPROVED, NOT ACCEPTED
0
$0
9
$295,778
12
$286,917
0
$0
0
$0
12
$305,583
APPLICATIONS DENIED
2
$321,500
25
$241,760
44
$237,023
2
$141,500
0
$0
38
$230,947
APPLICATIONS WITHDRAWN
2
$245,000
9
$431,667
33
$301,758
1
$417,000
1
$1,761,000
9
$290,111
FILES CLOSED FOR INCOMPLETENESS
2
$151,000
2
$312,000
11
$297,364
0
$0
0
$0
4
$208,750
Aggregated Statistics For Year 2008 (Based on 1 full tract)
A) FHA, FSA/RHS & VA Home Purchase Loans
B) Conventional Home Purchase Loans
C) Refinancings
D) Home Improvement Loans
E) Loans on Dwellings For 5+ Families
F) Non-occupant Loans on < 5 Family Dwellings (A B C & D)
Number
Average Value
Number
Average Value
Number
Average Value
Number
Average Value
Number
Average Value
Number
Average Value
LOANS ORIGINATED
2
$237,500
45
$336,800
48
$317,646
6
$124,833
0
$0
40
$379,575
APPLICATIONS APPROVED, NOT ACCEPTED
0
$0
6
$241,333
9
$252,444
0
$0
0
$0
4
$181,750
APPLICATIONS DENIED
2
$253,000
18
$330,111
49
$308,571
4
$232,750
0
$0
34
$286,647
APPLICATIONS WITHDRAWN
0
$0
19
$283,474
22
$387,591
2
$275,000
1
$975,000
12
$263,250
FILES CLOSED FOR INCOMPLETENESS
1
$298,000
3
$332,333
7
$383,857
0
$0
0
$0
3
$372,000
Aggregated Statistics For Year 2007 (Based on 1 full tract)
B) Conventional Home Purchase Loans
C) Refinancings
D) Home Improvement Loans
F) Non-occupant Loans on < 5 Family Dwellings (A B C & D)
G) Loans On Manufactured Home Dwelling (A B C & D)
Number
Average Value
Number
Average Value
Number
Average Value
Number
Average Value
Number
Average Value
LOANS ORIGINATED
79
$351,911
117
$402,487
16
$213,562
89
$399,708
0
$0
APPLICATIONS APPROVED, NOT ACCEPTED
16
$273,125
21
$235,429
2
$102,500
21
$249,143
1
$72,000
APPLICATIONS DENIED
30
$286,867
64
$395,250
5
$134,000
56
$328,000
0
$0
APPLICATIONS WITHDRAWN
8
$622,500
30
$388,000
1
$600,000
18
$399,611
0
$0
FILES CLOSED FOR INCOMPLETENESS
4
$616,750
10
$533,900
1
$252,000
3
$439,000
0
$0
Aggregated Statistics For Year 2006 (Based on 1 full tract)
B) Conventional Home Purchase Loans
C) Refinancings
D) Home Improvement Loans
E) Loans on Dwellings For 5+ Families
F) Non-occupant Loans on < 5 Family Dwellings (A B C & D)
G) Loans On Manufactured Home Dwelling (A B C & D)
Number
Average Value
Number
Average Value
Number
Average Value
Number
Average Value
Number
Average Value
Number
Average Value
LOANS ORIGINATED
118
$383,356
176
$346,165
19
$323,737
1
$1,450,000
126
$400,857
0
$0
APPLICATIONS APPROVED, NOT ACCEPTED
11
$332,636
40
$435,925
8
$190,500
0
$0
23
$443,783
0
$0
APPLICATIONS DENIED
38
$365,158
47
$506,596
4
$85,250
0
$0
35
$586,686
2
$39,500
APPLICATIONS WITHDRAWN
16
$339,500
35
$479,914
2
$75,000
0
$0
13
$678,769
0
$0
FILES CLOSED FOR INCOMPLETENESS
6
$427,667
17
$326,941
1
$150,000
0
$0
8
$375,000
0
$0
Aggregated Statistics For Year 2005 (Based on 1 full tract)
B) Conventional Home Purchase Loans
C) Refinancings
D) Home Improvement Loans
E) Loans on Dwellings For 5+ Families
F) Non-occupant Loans on < 5 Family Dwellings (A B C & D)
G) Loans On Manufactured Home Dwelling (A B C & D)
Number
Average Value
Number
Average Value
Number
Average Value
Number
Average Value
Number
Average Value
Number
Average Value
LOANS ORIGINATED
222
$406,158
181
$315,061
17
$187,882
2
$403,500
205
$382,717
0
$0
APPLICATIONS APPROVED, NOT ACCEPTED
24
$450,542
24
$280,292
3
$165,667
0
$0
22
$420,273
1
$48,000
APPLICATIONS DENIED
52
$405,712
66
$349,667
14
$165,786
1
$720,000
53
$371,755
3
$71,333
APPLICATIONS WITHDRAWN
23
$399,391
35
$274,457
3
$180,667
0
$0
18
$366,833
0
$0
FILES CLOSED FOR INCOMPLETENESS
10
$234,700
24
$306,458
0
$0
0
$0
8
$265,875
0
$0
Aggregated Statistics For Year 2004 (Based on 1 full tract)
B) Conventional Home Purchase Loans
C) Refinancings
D) Home Improvement Loans
E) Loans on Dwellings For 5+ Families
F) Non-occupant Loans on < 5 Family Dwellings (A B C & D)
G) Loans On Manufactured Home Dwelling (A B C & D)
Number
Average Value
Number
Average Value
Number
Average Value
Number
Average Value
Number
Average Value
Number
Average Value
LOANS ORIGINATED
251
$299,645
167
$228,844
12
$113,083
0
$0
199
$282,261
1
$76,000
APPLICATIONS APPROVED, NOT ACCEPTED
29
$326,724
19
$185,789
1
$50,000
0
$0
15
$255,667
2
$56,000
APPLICATIONS DENIED
51
$302,490
48
$241,271
11
$117,091
1
$150,000
43
$249,674
0
$0
APPLICATIONS WITHDRAWN
29
$354,655
33
$253,394
5
$77,400
2
$500,000
27
$275,259
0
$0
FILES CLOSED FOR INCOMPLETENESS
6
$205,833
16
$230,188
1
$400,000
0
$0
6
$300,667
0
$0
Aggregated Statistics For Year 2003 (Based on 1 full tract)
A) FHA, FSA/RHS & VA Home Purchase Loans
B) Conventional Home Purchase Loans
C) Refinancings
D) Home Improvement Loans
E) Loans on Dwellings For 5+ Families
F) Non-occupant Loans on < 5 Family Dwellings (A B C & D)
Number
Average Value
Number
Average Value
Number
Average Value
Number
Average Value
Number
Average Value
Number
Average Value
LOANS ORIGINATED
2
$180,500
197
$260,853
431
$184,148
10
$96,600
2
$2,520,500
223
$229,511
APPLICATIONS APPROVED, NOT ACCEPTED
0
$0
11
$278,273
57
$186,807
3
$108,667
0
$0
18
$167,111
APPLICATIONS DENIED
0
$0
28
$245,929
90
$229,322
6
$67,833
0
$0
44
$245,295
APPLICATIONS WITHDRAWN
0
$0
28
$289,214
49
$180,347
0
$0
0
$0
14
$195,857
FILES CLOSED FOR INCOMPLETENESS
0
$0
6
$140,833
11
$200,182
1
$15,000
0
$0
4
$173,000
Aggregated Statistics For Year 2002 (Based on 1 full tract)
B) Conventional Home Purchase Loans
C) Refinancings
D) Home Improvement Loans
E) Loans on Dwellings For 5+ Families
F) Non-occupant Loans on < 5 Family Dwellings (A B C & D)
Number
Average Value
Number
Average Value
Number
Average Value
Number
Average Value
Number
Average Value
LOANS ORIGINATED
162
$227,185
307
$179,831
19
$88,526
1
$200,000
154
$195,136
APPLICATIONS APPROVED, NOT ACCEPTED
13
$229,692
37
$180,595
1
$15,000
0
$0
16
$184,500
APPLICATIONS DENIED
25
$232,760
71
$179,085
10
$85,700
4
$1,012,750
20
$182,450
APPLICATIONS WITHDRAWN
15
$269,000
40
$140,800
2
$59,500
0
$0
7
$200,714
FILES CLOSED FOR INCOMPLETENESS
5
$273,000
17
$135,471
1
$12,000
0
$0
5
$200,000
Aggregated Statistics For Year 2001 (Based on 1 full tract)
A) FHA, FSA/RHS & VA Home Purchase Loans
B) Conventional Home Purchase Loans
C) Refinancings
D) Home Improvement Loans
E) Loans on Dwellings For 5+ Families
F) Non-occupant Loans on < 5 Family Dwellings (A B C & D)
Number
Average Value
Number
Average Value
Number
Average Value
Number
Average Value
Number
Average Value
Number
Average Value
LOANS ORIGINATED
5
$152,000
160
$187,856
230
$157,652
16
$42,688
2
$337,000
108
$171,046
APPLICATIONS APPROVED, NOT ACCEPTED
0
$0
10
$192,500
26
$164,538
4
$51,750
0
$0
9
$121,556
APPLICATIONS DENIED
1
$168,000
20
$204,700
66
$181,106
10
$25,000
0
$0
22
$169,727
APPLICATIONS WITHDRAWN
1
$195,000
11
$321,364
32
$174,281
4
$45,000
0
$0
6
$174,500
FILES CLOSED FOR INCOMPLETENESS
0
$0
5
$263,600
10
$225,700
1
$110,000
0
$0
3
$151,333
Aggregated Statistics For Year 2000 (Based on 1 full tract)
A) FHA, FSA/RHS & VA Home Purchase Loans
B) Conventional Home Purchase Loans
C) Refinancings
D) Home Improvement Loans
E) Loans on Dwellings For 5+ Families
F) Non-occupant Loans on < 5 Family Dwellings (A B C & D)
Number
Average Value
Number
Average Value
Number
Average Value
Number
Average Value
Number
Average Value
Number
Average Value
LOANS ORIGINATED
4
$74,500
173
$170,266
75
$120,773
14
$34,000
4
$318,750
80
$164,125
APPLICATIONS APPROVED, NOT ACCEPTED
0
$0
22
$186,909
14
$130,000
6
$74,167
0
$0
4
$250,250
APPLICATIONS DENIED
2
$120,500
32
$154,281
34
$139,059
8
$46,750
0
$0
22
$147,136
APPLICATIONS WITHDRAWN
0
$0
29
$179,759
22
$107,409
2
$114,500
2
$156,000
14
$156,429
FILES CLOSED FOR INCOMPLETENESS
1
$117,000
7
$154,000
4
$203,750
1
$15,000
0
$0
4
$188,250
Aggregated Statistics For Year 1999 (Based on 1 partial tract)
A) FHA, FSA/RHS & VA Home Purchase Loans
B) Conventional Home Purchase Loans
C) Refinancings
D) Home Improvement Loans
E) Loans on Dwellings For 5+ Families
F) Non-occupant Loans on < 5 Family Dwellings (A B C & D)


 Recent articles from our blog. Our writers, many of them Ph.D. graduates or candidates, create easy-to-read articles on a wide variety of topics.

 (4.4 miles