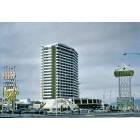
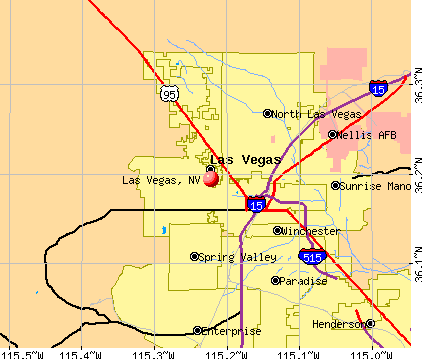
Las Vegas, Nevada

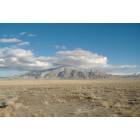
Las Vegas: This amazing picture was taken on Friday May 20, 2005 15 Miles SW of Vegas
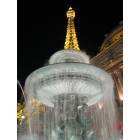
Las Vegas: "Paris, Las Vegas" by night.
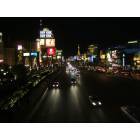
Las Vegas: Nightime in beautiful Las Vegas
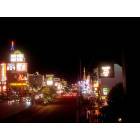
Las Vegas: vegas
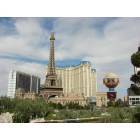
Las Vegas: Paris Hotel in Las Vegas
Las Vegas: The Dunes Hotel late 60's
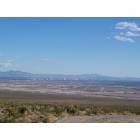
Las Vegas: Driving into las vegas!! 2005
Las Vegas: Looking South From Iron Mountain (sheep range) 8-19-05/5:37 am
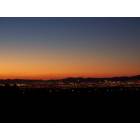
Las Vegas: Sunrise 2
Las Vegas: The Roller Coaster zooms through the hotel sign for the Sahara.
Las Vegas: View 5 from top of Rio Hotel June 07
- see
223
more - add
your
Submit your own pictures of this city and show them to the world
- OSM Map
- General Map
- Google Map
- MSN Map
Population change since 2000: +37.2%
| Males: 327,300 | |
| Females: 328,974 |
| Median resident age: | 38.6 years |
| Nevada median age: | 39.0 years |
Zip codes: 89030, 89101, 89102, 89104, 89106, 89107, 89108, 89109, 89110, 89117, 89128, 89129, 89130, 89131, 89134, 89135, 89138, 89143, 89144, 89145, 89146, 89149, 89166.
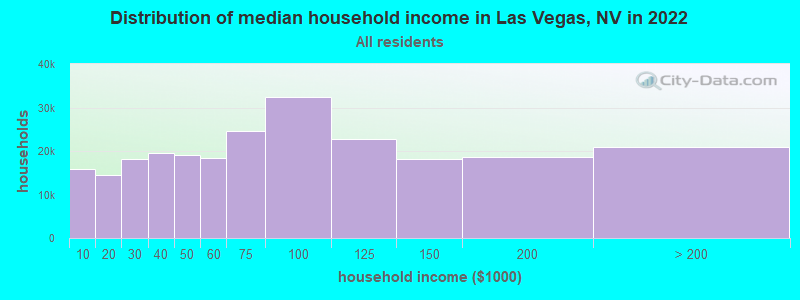
Las Vegas Zip Code Map| Las Vegas: | $68,905 |
| NV: | $72,333 |
Estimated per capita income in 2022: $36,962 (it was $22,060 in 2000)
Las Vegas city income, earnings, and wages data
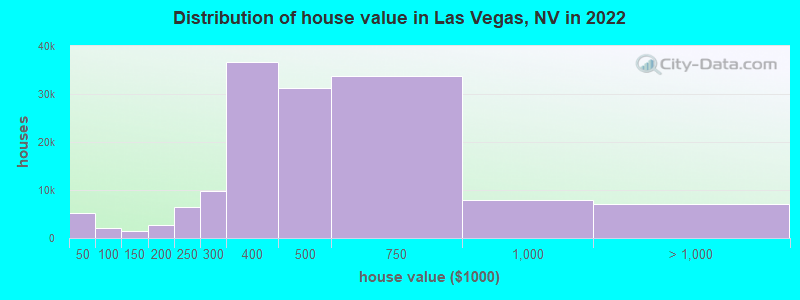
Estimated median house or condo value in 2022: $426,400 (it was $133,100 in 2000)
| Las Vegas: | $426,400 |
| NV: | $434,700 |
Mean prices in 2022: all housing units: $499,191; detached houses: $524,761; townhouses or other attached units: $347,246; in 2-unit structures: $211,862; in 3-to-4-unit structures: $253,432; in 5-or-more-unit structures: $442,523; mobile homes: $31,652
Median gross rent in 2022: $1,432.
(10.1% for White Non-Hispanic residents, 25.9% for Black residents, 14.8% for Hispanic or Latino residents, 23.4% for American Indian residents, 15.4% for Native Hawaiian and other Pacific Islander residents, 14.8% for other race residents, 13.5% for two or more races residents)
Detailed information about poverty and poor residents in Las Vegas, NV

Compare current foreclosures in Las Vegas, NV:
| Photo | Address | Area | Beds / Baths | Price | Details |
|---|---|---|---|---|---|

|
#1
Freedom Ave
Las Vegas, NV 89121
|
2,025 sq. feet
|
3 baths 2 beds |
$305,000
|
show details |

|
#2
Vida Pacifica St
Las Vegas, NV 89115
|
1,621 sq. feet
|
2 baths 4 beds |
$357,000
|
show details |

|
#3
Oro Silver Ct
Las Vegas, NV 89178
|
1,400 sq. feet
|
2 baths 2 beds |
$399,900
|
show details |

|
#4
Cape Verde Ln
Las Vegas, NV 89128
|
1,857 sq. feet
|
2 baths 4 beds |
$484,900
|
show details |

|
#5
Bel Air Dr Unit 24g
Las Vegas, NV 89109
|
2,208 sq. feet
|
3 baths 2 beds |
show details | |

|
#6
Red Gable Ln
Las Vegas, NV 89144
|
1,263 sq. feet
|
2 baths 2 beds |
show details | |

|
#7
Valley Dr
Las Vegas, NV 89108
|
2,263 sq. feet
|
2 baths 5 beds |
show details | |

|
#8
Meadow Foxtail Dr
Las Vegas, NV 89122
|
1,601 sq. feet
|
2 baths 2 beds |
show details | |

|
#9
Kathy Ct
Las Vegas, NV 89145
|
1,234 sq. feet
|
2 baths 2 beds |
show details | |

|
#10
Camp Bonanza Rd
Las Vegas, NV 89124
|
- sq. feet
|
2 baths 4 beds |
show details |
| Photo | Address | Area | Beds / Baths | Price | Details |
|---|---|---|---|---|---|

|
#11
W Oquendo Rd
Las Vegas, NV 89118
|
5,451 sq. feet
|
5 baths 7 beds |
show details | |

|
#12
Leor Ct
Las Vegas, NV 89121
|
2,024 sq. feet
|
3 baths 4 beds |
show details | |

|
#13
Gulls Perch Dr
Las Vegas, NV 89128
|
2,084 sq. feet
|
2 baths 4 beds |
show details | |

|
#14
Rancho Vista Dr
Las Vegas, NV 89106
|
2,067 sq. feet
|
2 baths 4 beds |
show details | |

|
#15
Seneca Dr
Las Vegas, NV 89169
|
1,640 sq. feet
|
4 baths 4 beds |
show details | |

|
#16
Keiser Ct
Las Vegas, NV 89134
|
1,493 sq. feet
|
2 baths 2 beds |
show details | |

|
#17
Innisbrook Ave
Las Vegas, NV 89113
|
11,354 sq. feet
|
7 baths 5 beds |
show details | |

|
#18
Laronda Ln
Las Vegas, NV 89156
|
1,196 sq. feet
|
2 baths 3 beds |
show details | |

|
#19
Betty Davis St
Las Vegas, NV 89142
|
1,418 sq. feet
|
2 baths 3 beds |
show details | |

|
#20
Clackamas Ct
Las Vegas, NV 89122
|
- sq. feet
|
1 baths 2 beds |
show details |
| Photo | Address | Area | Beds / Baths | Price | Details |
|---|---|---|---|---|---|

|
#21
N Buffalo Dr Apt 102
Las Vegas, NV 89128
|
912 sq. feet
|
2 baths 2 beds |
show details | |

|
#22
W Ford Ave
Las Vegas, NV 89139
|
2,453 sq. feet
|
2 baths 4 beds |
show details | |

|
#23
Flora Spray St
Las Vegas, NV 89130
|
2,219 sq. feet
|
3 baths 5 beds |
show details | |

|
#24
Jasmine Falls Dr
Las Vegas, NV 89179
|
1,685 sq. feet
|
3 baths 3 beds |
show details | |

|
#25
Califa Dr
Las Vegas, NV 89122
|
1,668 sq. feet
|
2 baths 3 beds |
show details | |

|
#26
Galliano Ave
Las Vegas, NV 89117
|
2,917 sq. feet
|
4 baths 4 beds |
show details | |

|
#27
Legato Falls St
Las Vegas, NV 89115
|
1,740 sq. feet
|
3 baths 3 beds |
show details | |

|
#28
Blue Nile Ct
Las Vegas, NV 89144
|
2,640 sq. feet
|
3 baths 3 beds |
show details | |

|
#29
Grouse Grove Ave
Las Vegas, NV 89148
|
2,493 sq. feet
|
2 baths 4 beds |
show details | |

|
#30
E Cleveland Ave
Las Vegas, NV 89104
|
2,136 sq. feet
|
2 baths 5 beds |
show details |
| Photo | Address | Area | Beds / Baths | Price | Details |
|---|---|---|---|---|---|

|
#31
Running Waters Ct
Las Vegas, NV 89123
|
2,257 sq. feet
|
2 baths 4 beds |
show details | |

|
#32
Ritter Ln
Las Vegas, NV 89118
|
1,265 sq. feet
|
2 baths 2 beds |
show details | |

|
#33
Royal Lake Ave
Las Vegas, NV 89131
|
1,684 sq. feet
|
3 baths 4 beds |
show details | |

|
#34
Monticello Dr
Las Vegas, NV 89107
|
988 sq. feet
|
2 baths 3 beds |
show details | |

|
#35
Balsam Mist Ave
Las Vegas, NV 89183
|
- sq. feet
|
2 baths 4 beds |
show details | |

|
#36
Alpine Bliss St
Las Vegas, NV 89123
|
1,562 sq. feet
|
2 baths 2 beds |
show details | |

|
#37
Lanai Ave
Las Vegas, NV 89104
|
1,583 sq. feet
|
1 baths 4 beds |
show details | |

|
#38
Groningen Ct
Las Vegas, NV 89131
|
1,681 sq. feet
|
2 baths 3 beds |
show details | |

|
#39
Heritage Ct
Las Vegas, NV 89121
|
- sq. feet
|
2 baths 4 beds |
show details | |

|
#40
Wengert Ave
Las Vegas, NV 89104
|
903 sq. feet
|
1 baths 2 beds |
show details |
| Photo | Address | Area | Beds / Baths | Price | Details |
|---|---|---|---|---|---|

|
#41
8112 Turbys Treehouse Pl
Las Vegas, NV 89131
|
3,002 sq. feet
|
3 baths 4 beds |
show details | |

|
#42
Desert Hills Dr
Las Vegas, NV 89117
|
2,080 sq. feet
|
2 baths 4 beds |
show details | |

|
#43
La Mata St
Las Vegas, NV 89108
|
1,754 sq. feet
|
2 baths 3 beds |
show details | |

|
#44
Blanton Dr
Las Vegas, NV 89122
|
1,301 sq. feet
|
2 baths 3 beds |
show details | |

|
#45
Bombay Reef Ct
Las Vegas, NV 89149
|
1,721 sq. feet
|
2 baths 4 beds |
show details | |

|
#46
High Valley Ct Unit 105
Las Vegas, NV 89128
|
1,008 sq. feet
|
2 baths 2 beds |
show details | |

|
#47
Shady Hill Ave
Las Vegas, NV 89106
|
1,096 sq. feet
|
2 baths 3 beds |
show details | |

|
#48
Figtree Rd
Las Vegas, NV 89108
|
1,339 sq. feet
|
2 baths 3 beds |
show details | |

|
#49
Nevada Sky St
Las Vegas, NV 89128
|
1,210 sq. feet
|
2 baths 2 beds |
show details | |

|
Check over 1 million property listings on Foreclosure.com!
|
browse all offers | |||


- 260,10139.6%White alone
- 223,92834.1%Hispanic
- 75,43511.5%Black alone
- 50,2777.7%Asian alone
- 38,0995.8%Two or more races
- 3,7370.6%Other race alone
- 3,3060.5%Native Hawaiian and Other
Pacific Islander alone - 1,4190.2%American Indian alone
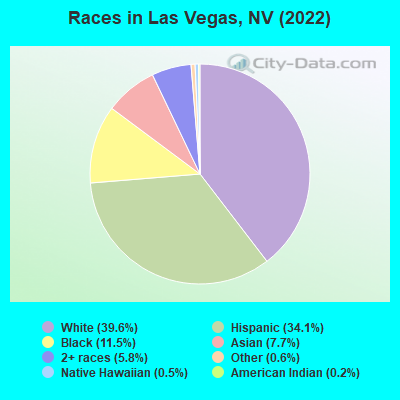
Races in Las Vegas detailed stats: ancestries, foreign born residents, place of birth
According to our research of Nevada and other state lists, there were 4,780 registered sex offenders living in Las Vegas, Nevada as of April 18, 2024.
The ratio of all residents to sex offenders in Las Vegas is 132 to 1.
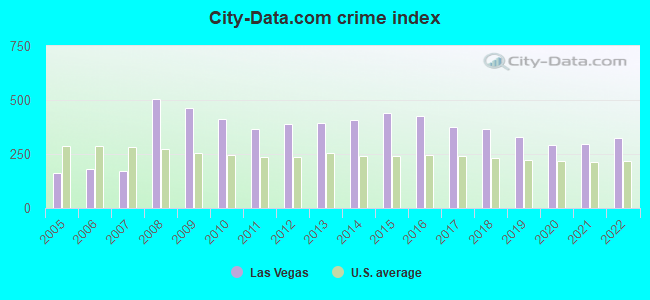
The City-Data.com crime index weighs serious crimes and violent crimes more heavily. Higher means more crime, U.S. average is 246.1. It adjusts for the number of visitors and daily workers commuting into cities.
- means the value is smaller than the state average.- means the value is about the same as the state average.
- means the value is bigger than the state average.
- means the value is much bigger than the state average.
Crime rate in Las Vegas detailed stats: murders, rapes, robberies, assaults, burglaries, thefts, arson
Full-time law enforcement employees in 2021, including police officers: 5,760 (3,994 officers - 3,412 male; 582 female).
| Officers per 1,000 residents here: | 2.37 |
| Nevada average: | 2.61 |
 Recent articles from our blog. Our writers, many of them Ph.D. graduates or candidates, create easy-to-read articles on a wide variety of topics.

 | Oakland A's moving to Las Vegas (159 replies) |
| Las Vegas Dining (29 replies) |
| Moving to Las Vegas. Tell me the Good and the Bad. (331 replies) |
| Is Las Vegas getting too expensive?... Is it time to look back at California? (442 replies) |
| Love las vegas! (28 replies) |
| 3 shot at Circus Circus Adventuredome; Las Vegas police say person of interest in custody (8 replies) |
Latest news from Las Vegas, NV collected exclusively by city-data.com from local newspapers, TV, and radio stations
Ancestries: English (4.0%), American (3.8%), German (3.5%), Irish (3.5%), Italian (3.5%), European (1.8%).
Current Local Time: PST time zone
Incorporated on 03/16/1911
Elevation: 2000 feet
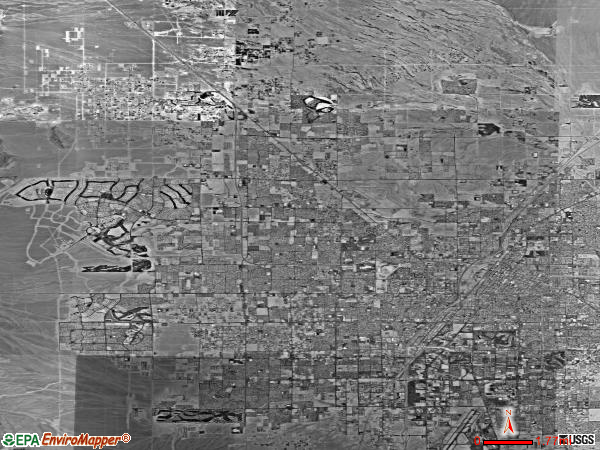
Land area: 113.3 square miles.
Population density: 5,792 people per square mile (average).
137,131 residents are foreign born (12.9% Latin America, 5.4% Asia).
| This city: | 20.7% |
| Nevada: | 19.1% |
Median real estate property taxes paid for housing units with mortgages in 2022: $1,858 (0.4%)
Median real estate property taxes paid for housing units with no mortgage in 2022: $2,008 (0.5%)
Nearest city with pop. 1,000,000+: Los Angeles, CA  (230.4 miles , pop. 3,694,820).
Nearest cities:
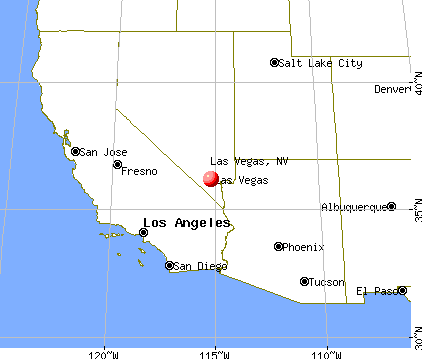
), ), )Latitude: 36.19 N, Longitude: 115.22 W
Daytime population change due to commuting: +59,306 (+9.0%)
Workers who live and work in this city: 161,111 (52.7%)
Area code: 702
Detailed articles:
- Las Vegas: Introduction
- Las Vegas Basic Facts
- Las Vegas: Communications
- Las Vegas: Convention Facilities
- Las Vegas: Economy
- Las Vegas: Education and Research
- Las Vegas: Geography and Climate
- Las Vegas: Health Care
- Las Vegas: History
- Las Vegas: Municipal Government
- Las Vegas: Population Profile
- Las Vegas: Recreation
- Las Vegas: Transportation
Las Vegas tourist attractions:
- Adventuredome - Las Vegas, NV - 5-Acre Indoor Theme Park
- American Racing Academy - Las Vegas, Nevada - High Performance Driving Lessons
- Las Vegas MGM Grand Hotel/Casino Continues to Grow
- Bally's Las Vegas
- The Bellagio Hotel and Casino, Las Vegas, Nevada; Jewel of the Desert
- Big Dig Adventure, Las Vegas
- Bonanza Gifts World's Largest Gift Shop, Las Vegas
- Caesar's Palace Classic Hotel, Las Vegas
- Cancun Resort, Las Vegas
- Cathedral Rock Trail - Las Vegas, Nevada - Moderate Climb to Spring Mountain Views
- Centaur Art Galleries - Las Vegas, Nevada - The City's Oldest Fine Art Gallery
- CityCenter Las Vegas - Las Vegas, Nevada - Urban Community on the Las Vegas Strip
- Cloud Nine Balloon - Las Vegas, Nevada - World's Largest Helium Balloon
- CompuSport Golf Training Academy - Las Vegas, Nevada - High-Tech Golf Instruction
- Coney Island Emporium - Las Vegas, Nevada - Popular Arcade and Midway Games
- Country Superstars Tribute - Las Vegas, Nevada - Live Country Music Show in Primm
- Cox Pavilion - Las Vegas, Nevada - Convention Venue on UNLV Campus
- Desert Rose Resort, Las Vegas
- Desert Rose Golf Course - Las Vegas, Nevada - Newly Renovated Municipal Golf Course
- Divine Nine - Las Vegas, Nevada - Challenging Nine-Hole Golf Course
- Doge's Palace - Las Vegas, Nevada - Replica of a Gothic-style Italian Landmark
- Donna Beam Fine Art Gallery - Las Vegas, Nevada - Art Management Venue at UNLV
- Don Yeyo Cigar Factory - Las Vegas, Nevada - Hand-Rolled Cigars Plus Accessories
- Eagle Crest Golf Club - Las Vegas, Nevada - Golf Course in Summerlin
- Elephant Rock - Las Vegas, Nevada - Truly ``Mammoth'' Red Sandstone Formation
- Encore at Wynn Las Vegas
- Etcetera - Las Vegas, Nevada - Antiques, Curios, Memorabilia, and More
- Evel Knievel Museum - Las Vegas, Nevada - Tribute to a Motorcycle Daredevil
- Exotics Racing School - Las Vegas, Nevada - Driving in High-Speed Luxury Cars
- Fast Lap Indoor Kart Racing, Las Vegas
- Flamingo Hotel and Casino, Las Vegas
- Flamingo Wedding Chapels - Las Vegas, Nevada - Hotel Offers Five Wedding Venues
- Flashlight - Las Vegas, Nevada - Campus Sculpture Symbolizing UNLV
- Floyd Lamb Park at Tule Springs - Las Vegas, Nevada - Day-Use Recreational Venue for Families
- Forum Shops at Caesar's Palace, Las Vegas
- Four Seasons Hotel, Las Vegas
- Fremont Street Experience, Las Vegas, NV
- Galerie Lassen - Las Vegas, Nevada - Showcase of Brightly Colored Marine Art
- Gallery of History - Las Vegas, Nevada - Leader in Autographs and Documents
- Gipsy - Las Vegas, Nevada - Long-Lived and Popular Gay/Lesbian Club
- Golden Nugget, Las Vegas
- Grandview at Las Vegas
- Grand Canyon South Rim Bus Tour - Las Vegas, Nevada - Visit to a True Natural Wonder
- Guardian Angel Cathedral - Las Vegas, Nevada - Offering Catholic Mass on the Strip
- Gypsum Cave - Las Vegas, Nevada - Ancient Aboriginal Dwelling Place
- Hard Rock Hotel and Casino, Las Vegas
- Harmon Theater - Las Vegas, Nevada - Comedy, Concerts, Magic, and More
- Harrah's Las Vegas Casino and Hotel
- Havana Cigar Bar - Las Vegas, Nevada - Cuban-Style Smoking, Drinking, and Music
- Hilton Grand Vacations Club Las Vegas Strip
- Hoover Dam In Las Vegas, Nevada
- Imperial Palace Auto Collection, Las Vegas
- Jockey Club, Las Vegas
- JW Marriott Las Vegas Resort, Spa and Golf
- Kids Quest, Las Vegas
- Las Vegas Hilton
- Las Vegas Mini Gran Prix Family Fun Center, Las Vegas
- Las Vegas Monorail, Las Vegas
- Las Vegas Motor Speedway, Las Vegas
- Las Vegas Natural History Museum, Las Vegas
- Las Vegas Paiute Golf Resort, Las Vegas
- LDS Las Vegas Nevada Temple - Las Vegas, Nevada - Focal Point for Local Mormon Church
- Mandalay Bay Wedding Chapels, Las Vegas
- Meridian Luxury Suites
- MGM Grand Arena, Las Vegas
- Mirage Hotel and Casino, Las Vegas
- Monte Carlo Resort & Casino, Las Vegas
- Mount Charleston, Las Vegas, NV
- NASCAR Cafy -- Las Vegas, Nevada - Eatery and Interactive Entertainment Center
- New York New York Hotel and Casino, Las Vegas
- Vdara Hotel & Spa
- Las Vegas Wedding Chapel
- O Spa at TI
- Vinnie Favorito
- Viva Elvis
- Viva Las Vegas Wedding Chapel
- Walker African American Museum
- Wayne Newton
- Wedding Chapel at Monte Carlo
- Wedding Chapel at the Rio
- Weddings at the Venetian
- Wee Kirk O' the Heather Wedding Chapel
- Wet Republic
- White Tiger Habitat at the Mirage
- Willow Spring
- Wine Cellar Tasting Room
- Zumanity - Cirque du Soleil
- Four Seasons Hotel Las Vegas
- Christian Audigier the Nightclub
- Reliquary Spa
- Riviera Royale Wedding Chapel & Florist Shoppe
- Royal Links Golf Club
- Sagebrush Ranch
- Sandou Theatrical Circus School
- The Palazzo Resort Hotel Casino
- Shalimar Wedding Chapel
- Shark Reef
- Showcase Mall
- Siena Golf Club
- Silverstone Golf Club
- Vegas Vic
- Silverton Aquarium
- Smallworks Gallery
- Southern Highlands Golf Club
- Spring Mountain Ranch State Park
- Stained Glass Chapel
- Stratosphere Theater of the Stars
- Sun Mountain
- Sunrise Vista Golf Course
- Sunset Park
- Sunset Stampede at Sam's Town
- Superstars of Magic
- The Amazing Johnathan
- The Arts Factory
- The Colosseum at Caesars Palace
- The Elvis Chapel
- The Las Vegas Eagle
- The Neon Museum
- The Price is Right Game Show
- The Shoppes at the Palazzo
- The Sirens of TI
- Mandarin Oriental Las Vegas
- The Spa at Bally's
- Toiyabe National Forest
- TPC Summerlin
- TPC at the Canyons
- Treasure Island Wedding Chapel
- Tropicana Island Wedding Chapel
- PURE Nightclub
- Red Rock Casino
- Riviera Comedy Club
- Sam Boyd Stadium
- Sands Expo and Convention Center
- Palms Place Hotel Spa
- Aria Hotel and Casino
- Polo Towers
- Planet Hollywood Towers
- Orleans Arena, Las Vegas, Nevada
- State of the Art Luxury at Palazzo Hotel/Casino in Las Vegas Soon to be Available Year Round in Neighboring Condo Tower
- Paris Las Vegas Hotel
- Pinball Hall of Fame, Las Vegas, NV
- Planet Hollywood Resort and Casino, Las Vegas
- Platinum Hotel and Spa, Las Vegas
- Red Rock Canyon National Conservation Area, Las Vegas, NV
- Red Rock Casino Resort and Spa, Las Vegas
- Renaissance Las Vegas Hotel
- Rhodes Ranch Golf Club, Las Vegas
- The Richard Petty Driving Experience, Las Vegas
- Rio Suite Hotel and Casino, Las Vegas
- Riviera Hotel & Casino, Las Vegas
- Shark Reef at Mandalay Bay - Las Vegas Nevada - small private aquarium featuring sharks
- Siegfried and Roy's Secret Garden and Dolphin Habitat
- Signature at MGM Grand, Las Vegas
- Spring Preserve Las Vegas
- Stratosphere Tower - Las Vegas, Nevada - Landmark Tower Portion of the Stratosphere Hotel and Casino
- Tahiti Village, Las Vegas
- Texas Station Casino - N. Las Vegas, Nevada - Hotel and Casino
- The Hotel at Mandalay Bay, Las Vegas
- The Palms Casino Hotel, Las Vegas
- The Strip in Las Vegas, Las Vegas
- The Westin Casuarina Las Vegas Hotel, Casino and Spa
- Trump International Hotel & Tower, Las Vegas
- Tuscany Suites & Casino, Las Vegas
- Vegas Indoor Skydiving, Las Vegas
- Venetian Hotel, Casino and Las Vegas, Nevada Style Luxury
- Wyndham Grand Desert, Las Vegas
- Wynn Golf Club - Las Vegas, Nevada - Former Desert Inn Golf Course Reborn
- The Wynn Hotel And Casino In Las Vegas, Nevada
Las Vegas, Nevada accommodation & food services, waste management - Economy and Business Data
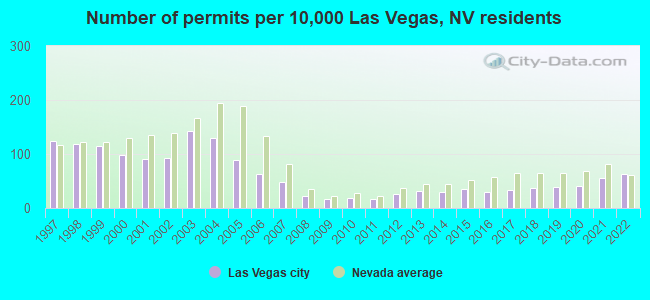
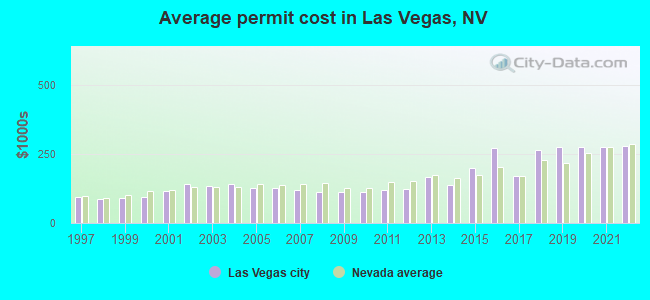
Single-family new house construction building permits:
- 2022: 3001 buildings, average cost: $280,800
- 2021: 2700 buildings, average cost: $275,000
- 2020: 1941 buildings, average cost: $277,800
- 2019: 1885 buildings, average cost: $274,600
- 2018: 1794 buildings, average cost: $263,600
- 2017: 1605 buildings, average cost: $172,400
- 2016: 1454 buildings, average cost: $271,900
- 2015: 1662 buildings, average cost: $198,900
- 2014: 1453 buildings, average cost: $139,200
- 2013: 1517 buildings, average cost: $166,800
- 2012: 1233 buildings, average cost: $121,500
- 2011: 814 buildings, average cost: $121,300
- 2010: 926 buildings, average cost: $111,800
- 2009: 744 buildings, average cost: $112,700
- 2008: 1085 buildings, average cost: $111,300
- 2007: 2356 buildings, average cost: $120,500
- 2006: 2998 buildings, average cost: $128,900
- 2005: 4271 buildings, average cost: $128,800
- 2004: 6200 buildings, average cost: $140,300
- 2003: 6861 buildings, average cost: $134,100
- 2002: 4454 buildings, average cost: $139,600
- 2001: 4295 buildings, average cost: $117,100
- 2000: 4750 buildings, average cost: $95,500
- 1999: 5472 buildings, average cost: $90,300
- 1998: 5687 buildings, average cost: $87,700
- 1997: 5911 buildings, average cost: $93,100
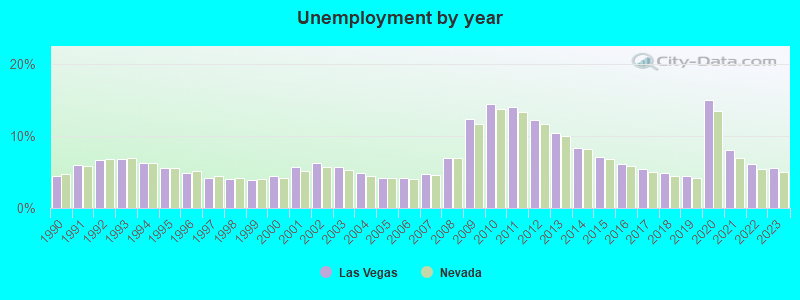
| Here: | 5.5% |
| Nevada: | 5.0% |
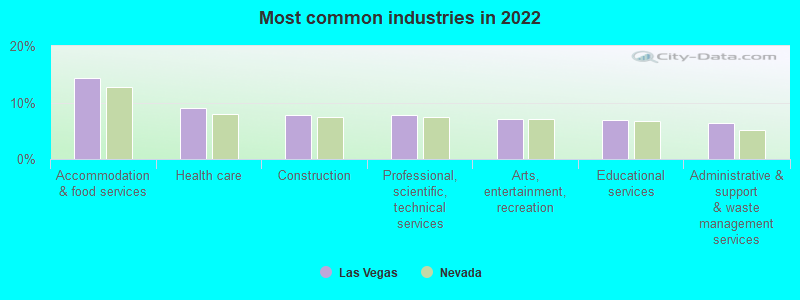
- Accommodation & food services (14.3%)
- Health care (9.0%)
- Construction (7.9%)
- Professional, scientific, technical services (7.7%)
- Arts, entertainment, recreation (7.0%)
- Educational services (7.0%)
- Administrative & support & waste management services (6.3%)
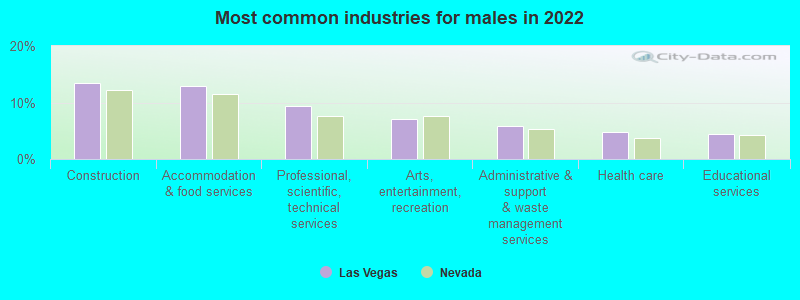
- Construction (13.4%)
- Accommodation & food services (13.0%)
- Professional, scientific, technical services (9.4%)
- Arts, entertainment, recreation (7.0%)
- Administrative & support & waste management services (5.9%)
- Health care (4.8%)
- Educational services (4.5%)
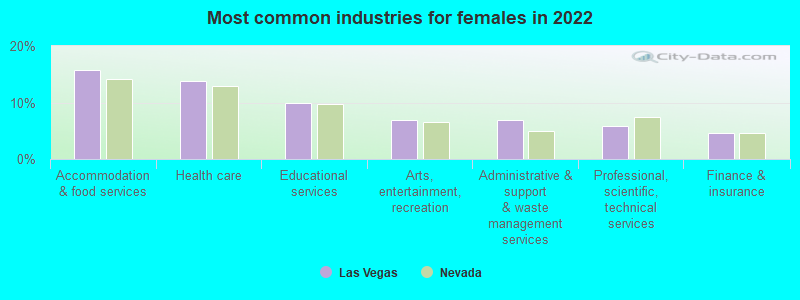
- Accommodation & food services (15.7%)
- Health care (13.8%)
- Educational services (9.8%)
- Arts, entertainment, recreation (7.0%)
- Administrative & support & waste management services (6.8%)
- Professional, scientific, technical services (5.8%)
- Finance & insurance (4.6%)
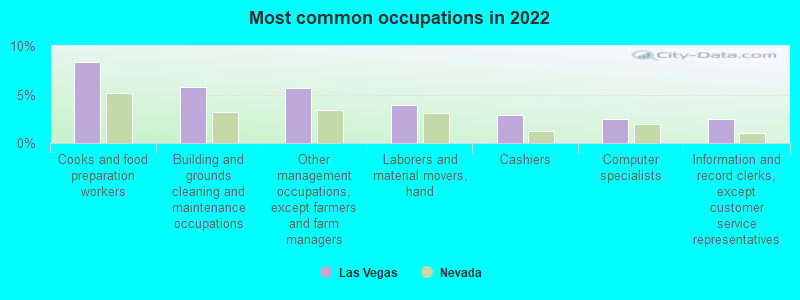
- Cooks and food preparation workers (8.4%)
- Building and grounds cleaning and maintenance occupations (5.8%)
- Other management occupations, except farmers and farm managers (5.7%)
- Laborers and material movers, hand (3.9%)
- Cashiers (2.9%)
- Computer specialists (2.5%)
- Information and record clerks, except customer service representatives (2.5%)
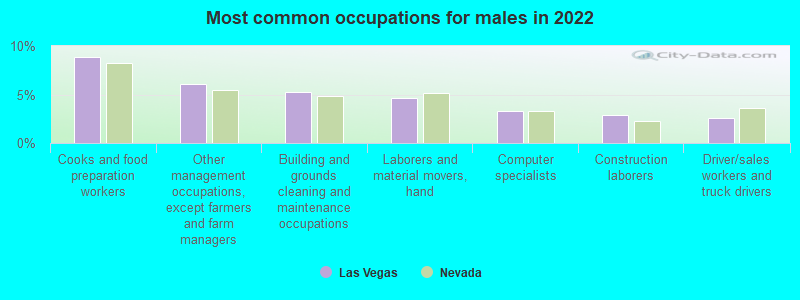
- Cooks and food preparation workers (8.9%)
- Other management occupations, except farmers and farm managers (6.1%)
- Building and grounds cleaning and maintenance occupations (5.3%)
- Laborers and material movers, hand (4.6%)
- Computer specialists (3.3%)
- Construction laborers (2.9%)
- Driver/sales workers and truck drivers (2.6%)
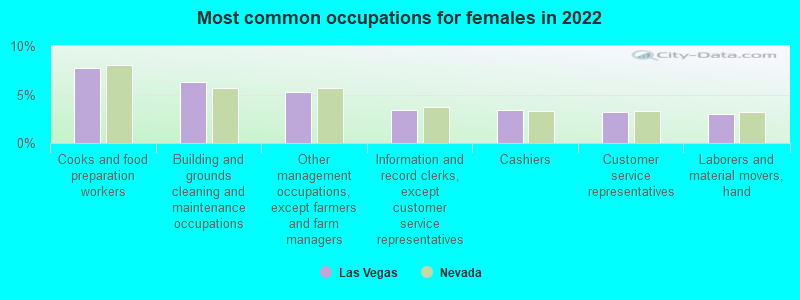
- Cooks and food preparation workers (7.8%)
- Building and grounds cleaning and maintenance occupations (6.3%)
- Other management occupations, except farmers and farm managers (5.2%)
- Information and record clerks, except customer service representatives (3.4%)
- Cashiers (3.4%)
- Customer service representatives (3.2%)
- Laborers and material movers, hand (3.0%)
Average climate in Las Vegas, Nevada
Based on data reported by over 4,000 weather stations


|
|

(lower is better)
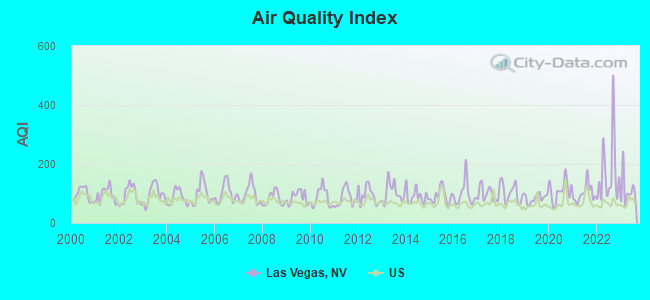
Air Quality Index (AQI) level in 2023 was 112. This is significantly worse than average.
| City: | 112 |
| U.S.: | 73 |
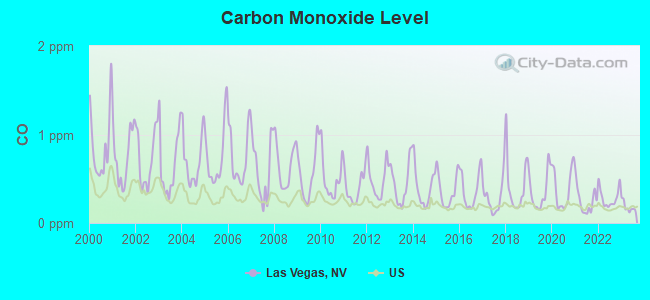
Carbon Monoxide (CO) [ppm] level in 2023 was 0.182. This is better than average. Closest monitor was 3.9 miles away from the city center.
| City: | 0.182 |
| U.S.: | 0.251 |
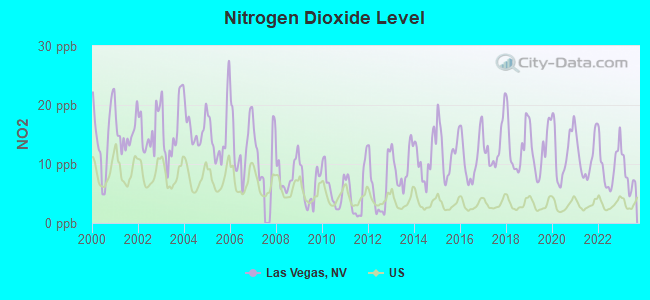
Nitrogen Dioxide (NO2) [ppb] level in 2023 was 7.84. This is significantly worse than average. Closest monitor was 3.9 miles away from the city center.
| City: | 7.84 |
| U.S.: | 5.11 |
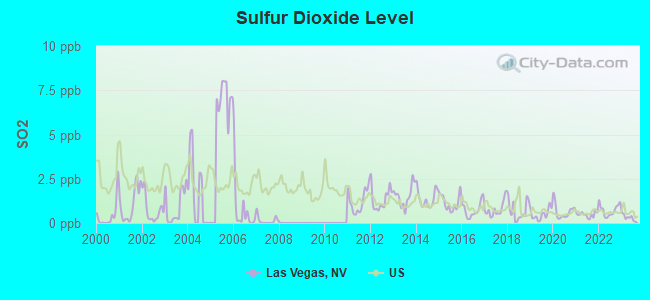
Sulfur Dioxide (SO2) [ppb] level in 2023 was 0.318. This is significantly better than average. Closest monitor was 6.7 miles away from the city center.
| City: | 0.318 |
| U.S.: | 1.515 |
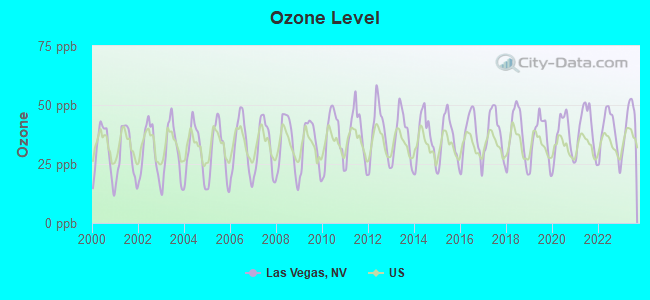
Ozone [ppb] level in 2023 was 42.9. This is worse than average. Closest monitor was 2.8 miles away from the city center.
| City: | 42.9 |
| U.S.: | 33.3 |
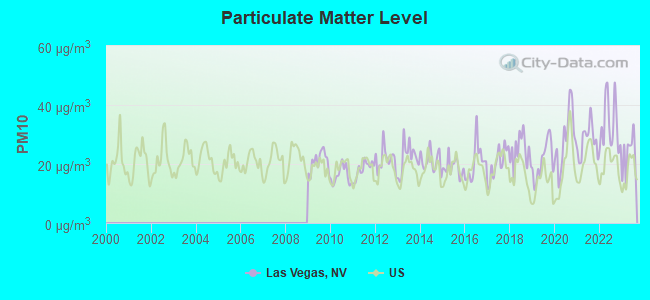
Particulate Matter (PM10) [µg/m3] level in 2023 was 23.4. This is worse than average. Closest monitor was 2.8 miles away from the city center.
| City: | 23.4 |
| U.S.: | 19.2 |
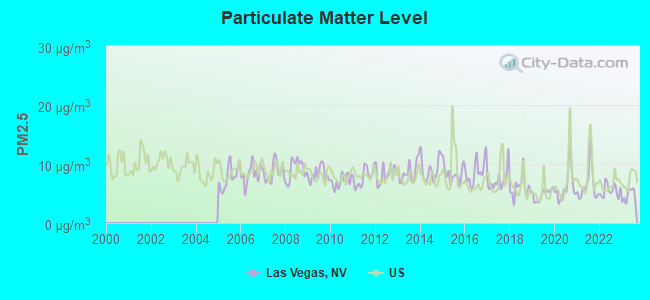
Particulate Matter (PM2.5) [µg/m3] level in 2023 was 4.64. This is significantly better than average. Closest monitor was 2.8 miles away from the city center.
| City: | 4.64 |
| U.S.: | 8.11 |
Earthquake activity:
Las Vegas-area historical earthquake activity is significantly above Nevada state average. It is 5993% greater than the overall U.S. average.On 6/28/1992 at 11:57:34, a magnitude 7.6 (6.2 MB, 7.6 MS, 7.3 MW, Depth: 0.7 mi, Class: Major, Intensity: VIII - XII) earthquake occurred 157.5 miles away from the city center, causing 3 deaths (1 shaking deaths, 2 other deaths) and 400 injuries, causing $100,000,000 total damage and $40,000,000 insured losses
On 10/16/1999 at 09:46:44, a magnitude 7.4 (6.3 MB, 7.4 MS, 7.2 MW, 7.3 ML) earthquake occurred 134.8 miles away from the city center
On 7/21/1952 at 11:52:14, a magnitude 7.7 (7.7 UK) earthquake occurred 227.9 miles away from Las Vegas center, causing $50,000,000 total damage
On 5/19/1940 at 04:36:40, a magnitude 7.2 (7.2 UK) earthquake occurred 207.3 miles away from the city center, causing $33,000,000 total damage
On 12/21/1932 at 06:10:09, a magnitude 7.2 (7.2 UK) earthquake occurred 224.5 miles away from the city center
On 6/28/1992 at 15:05:30, a magnitude 6.9 (6.3 MB, 6.7 MS, 6.5 MW, 6.9 ME, Depth: 3.1 mi, Class: Strong, Intensity: VII - IX) earthquake occurred 159.6 miles away from the city center
Magnitude types: body-wave magnitude (MB), energy magnitude (ME), local magnitude (ML), surface-wave magnitude (MS), moment magnitude (MW)
Natural disasters:
The number of natural disasters in Clark County (12) is smaller than the US average (15).Major Disasters (Presidential) Declared: 4
Emergencies Declared: 3
Causes of natural disasters: Fires: 4, Floods: 3, Heavy Rains: 2, Snows: 2, Storms: 2, Flash Flood: 1, Hurricane: 1, Other: 1 (Note: some incidents may be assigned to more than one category).
Main business address for: Community Bancorp (NATIONAL COMMERCIAL BANKS), LAS VEGAS SANDS CORP (HOTELS & MOTELS), SOUTHWEST GAS CORP (NATURAL GAS TRANSMISSION & DISTRIBUTION), PINNACLE ENTERTAINMENT INC (SERVICES-MISCELLANEOUS AMUSEMENT & RECREATION), American Casino & Entertainment Properties LLC (SERVICES-MISCELLANEOUS AMUSEMENT & RECREATION), Global Cash Access, Inc. (FINANCE SERVICES), Valley Bancorp (COMMERCIAL BANKS, NEC), TOUCHTUNES MUSIC CORP (HOUSEHOLD AUDIO & VIDEO EQUIPMENT) and 49 other public companies.
Hospitals in Las Vegas:
- CENTENNIAL HILLS HOSPITAL MEDICAL CENTER (Voluntary non-profit - Private, provides emergency services, 6900 N DURANGO DR)
- DANVILLE SERVICES OF NEVADA, LLC (115 E SHELBOURNE AVE)
- DESERT DEVELOPMENTAL CENTER (1391 S. JONES BLVD)
- FLAMINGO SURGERY CENTER (2565 EAST FLAMINGO ROAD)
- HORIZON SPECIALTY HOSPITAL (640 DESERT LANE)
- MONTEVISTA HOSPITAL, INC (5900 W ROCHELLE AVE)
- OPTION CARE HOSPICE (3900 WEST CHARLESTON BLVD SUITE Y1)
- SOUTHERN HILLS HOSPITAL AND MEDICAL CENTER (Voluntary non-profit - Private, 9300 WEST SUNSET RD)
- ST ROSE DOMINICAN HOSPITALS - SAN MARTIN CAMPUS (Voluntary non-profit - Church, 8280 W WARM SPRINGS ROAD)
- UMC OF SOUTHERN NEVADA (Government - Local, 1800 W CHARLESTON BLVD)
- WOMENS HOSPITAL (2025 EAST SAHARA AVENUE)
Airports and heliports located in Las Vegas:
- Mc Carran International Airport (LAS) (Runways: 4, Commercial Ops: 340,174, Air Taxi Ops: 127,772, Itinerant Ops: 42,420, Local Ops: 10,605, Military Ops: 1,427)
- North Las Vegas Airport (VGT) (Runways: 3, Commercial Ops: 7, Air Taxi Ops: 5,492, Itinerant Ops: 57,944, Local Ops: 70,880, Military Ops: 1,311)
- Henderson Executive Airport (HND) (Runways: 2, Air Taxi Ops: 9,644, Itinerant Ops: 39,672, Local Ops: 21,803, Military Ops: 204)
- Nellis Afb Airport (LSV) (Runways: 2, Military Ops: 32,400)
- Heliports: 12
Biggest Colleges/Universities in Las Vegas:
- University of Nevada-Las Vegas (Full-time enrollment: 21,153; Location: 4505 S Maryland Pky; Public; Website: go.unlv.edu/; Offers Doctor's degree)
- College of Southern Nevada (Full-time enrollment: 18,996; Location: 6375 W. Charleston Blvd.; Public; Website: www.csn.edu)
- University of Phoenix-Las Vegas Campus (Full-time enrollment: 1,822; Location: 3755 Breakthrough Way; Private, for-profit; Website: www.phoenix.edu; Offers Master's degree)
- Pima Medical Institute-Las Vegas (Full-time enrollment: 1,648; Location: 3333 East Flamingo Road; Private, for-profit; Website: pmi.edu)
- Kaplan College-Las Vegas (Full-time enrollment: 1,495; Location: 3535 W. Sahara Avenue; Private, for-profit; Website: www.kaplancollege.com/las-vegas-nv/)
- Le Cordon Bleu College of Culinary Arts-Las Vegas (Full-time enrollment: 900; Location: 1451 Center Crossing Road; Private, for-profit; Website: www.chefs.edu/las-vegas)
- Anthem Institute-Las Vegas (Full-time enrollment: 803; Location: 2320 S Rancho Drive 1st Floor; Private, for-profit; Website: www.anthem.edu)
- Marinello Schools of Beauty-Las Vegas (Full-time enrollment: 612; Location: 5001 East Bonanza Ste 110; Private, for-profit; Website: www.marinello.com)
- Milan Institute-Las Vegas (Full-time enrollment: 489; Location: 710 South Tonopah; Private, for-profit; Website: www.milaninstitute.edu)
- Paul Mitchell the School-Las Vegas (Full-time enrollment: 337; Location: 9490 South Eastern Avenue, Suite 100; Private, for-profit; Website: lasvegas.paulmitchell.edu/)
- Nevada Career Institute (Full-time enrollment: 335; Location: 3231 North Decatur Boulevard Suites 119; Private, for-profit; Website: www.nevadacareerinstitute.com)
- Utah College of Massage Therapy-Vegas (Full-time enrollment: 271; Location: 2381 East Windmill Lane, Suite 14; Private, for-profit; Website: www.steinered.com/)
- Euphoria Institute of Beauty Arts & Sciences-Las Vegas (Full-time enrollment: 264; Location: 6578 North Decatur Blvd. #200; Private, for-profit; Website: www.lincolnedu.com/campus/north-las-vegas-aliante-nv)
- Euphoria Institute of Beauty Arts & Sciences-Summerlin (Full-time enrollment: 243; Location: 9340 W. Sahara Ave Ste. 205; Private, for-profit; Website: www.euphoriainstitute.com)
- Carrington College-Las Vegas (Full-time enrollment: 237; Location: 5740 South Eastern Ave., Ste. 140; Private, for-profit; Website: www.carrington.edu)
- Academy of Hair Design-Las Vegas (Full-time enrollment: 212; Location: 5191 W. Charleston, #150; Private, for-profit; Website: www.ahdvegas.com/)
- Advanced Training Institute (Full-time enrollment: 166; Location: 5150 S. Decatur Blvd.; Private, for-profit; Website: www.atitraining.com)
- Northwest Career College (Full-time enrollment: 153; Location: 7398 Smoke Ranch Road, Ste 100; Private, for-profit; Website: northwesthealthcareers.com)
- Casal Institute of Nevada (Full-time enrollment: 135; Location: 4856 S Eastern Ave; Private, for-profit; Website: www.avedalasvegas.com)
- Destination Academy for Spa and Salon Professionals (Full-time enrollment: 121; Location: 4280 South Hualapai Way; Private, for-profit; Website: www.destinationacademy.com)
Other colleges/universities with over 2000 students near Las Vegas:
- Nevada State College (about 22 miles; Henderson, NV; Full-time enrollment: 2,346)
- Mohave Community College (about 93 miles; Kingman, AZ; FT enrollment: 3,309)
- Dixie State University (about 112 miles; Saint George, UT; FT enrollment: 6,485)
- Barstow Community College (about 137 miles; Barstow, CA; FT enrollment: 2,120)
- Cerro Coso Community College (about 144 miles; Ridgecrest, CA; FT enrollment: 2,420)
- Southern Utah University (about 157 miles; Cedar City, UT; FT enrollment: 6,522)
- Victor Valley College (about 166 miles; Victorville, CA; FT enrollment: 7,630)
Biggest public high schools in Las Vegas:
- NEVADA VIRTUAL ACADEMY (Location: 8965 S. EASTERN AVE STE 330, Grades: KG-12, Charter school)
- CORAL ACADEMY OF SCIENCE LAS VEGAS (Location: 8185 TAMARUS STREET, Grades: KG-12, Charter school)
- BEACON ACADEMY OF NEVADA (Location: 7360 W. FLAMINGO ROAD, Grades: 9-12, Charter school)
- QUEST ACADEMY (Location: 6610 GRAND MONTECITO PKWY, Grades: KG-12, Charter school)
- LEADERSHIP ACADEMY OF NEVADA (Location: 7495 W. AZURE DRIVE, Grades: 6-12, Charter school)
- FOUNDERS ACADEMY OF LAS VEGAS (Location: 4025 N. RANCHO DRIV, Grades: KG-12, Charter school)
- AMERICAN PREP ACADEMY (Location: 6000 WEST OAKE, Grades: KG-9, Charter school)
- BONANZA HIGH SCHOOL (Location: 6665 W. DEL REY AVE., Grades: 9-12)
- CHAPARRAL HIGH SCHOOL (Location: 3850 ANNIE OAKLEY DR., Grades: 9-12)
- JUVENILE DETENTION (Location: 601 N. PECOS #70, Grades: 6-12)
Biggest private high schools in Las Vegas:
- FAITH LUTHERAN JR/SR HIGH SCHOOL (Students: 1,366, Location: 2015 S HUALAPAI WAY, Grades: 6-12)
- BISHOP GORMAN HIGH SCHOOL (Students: 1,264, Location: 5959 S HUALAPAI WAY, Grades: 9-12)
- THE MEADOWS SCHOOL (Students: 896, Location: 8601 SCHOLAR LN, Grades: PK-12)
- CALVARY CHAPEL CHRISTIAN SCHOOL (Students: 571, Location: 7175 W OQUENDO RD, Grades: KG-12)
- DR MIRIAM & SHELDON G ADELSON EDUCATIONAL CAMPUS (Students: 492, Location: 9700 HILLPOINTE RD, Grades: PK-12)
- WORD OF LIFE CHRISTIAN ACADEMY (Students: 252, Location: 3520 N BUFFALO DR, Grades: PK-12)
- OASIS BAPTIST CHURCH (Students: 161, Location: 5220 E RUSSELL RD, Grades: PK-12)
- LIBERTY BAPTIST ACADEMY (Students: 156, Location: 6501 W LAKE MEAD BLVD, Grades: KG-12)
- AMERICAN HERITAGE ACADEMY (Students: 129, Location: 6126 S SANDHILL RD STE C, Grades: PK-11)
- LAS VEGAS JUNIOR ACADEMY (Students: 109, Location: 6059 W OAKEY BLVD, Grades: PK-9)
Biggest public elementary/middle schools in Las Vegas:
- DISCOVERY CHARTER SCHOOL (Location: 3883 E MESA VISTA AVE, Grades: KG-8, Charter school)
- IMAGINE SCHOOL MOUNTAIN VIEW (Location: 7885 W ROCHELLE AVE, Grades: KG-5, Charter school)
- DORAL ACADEMY (Location: 9625 WEST SADDLE AVE, Grades: KG-8, Charter school)
- MATER ACADEMY OF NEVADA (Location: 2525 EMERSON AVENUE, Grades: KG-8, Charter school)
- BERTHA RONZONE ELEMENTARY SCHOOL (Location: 5701 STACEY AVE., Grades: PK-5)
- BILL Y TOMIYASU ELEMENTARY SCHOOL (Location: 5445 S. ANNIE OAKLEY DR., Grades: PK-5)
- C C RONNOW ELEMENTARY SCHOOL (Location: 1100 LENA ST., Grades: PK-5)
- C W WOODBURY MIDDLE SCHOOL (Location: 3875 E. HARMON AVE., Grades: 6-8)
- C H DECKER ELEMENTARY SCHOOL (Location: 3850 S. REDWOOD, Grades: KG-5)
- CRESTWOOD ELEMENTARY SCHOOL (Location: 1300 PAULINE WAY, Grades: PK-5)
Biggest private elementary/middle schools in Las Vegas:
- LAS VEGAS DAY SCHOOL (Students: 926, Location: 3275 RED ROCK ST, Grades: PK-8)
- ST VIATOR CATHOLIC SCHOOL (Students: 674, Location: 4246 S EASTERN AVE, Grades: PK-8)
- OUR LADY OF LAS VEGAS SCHOOL (Students: 651, Location: 3046 ALTA DR, Grades: PK-8)
- ALEXANDER DAWSON SCHOOL (Students: 588, Location: 10845 W DESERT INN RD, Grades: PK-8)
- ST ELIZABETH ANN SETON CATHOLIC SCHOOL (Students: 481, Location: 1807 PUEBLO VISTA DR, Grades: KG-8)
- CORNERSTONE CHRISTIAN ACADEMY (Students: 425, Location: 5825 ELDORA AVE, Grades: KG-8)
- LAMB OF GOD LUTHERAN SCHOOL (Students: 328, Location: 6232 N JONES BLVD, Grades: PK-5)
- ST FRANCIS DE SALES SCHOOL (Students: 296, Location: 1111 N MICHAEL WAY, Grades: KG-8)
- FAITH LUTHERAN ACADEMY (Students: 289, Location: 2700 S TOWN CENTER DR, Grades: KG-5)
- ST ANNE CATHOLIC SCHOOL (Students: 282, Location: 1813 S MARYLAND PKWY, Grades: PK-8)
Library in Las Vegas:
User-submitted facts and corrections:
- there is a north las vegas radio station called passadena fm added by jon
- Please edit school name: change The Hebrew Academy to The Milton I Schwartz Hebrew Academy
Points of interest:
Notable locations in Las Vegas: Tule Springs (A), Tule Springs Ranch (B), Rancho Plaza (C), Frontier Plaza (D), Imperial Plaza (E), Rancho Center (F), Parkway Plaza (G), Charleston Center (H), Almond Tree Center (I), Fremont Plaza (J), Bonanza Square (K), Greater Vegas Plaza (L), The Family Center (M), Charleston Square (N), Eagle Plaza (O), Double I J Ranch (P), Union Pacific Station (Q), Tournament Players Club at Summerlin Golf Course (R), Tournament Players Club at the Canyons Golf Course (S), Angel Park Golf Club (T). Display/hide their locations on the map
Shopping Centers: Town and Country Shopping Center (1), Westland Mall (2), Golden West Shopping Center (3), Factory Outlet Mall of Las Vegas (4), Rancho Circle Shopping Center (5), Fountains Shopping Center (6), Brooks Shopping Center (7), Charleston Bazar Shopping Center (8), Cheyenne Village Shopping Center (9). Display/hide their locations on the map
Main business address in Las Vegas include: Community Bancorp (A), American Casino & Entertainment Properties LLC (B), Valley Bancorp (C), TOUCHTUNES MUSIC CORP (D). Display/hide their locations on the map
Churches in Las Vegas include: Victory Vegas Church (A), Shekinah Glory Ministries (B), Victory Missionary Baptist Church (C), Second Baptist Church (D), Sanctuary of Praise International Church (E), Upland Bible Church (F), Saint Lukes Episcopal Church (G), Unity Baptist Church (H), Saint Josephs Catholic Church (I). Display/hide their locations on the map
Cemeteries: Memory Gardens (1), Woodlawn Cemetery (2). Display/hide their locations on the map
Lakes: Tule Springs Lake (A), Mulberry Lake (B), Twin Lakes (C), Cottonwood Lake (D), Desert Willow Lake (E). Display/hide their locations on the map
Creek: Vegas Creek (A). Display/hide its location on the map
Parks in Las Vegas include: Old Las Vegas Fort State Historical Park (1), Adcock Playground (2), Aloha Shores Park (3), Angel Park (4), Ansan Park (5), Baker Park (6), Baker Pool (7), Baskin Park (8), Bell Playground (9). Display/hide their locations on the map
Tourist attractions: Lied Discovery Children's Museum (833 Las Vegas Boulevard North) (1), Guggenheim Hermitage Museum (3355 Las Vegas Boulevard South) (2), Elvis-A-Rama Museum (3401 Industrial Rd) (3), Madame Tussauds Las Vegas (Museums; 3377 Las Vegas Boulevard South) (4), Las Vegas International Scout Museum (2915 West Charleston Boulevard Suite 2) (5), Sin Gentlemen's Club (Museums; 3525 West Russell Road) (6), Neon Museum (821 Las Vegas Boulevard North) (7), Las Vegas Art Museum (9600 West Sahara Avenue) (8), Nevada State Museum & Historical Society (700 Twin Lakes Drive) (9). Display/hide their approximate locations on the map
Hotels: Doubletree Club Las Vegas (7250 Pollock Dr) (1), The Las Vegas Gambler (5509 Oakwood Ridge St) (2), MGM Grand Hotel Casino-The City of Entertainment - Human Resources (3799 Las Vegas Boulevard South) (3), Las Vegas Hilton - Showroom Reservations (3000 Paradise Road) (4), Paris Las Vegas - Human Resources (3655 Las Vegas Boulevard South) (5), Fairfield Inn & Suites Las Vegas South (5775 Dean Martin Drive) (6), Lucky Cuss Motel (3305 Fremont Street) (7), Travelinn (2028 Fremont Street) (8), Orleans Hotel and Casino (4500 West Tropicana) (9). Display/hide their approximate locations on the map
Courts: Las Vegas City - Municipal Court- Alternative Sentencing Education- Evaluation Ce (2917 West Washington Avenue) (1), Las Vegas City - Municipal Court- Alternative Sentencing Education (416 North 7th Street) (2), Las Vegas City - Municipal Court (400 Stewart Avenue) (3), Nevada - Motor Vehicle Department- Drivers License & Registration (2701 East Sahara Avenue) (4), Nevada State - District Court-Eighth Judicial- Family Division- Administra (601 North Pecos Road) (5), United States Government - HUD Information- Eoir-Immigration Court (3365 Pepper Lane) (6), United States Government - Courts- Ninth Circuit Court Of Appeals (333 Las Vegas Boulevard South) (7), United States Government - Courts- U S District Court (333 Las Vegas Boulevard South) (8), Clark County - Justice Court- Juvenile Court School (601 North Pecos Road) (9). Display/hide their approximate locations on the map
Birthplace of: Frank Mir - Martial artist, Andre Agassi - (1970-), tennis player, Charles Wright (wrestler) - Professional wrestler, Bryce Harper - Baseball player, Thomas Dekker (actor) - Actor, Steven Horsford - Politician, DeMarco Murray - Football player, Antonio McKee - Martial artist, Billy Sherwood - Rock guitarist, Ryan Van Bergen - Football player.
Drinking water stations with addresses in Las Vegas and their reported violations in the past:
LAS VEGAS VALLEY WATER DISTRICT (Address: LAS VEGAS VALLEY WATER DIST , Population served: 1,347,550, Surface water):Past monitoring violations:TROPICANA RESORT AND CASINO (Population served: 5,950, Purch surface water):
- 7 regular monitoring violations
Past health violations:SOUTHERN DESERT CORRECTIONAL CTR NDOC (Population served: 4,700, Groundwater):Past monitoring violations:
- MCL, Acute (TCR) - In JUN-2008, Contaminant: Coliform. Follow-up actions: St Violation/Reminder Notice (JUL-09-2008), St Boil Water Order (JUL-09-2008), St Public Notif requested (JUL-09-2008), St Compliance achieved (AUG-31-2008)
- MCL, Monthly (TCR) - In SEP-2006, Contaminant: Coliform. Follow-up actions: St Violation/Reminder Notice (NOV-08-2006), St Public Notif requested (NOV-08-2006)
- Monitoring and Reporting (DBP) - Between JAN-2012 and MAR-2012, Contaminant: Chlorine. Follow-up actions: St Public Notif requested (JUL-05-2012), St Violation/Reminder Notice (JUL-05-2012), St Compliance achieved (2 times from JUL-26-2012 to JUL-26-2012)
- Monitoring and Reporting (DBP) - Between APR-2011 and JUN-2011, Contaminant: Chlorine. Follow-up actions: St Violation/Reminder Notice (2 times from JAN-03-2012 to JAN-03-2012), St Public Notif requested (2 times from JAN-03-2012 to JAN-03-2012), St Compliance achieved (MAY-07-2012)
- Monitoring and Reporting (DBP) - Between JAN-2011 and DEC-2011, Contaminant: Total Haloacetic Acids (HAA5). Follow-up actions: St Public Notif requested (APR-26-2012), St Violation/Reminder Notice (APR-26-2012), St Compliance achieved (JUL-30-2012)
- Monitoring and Reporting (DBP) - Between JAN-2011 and DEC-2011, Contaminant: TTHM. Follow-up actions: St Public Notif requested (APR-26-2012), St Violation/Reminder Notice (APR-26-2012), St Compliance achieved (JUL-30-2012)
- Follow-up Or Routine LCR Tap M/R - In OCT-01-2010, Contaminant: Lead and Copper Rule. Follow-up actions: St Compliance achieved (SEP-11-2009), St Public Notif requested (JUN-10-2011), St Violation/Reminder Notice (JUN-10-2011)
- 3 minor monitoring violations
- 58 regular monitoring violations
- 13 other older monitoring violations
Past health violations:POLO TOWERS (Population served: 2,300, Purch surface water):Past monitoring violations:
- MCL, Monthly (TCR) - In JUL-2011, Contaminant: Coliform. Follow-up actions: St Public Notif requested (JUL-20-2011), St Violation/Reminder Notice (JUL-20-2011), St Public Notif received (JUL-27-2011), St Compliance achieved (AUG-01-2011)
- MCL, Monthly (TCR) - In APR-2005, Contaminant: Coliform. Follow-up actions: St Violation/Reminder Notice (MAY-26-2005), St Public Notif requested (MAY-26-2005)
- Monitoring and Reporting (DBP) - Between JAN-2009 and DEC-2009, Contaminant: Total Haloacetic Acids (HAA5). Follow-up actions: St Public Notif requested (JUN-15-2010), St Violation/Reminder Notice (JUN-15-2010), St Compliance achieved (SEP-30-2010)
- Monitoring and Reporting (DBP) - Between JAN-2009 and DEC-2009, Contaminant: TTHM. Follow-up actions: St Public Notif requested (JUN-15-2010), St Violation/Reminder Notice (JUN-15-2010), St Compliance achieved (SEP-30-2010)
- Monitoring and Reporting (DBP) - Between JUL-2007 and SEP-2007, Contaminant: Chlorine. Follow-up actions: St Public Notif requested (DEC-12-2007), St Violation/Reminder Notice (DEC-12-2007), St Compliance achieved (NOV-01-2010)
- Monitoring and Reporting (DBP) - Between JAN-2007 and MAR-2007, Contaminant: Chlorine. Follow-up actions: St Public Notif requested (APR-26-2008), St Violation/Reminder Notice (APR-26-2008), St Compliance achieved (NOV-01-2010)
- Monitoring and Reporting (DBP) - Between APR-2005 and JUN-2005, Contaminant: Chlorine. Follow-up actions: St Public Notif requested (APR-18-2006), St Violation/Reminder Notice (APR-18-2006), St Compliance achieved (NOV-01-2010)
- 32 regular monitoring violations
- 7 other older monitoring violations
Past monitoring violations:MONTE CARLO RESORT AND CASINO (Population served: 1,980, Purch surface water):
- Initial Tap Sampling for Pb and Cu - In JAN-01-2014, Contaminant: Lead and Copper Rule. Follow-up actions: St Compliance achieved (MAR-05-2014), St Public Notif requested (MAY-08-2014), St Violation/Reminder Notice (MAY-08-2014)
- Monitoring and Reporting (DBP) - Between OCT-2013 and DEC-2013, Contaminant: Chlorine
- One minor monitoring violation
Past monitoring violations:NEVADA TEST SITE A23 AND 6 (Address: NATIONAL NUCLEAR SECURITY ADMIN , Population served: 1,700, Groundwater):
- Monitoring and Reporting (DBP) - Between JAN-2013 and MAR-2013, Contaminant: Chlorine. Follow-up actions: St Public Notif requested (FEB-26-2013), St Violation/Reminder Notice (FEB-26-2013), St Compliance achieved (JUL-09-2013)
- One minor monitoring violation
Past monitoring violations:ELY MAXIMUM SECURITY PRISON NDOC (Population served: 1,099, Groundwater):
- One regular monitoring violation
Past monitoring violations:SEVEN ELEVEN NO 23074 (Population served: 1,001, Groundwater):
- 78 regular monitoring violations
Past monitoring violations:
- 2 regular monitoring violations
Drinking water stations with addresses in Las Vegas that have no violations reported:
- CITY CENTER HOTELS (Population served: 8,900, Primary Water Source Type: Purch surface water)
- BIG BEND WATER DISTRICT (Population served: 8,300, Primary Water Source Type: Surface water)
- BELLAGIO RESORT AND CASINO (Population served: 8,171, Primary Water Source Type: Purch surface water)
- MGM GRAND HOTEL AND CASINO (Population served: 7,500, Primary Water Source Type: Purch surface water)
- MANDALAY BAY RESORT AND CASINO (Population served: 5,549, Primary Water Source Type: Purch surface water)
- MIRAGE RESORT AND CASINO (Population served: 4,400, Primary Water Source Type: Purch surface water)
- LUXOR RESORT AND CASINO (Population served: 3,196, Primary Water Source Type: Purch surface water)
- WHISKEY PETES (Population served: 3,000, Primary Water Source Type: Groundwater)
- CIRCUS CIRCUS CASINO (Population served: 2,668, Primary Water Source Type: Purch surface water)
- EXCALIBUR RESORT AND CASINO (Population served: 2,607, Primary Water Source Type: Purch surface water)
| This city: | 2.7 people |
| Nevada: | 2.6 people |
| This city: | 65.5% |
| Whole state: | 65.3% |
| This city: | 8.5% |
| Whole state: | 8.7% |
Likely homosexual households (counted as self-reported same-sex unmarried-partner households)
- Lesbian couples: 0.5% of all households
- Gay men: 0.5% of all households
People in group quarters in Las Vegas in 2010:
- 4,461 people in local jails and other municipal confinement facilities
- 1,628 people in nursing facilities/skilled-nursing facilities
- 1,211 people in other noninstitutional facilities
- 1,026 people in emergency and transitional shelters (with sleeping facilities) for people experiencing homelessness
- 512 people in group homes intended for adults
- 201 people in correctional facilities intended for juveniles
- 127 people in state prisons
- 116 people in residential treatment centers for adults
- 103 people in workers' group living quarters and job corps centers
- 83 people in group homes for juveniles (non-correctional)
- 8 people in in-patient hospice facilities
- 6 people in residential treatment centers for juveniles (non-correctional)
People in group quarters in Las Vegas in 2000:
- 3,368 people in local jails and other confinement facilities (including police lockups)
- 2,104 people in other noninstitutional group quarters
- 1,258 people in nursing homes
- 337 people in short-term care, detention or diagnostic centers for delinquent children
- 222 people in homes or halfway houses for drug/alcohol abuse
- 190 people in federal prisons and detention centers
- 122 people in other nonhousehold living situations
- 121 people in homes for the mentally retarded
- 92 people in mental (psychiatric) hospitals or wards
- 92 people in other group homes
- 67 people in halfway houses
- 63 people in homes for the mentally ill
- 48 people in hospitals or wards for drug/alcohol abuse
- 32 people in training schools for juvenile delinquents
- 26 people in religious group quarters
- 24 people in wards in general hospitals for patients who have no usual home elsewhere
- 19 people in homes for the physically handicapped
Banks with most branches in Las Vegas (2011 data):
- Wells Fargo Bank, National Association: 61 branches. Info updated 2011/04/05: Bank assets: $1,161,490.0 mil, Deposits: $905,653.0 mil, headquarters in Sioux Falls, SD, positive income, 6395 total offices, Holding Company: Wells Fargo & Company
- U.S. Bank National Association: 56 branches. Info updated 2012/01/30: Bank assets: $330,470.8 mil, Deposits: $236,091.5 mil, headquarters in Cincinnati, OH, positive income, 3121 total offices, Holding Company: U.S. Bancorp
- Bank of America, National Association: 39 branches. Info updated 2009/11/18: Bank assets: $1,451,969.3 mil, Deposits: $1,077,176.8 mil, headquarters in Charlotte, NC, positive income, 5782 total offices, Holding Company: Bank Of America Corporation
- JPMorgan Chase Bank, National Association: 32 branches. Info updated 2011/11/10: Bank assets: $1,811,678.0 mil, Deposits: $1,190,738.0 mil, headquarters in Columbus, OH, positive income, International Specialization, 5577 total offices, Holding Company: Jpmorgan Chase & Co.
- Nevada State Bank: 22 branches. Info updated 2009/04/21: Bank assets: $4,101.1 mil, Deposits: $3,546.3 mil, local headquarters, positive income, Commercial Lending Specialization, 53 total offices, Holding Company: Zions Bancorporation
- Citibank, National Association: 12 branches. Info updated 2012/01/10: Bank assets: $1,288,658.0 mil, Deposits: $882,541.0 mil, headquarters in Sioux Falls, SD, positive income, International Specialization, 1048 total offices, Holding Company: Citigroup Inc.
- Bank of Nevada: 8 branches. Info updated 2009/09/28: Bank assets: $2,877.6 mil, Deposits: $2,377.3 mil, local headquarters, positive income, Commercial Lending Specialization, 13 total offices, Holding Company: Western Alliance Bancorporation
- City National Bank: 7 branches. Info updated 2011/04/11: Bank assets: $23,303.6 mil, Deposits: $20,475.9 mil, headquarters in Los Angeles, CA, positive income, Commercial Lending Specialization, 86 total offices, Holding Company: City National Corporation
- Town & Country Bank: at 8620 W. Tropicana Avenue, Southern Highlands Parkway Branch, Courier Service, South Rainbow Branch, West Charleston Boulevard Branch. Info updated 2006/11/03: Bank assets: $160.6 mil, Deposits: $133.0 mil, local headquarters, negative income in the last year, Commercial Lending Specialization, 5 total offices, Holding Company: West Point Bancorp, Inc.
- 25 other banks with 39 local branches
For population 15 years and over in Las Vegas:
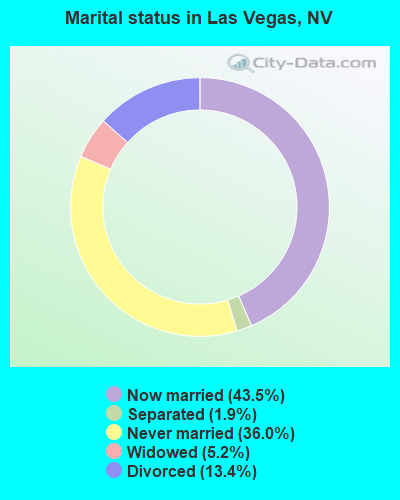
- Never married: 36.0%
- Now married: 43.5%
- Separated: 1.9%
- Widowed: 5.2%
- Divorced: 13.4%
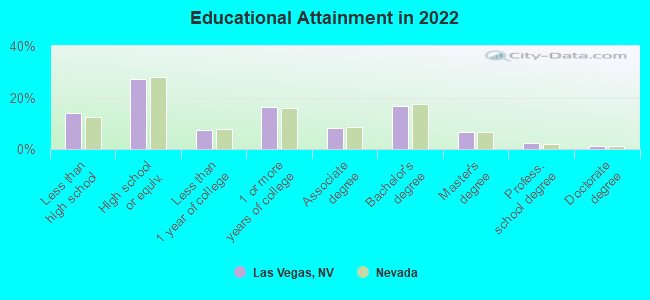
For population 25 years and over in Las Vegas:
- High school or higher: 86.0%
- Bachelor's degree or higher: 26.7%
- Graduate or professional degree: 9.9%
- Unemployed: 4.3%
- Mean travel time to work (commute): 22.0 minutes
| Here: | 13.3 |
| Nevada average: | 12.5 |


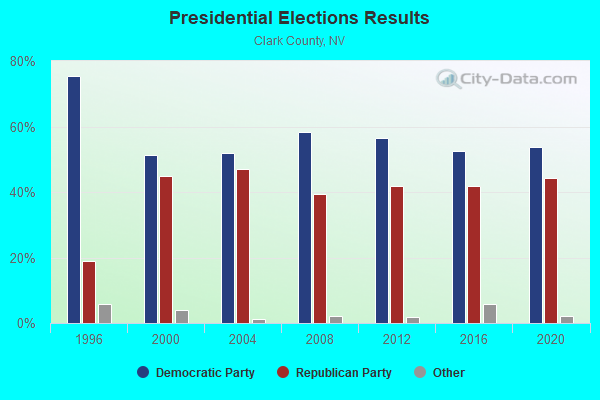
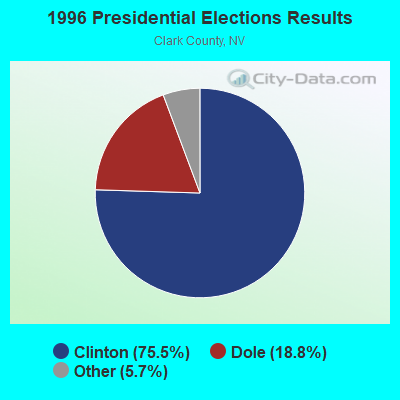
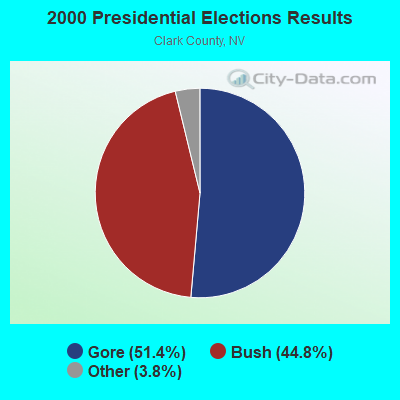
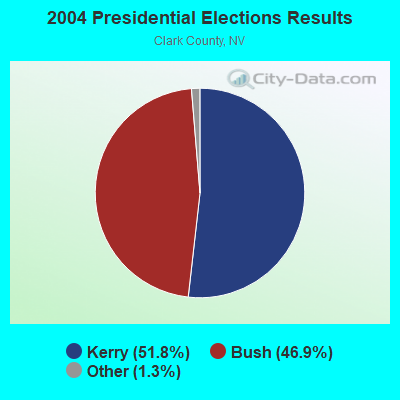
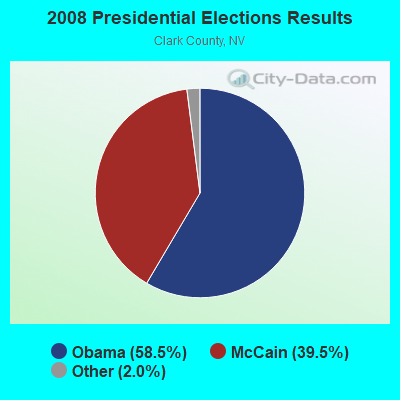
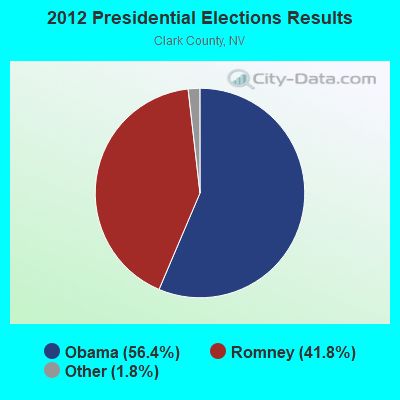
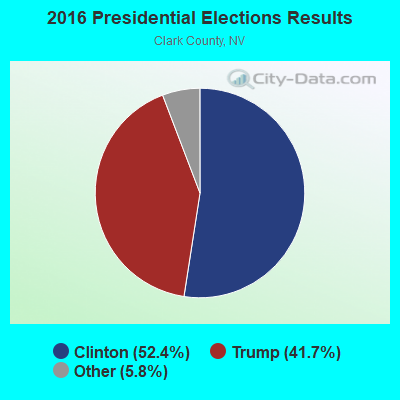
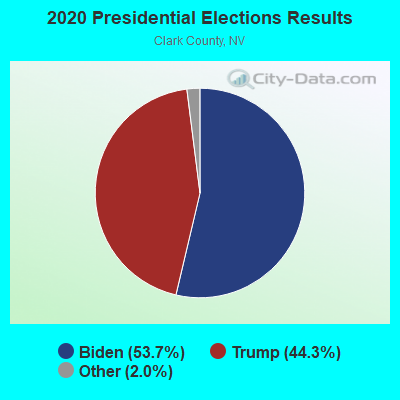
Graphs represent county-level data. Detailed 2008 Election Results
Neighborhoods in Las Vegas:
(Las Vegas, Nevada Neighborhood Map)- Aida Brents Resident Council neighborhood
- Ambiance Estates neighborhood
- American Village neighborhood
- American West Village neighborhood
- Angel Park Lindell neighborhood
- Angel Park Ranch neighborhood
- Appaloosa Canyon Quarterhourse Falls neighborhood
- Archie C. Grant neighborhood
- Arden neighborhood
- Artesian Heights neighborhood
- Arthur McCants neighborhood
- Arts District neighborhood
- Aspendale neighborhood
- Aventura neighborhood
- Bavington Court neighborhood
- Berkley Square neighborhood
- Beverly Green neighborhood
- Biltmore Bungalows neighborhood
- Biltmore West neighborhood
- Bonanza Village neighborhood
- Boulder Junction neighborhood
- Bracken neighborhood
- Bradley Ranch neighborhood
- Briar Hill Park neighborhood
- Buffalo neighborhood
- Canyon Creek North neighborhood
- Capri At The Vistas neighborhood
- Carriage Park neighborhood
- Casa Mia Grande neighborhood
- Casino Center neighborhood
- Centennial Center neighborhood
- Centennial Hills neighborhood
- Century Garden neighborhood
- Charleston neighborhood
- Charleston Estates neighborhood
- Charleston Heights neighborhood
- Charleston Heights South neighborhood
- Charleston McNeil neighborhood
- Church-Noblitt neighborhood
- Cimarron Gowan neighborhood
- Cimarron Springs neighborhood
- Cimarron Village North neighborhood
- Clark Towers Senior Apartments neighborhood
- Cliff's Edge neighborhood
- College Park neighborhood
- Coves neighborhood
- Crestwood neighborhood
- Cultural Corridor neighborhood
- Desert Creek neighborhood
- Desert Shores neighborhood
- Diamond Creek neighborhood
- Diamond Point neighborhood
- Diamond Springs Estates neighborhood
- Discovery neighborhood
- Downtown neighborhood
- Downtown East neighborhood
- Downtown North neighborhood
- Downtown North District neighborhood
- Downtown South neighborhood
- Eagle Creek Heights neighborhood
- Eagle Heights at Elkhorn Springs neighborhood
- East Fremont (Freemont Street) neighborhood
- East Las Vegas neighborhood
- Eastland Heights neighborhood
- Eikhorn Ranch neighborhood
- El Mar Plaza neighborhood
- Elk Ridge neighborhood
- Elkhorn Springs neighborhood
- Ellis Estates neighborhood
- Enterprise Park neighborhood
- Fallbrook neighborhood
- Firethorne neighborhood
- Floyd Lamb Park neighborhood
- Four Winds neighborhood
- Francisco Park neighborhood
- Fremont Estates neighborhood
- Fremont Street neighborhood
- Frontier Rancho Estate neighborhood
- Gateway District neighborhood
- Gilcrease neighborhood
- Glen Heather Estates neighborhood
- Golf Ridge Terrace neighborhood
- Granbilt neighborhood
- Grand Canyon Village neighborhood
- Grand Entries neighborhood
- Grand Estates neighborhood
- Grand Teton Village neighborhood
- Greens neighborhood
- Greentree Condo neighborhood
- Haciendas La Caliente neighborhood
- Harmon Gardens neighborhood
- Harmony Park neighborhood
- Harry Levy Gardens neighborhood
- Highgate Condominium neighborhood
- Hillside Heights neighborhood
- Home Land neighborhood
- Homeless Corridor neighborhood
- Horizon Vistas neighborhood
- Hunters Glen neighborhood
- Huntridge neighborhood
- Huntridge Park neighborhood
- Iron Mountain neighborhood
- Iron Mountain Estates neighborhood
- Iron Mountain Ranch neighborhood
- James Down Towers neighborhood
- John S. Park neighborhood
- Kari Lee Apartments neighborhood
- Kensington neighborhood
- Kyle Canyon neighborhood
- L.V. Meadows neighborhood
- La Cueste neighborhood
- La Mancha Summerlin neighborhood
- Laguna Bay neighborhood
- Lamb of God neighborhood
- Lamplight Manor at Iron Mountain Ranch neighborhood
- Las Vegas Boulevard Overlay District neighborhood
- Las Vegas Country Club neighborhood
- Las Vegas Enterprise Park neighborhood
- Las Vegas Medical District neighborhood
- Las Vegas Spectrum neighborhood
- Las Vegas Technology Center neighborhood
- Las Verdes Heights neighborhood
- Lewis Street Corridor neighborhood
- Lone Mountain neighborhood
- Lone Mountain Heights neighborhood
- Lone Mountain West neighborhood
- Los Prados neighborhood
- Maryland Pebble neighborhood
- McCarran International Airport neighborhood
- Meadow Valley neighborhood
- Meadows neighborhood
- Meadows Village neighborhood
- Meadows at Elkhorn Springs neighborhood
- Medical Center neighborhood
- Medical District neighborhood
- Mi Casa En El Sol neighborhood
- Michael Way neighborhood
- Montecito Town Center neighborhood
- Monterey Springs neighborhood
- Moondance at Silverado Ranch neighborhood
- Mountain Shadows neighborhood
- Mountain Trails neighborhood
- Mystic Valley neighborhood
- Newport Cove neighborhood
- North Cheyenne neighborhood
- North Las Vegas neighborhood
- Northeast Las Vegas neighborhood
- Northern Lights at Elkhorn Springs neighborhood
- Northern Strip neighborhood
- Northshore Reflections neighborhood
- Northwest neighborhood
- Northwest Equestrian Park neighborhood
- Northwest Las Vegas neighborhood
- Northwest Town Center neighborhood
- Off-Strip neighborhood
- Office Core District neighborhood
- Orleans Square neighborhood
- Painted Desert neighborhood
- Palomino neighborhood
- Paradise neighborhood
- Paradise Falls neighborhood
- Paradise North neighborhood
- Paradise Palms neighborhood
- Paradise Road neighborhood
- Paradise Valleys Southgate neighborhood
- Paradise Vista neighborhood
- Park San Miguel neighborhood
- Parkway Center neighborhood
- Peccole Ranch neighborhood
- Pelican Point neighborhood
- Pine Tree Village neighborhood
- Pinto Palomino neighborhood
- Pioneer Park neighborhood
- Plaza San Miguel neighborhood
- Pueblo at Sante Fe neighborhood
- Quail Estates West neighborhood
- Quarterhorse Falls neighborhood
- Rainbow Park neighborhood
- Rancho Alta Mira neighborhood
- Rancho Bel Air neighborhood
- Rancho Charleston neighborhood
- Rancho Circle neighborhood
- Rancho Corridor (Rancho Drive Corridor) neighborhood
- Rancho Manor neighborhood
- Rancho Oakey (Rancho South) neighborhood
- Rancho San Miguel neighborhood
- Rancho Sante Fe neighborhood
- Rancho Sereno neighborhood
- Rancho Springs neighborhood
- Rhodes Ranch neighborhood
- Robindale Eastern neighborhood
- Robindale Terrace neighborhood
- Rock Springs neighborhood
- Romano Ridge neighborhood
- Royal Crest Arms neighborhood
- Royal Crest Estate neighborhood
- Royal Crest Rancheros neighborhood
- Rulon Earl neighborhood
- Salt Creek neighborhood
- San Marino Circle neighborhood
- Sante Fe neighborhood
- Sante Fe Haciendas neighborhood
- Sartini Plaza and Annex neighborhood
- Scotch 80's neighborhood
- Section 7 neighborhood
- Sheep Mountain neighborhood
- Showboat neighborhood
- Sierra Madre neighborhood
- Sierra Oeste neighborhood
- Silver Oak neighborhood
- Silver Pointe neighborhood
- Silverado Estate neighborhood
- Silverado Ranch Estate neighborhood
- Silverado Trails neighborhood
- Silverstone Ranch neighborhood
- Siverado Hills neighborhood
- Solana Del Mar at Painted Desert neighborhood
- Solera at Stallion Mountain neighborhood
- South Las Vegas neighborhood
- South Shores neighborhood
- South Valley Ranch neighborhood
- Southeast Las Vegas neighborhood
- Southridge neighborhood
- Southwest Las Vegas neighborhood
- Spanish Oaks neighborhood
- Spectrum Business Park neighborhood
- Spencer Ridge neighborhood
- Spring Valley neighborhood
- Sterling Springs neighborhood
- Stewart Place neighborhood
- Stone Mountain Ranch neighborhood
- Summerlin neighborhood
- Summerlin North neighborhood
- Summerlin South neighborhood
- Sun City neighborhood
- Sun City Summerlin neighborhood
- Sunburst neighborhood
- Suncrest Trail neighborhood
- Sundance Place neighborhood
- Sunrise neighborhood
- Sunrise Manor neighborhood
- Sutton Place neighborhood
- Swenson Apartments neighborhood
- Symphony neighborhood
- Tanglewood neighborhood
- Technology Park neighborhood
- The Asian District neighborhood
- The Highlands: Highland Hills: Highland Hill South neighborhood
- The Lakes neighborhood
- The Preserves at Elkhorn Springs neighborhood
- The Strip (The Las Vegas Strip) neighborhood
- Timberlake neighborhood
- Timberline Shadow Hills neighborhood
- Torrey Pines neighborhood
- Towncenter neighborhood
- Trails at Warme Springs neighborhood
- Trophy Club neighborhood
- Tropical Meadows neighborhood
- Turning Point neighborhood
- Twin Lakes neighborhood
- Twin Lakes Country Club neighborhood
- UNLV (University of Nevada, Las Vegas) neighborhood
- Union Park Development neighborhood
- University Bitmore neighborhood
- University Crest neighborhood
- Valle Grande Estate neighborhood
- Verona neighborhood
- Villa Sedona neighborhood
- Vintage Hills neighborhood
- Watkins Glen neighborhood
- West Circle neighborhood
- West Las Vegas neighborhood
- West Sahara neighborhood
- Westleigh neighborhood
- Whisper Creek neighborhood
- Whispering Timbers neighborhood
- Wildflower neighborhood
- Willowdale neighborhood
- Winchester neighborhood
- Windmill Park neighborhood
- Windmill Springs neighborhood
- Windmill Village neighborhood
- Wishing Well Ranch neighborhood
- Woodcrest Village neighborhood
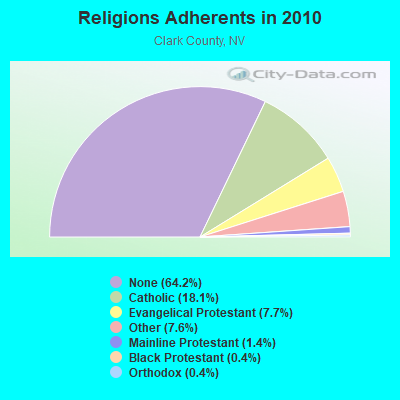
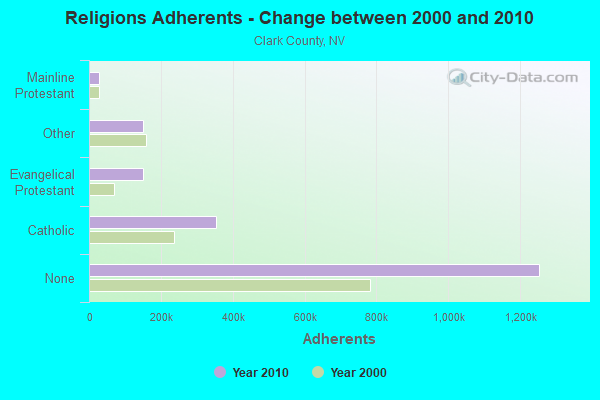
Religion statistics for Las Vegas, NV (based on Clark County data)
| Religion | Adherents | Congregations |
|---|---|---|
| Catholic | 354,110 | 32 |
| Evangelical Protestant | 150,709 | 349 |
| Other | 149,167 | 300 |
| Mainline Protestant | 27,072 | 72 |
| Black Protestant | 8,550 | 42 |
| Orthodox | 8,191 | 11 |
| None | 1,253,470 | - |
Food Environment Statistics:
| Clark County: | 1.41 / 10,000 pop. |
| Nevada: | 1.50 / 10,000 pop. |
| Clark County: | 0.08 / 10,000 pop. |
| Nevada: | 0.10 / 10,000 pop. |
| Clark County: | 0.96 / 10,000 pop. |
| Nevada: | 1.00 / 10,000 pop. |
| This county: | 2.21 / 10,000 pop. |
| Nevada: | 2.56 / 10,000 pop. |
| Here: | 5.68 / 10,000 pop. |
| Nevada: | 6.14 / 10,000 pop. |
| This county: | 8.7% |
| Nevada: | 8.2% |
| Clark County: | 24.8% |
| State: | 24.5% |
| This county: | 13.2% |
| Nevada: | 13.2% |
Health and Nutrition:
| This city: | 48.2% |
| Nevada: | 48.6% |
| Las Vegas: | 45.7% |
| Nevada: | 45.9% |
| This city: | 28.5 |
| State: | 28.6 |
| Here: | 21.1% |
| Nevada: | 21.3% |
| Here: | 10.8% |
| Nevada: | 10.7% |
| Las Vegas: | 6.8 |
| Nevada: | 6.8 |
| This city: | 32.7% |
| Nevada: | 33.1% |
| This city: | 55.3% |
| Nevada: | 55.6% |
| Here: | 79.6% |
| Nevada: | 79.4% |
More about Health and Nutrition of Las Vegas, NV Residents
| Local government employment and payroll (March 2022) | |||||
| Function | Full-time employees | Monthly full-time payroll | Average yearly full-time wage | Part-time employees | Monthly part-time payroll |
|---|---|---|---|---|---|
| Firefighters | 578 | $6,251,287 | $129,785 | 0 | $0 |
| Correction | 288 | $2,248,733 | $93,697 | 1 | $1,986 |
| Other and Unallocable | 270 | $1,832,147 | $81,429 | 6 | $11,999 |
| Parks and Recreation | 242 | $1,361,113 | $67,493 | 578 | $517,352 |
| Sewerage | 202 | $1,361,403 | $80,875 | 1 | $1,050 |
| Judicial and Legal | 188 | $1,323,928 | $84,506 | 0 | $0 |
| Other Government Administration | 182 | $1,350,845 | $89,067 | 1 | $1,112 |
| Fire - Other | 165 | $1,172,757 | $85,291 | 15 | $23,046 |
| Streets and Highways | 139 | $1,128,134 | $97,393 | 2 | $2,356 |
| Financial Administration | 132 | $1,041,864 | $94,715 | 9 | $10,299 |
| Police Protection - Officers | 91 | $613,058 | $80,843 | 0 | $0 |
| Housing and Community Development (Local) | 60 | $403,990 | $80,798 | 16 | $14,021 |
| Solid Waste Management | 27 | $161,025 | $71,567 | 0 | $0 |
| Health | 21 | $114,866 | $65,638 | 0 | $0 |
| Welfare | 17 | $99,393 | $70,160 | 22 | $31,520 |
| Natural Resources | 3 | $33,476 | $133,904 | 1 | $1,280 |
| Totals for Government | 2,605 | $20,498,017 | $94,425 | 652 | $616,021 |
Las Vegas government finances - Expenditure in 2021 (per resident):
- Construction - Regular Highways: $147,831,000 ($225.26)
Sewerage: $36,173,000 ($55.12)
General Public Buildings: $30,923,000 ($47.12)
General - Other: $19,435,000 ($29.61)
Parks and Recreation: $14,779,000 ($22.52)
Local Fire Protection: $6,619,000 ($10.09)
Correctional Institutions: $1,121,000 ($1.71)
- Current Operations - Local Fire Protection: $142,565,000 ($217.23)
Sewerage: $67,617,000 ($103.03)
Correctional Institutions: $58,944,000 ($89.82)
Parks and Recreation: $55,834,000 ($85.08)
Housing and Community Development: $44,498,000 ($67.80)
General - Other: $42,011,000 ($64.01)
Regular Highways: $36,354,000 ($55.39)
Judicial and Legal Services: $33,285,000 ($50.72)
Central Staff Services: $24,022,000 ($36.60)
Protective Inspection and Regulation - Other: $19,150,000 ($29.18)
Financial Administration: $17,097,000 ($26.05)
Police Protection: $17,029,000 ($25.95)
Health - Other: $14,990,000 ($22.84)
General Public Buildings: $10,434,000 ($15.90)
Parking Facilities: $9,885,000 ($15.06)
Solid Waste Management: $7,823,000 ($11.92)
- General - Interest on Debt: $29,090,000 ($44.33)
- Intergovernmental to Local - Other - Police Protection: $146,553,000 ($223.31)
Other - General - Other: $28,174,000 ($42.93)
- Other Capital Outlay - Sewerage: $2,093,000 ($3.19)
General - Other: $1,004,000 ($1.53)
Housing and Community Development: $804,000 ($1.23)
Local Fire Protection: $172,000 ($0.26)
Police Protection: $172,000 ($0.26)
Parking Facilities: $80,000 ($0.12)
Parks and Recreation: $69,000 ($0.11)
Regular Highways: $50,000 ($0.08)
Correctional Institutions: $47,000 ($0.07)
Central Staff Services: $32,000 ($0.05)
Judicial and Legal Services: $14,000 ($0.02)
Las Vegas government finances - Revenue in 2021 (per resident):
- Charges - Sewerage: $108,479,000 ($165.30)
Other: $35,091,000 ($53.47)
Parking Facilities: $6,504,000 ($9.91)
Parks and Recreation: $5,796,000 ($8.83)
Regular Highways: $3,437,000 ($5.24)
Housing and Community Development: $972,000 ($1.48)
- Federal Intergovernmental - Health and Hospitals: $40,416,000 ($61.58)
Housing and Community Development: $10,670,000 ($16.26)
Other: $825,000 ($1.26)
- Local Intergovernmental - Other: $34,155,000 ($52.04)
General Local Government Support: $3,119,000 ($4.75)
Highways: $1,683,000 ($2.56)
Health and Hospitals: $19,000 ($0.03)
- Miscellaneous - General Revenue - Other: $86,406,000 ($131.66)
Special Assessments: $23,812,000 ($36.28)
Sale of Property: $15,889,000 ($24.21)
Fines and Forfeits: $13,072,000 ($19.92)
Interest Earnings: $5,017,000 ($7.64)
Donations From Private Sources: $2,506,000 ($3.82)
Rents: $1,332,000 ($2.03)
- State Intergovernmental - General Local Government Support: $337,774,000 ($514.68)
Highways: $137,247,000 ($209.13)
Other: $59,790,000 ($91.11)
Sewerage: $8,829,000 ($13.45)
Health and Hospitals: $1,446,000 ($2.20)
Housing and Community Development: $3,000 ($0.00)
- Tax - Property: $152,027,000 ($231.65)
Public Utilities Sales: $63,248,000 ($96.37)
Occupation and Business License - Other: $27,763,000 ($42.30)
Other License: $21,486,000 ($32.74)
Amusements License: $3,084,000 ($4.70)
Alcoholic Beverage License: $2,868,000 ($4.37)
Other Selective Sales: $1,825,000 ($2.78)
Las Vegas government finances - Debt in 2021 (per resident):
- Long Term Debt - Beginning Outstanding - Unspecified Public Purpose: $603,148,000 ($919.05)
Outstanding Unspecified Public Purpose: $567,712,000 ($865.05)
Retired Unspecified Public Purpose: $35,436,000 ($54.00)
Las Vegas government finances - Cash and Securities in 2021 (per resident):
- Bond Funds - Cash and Securities: $202,047,000 ($307.87)
- Other Funds - Cash and Securities: $856,326,000 ($1304.83)
- Sinking Funds - Cash and Securities: $9,945,000 ($15.15)
6.10% of this county's 2021 resident taxpayers lived in other counties in 2020 ($110,616 average adjusted gross income)
| Here: | 6.10% |
| Nevada average: | 6.67% |
0.06% of residents moved from foreign countries ($580 average AGI)
Clark County: 0.06% Nevada average: 0.05%
Top counties from which taxpayers relocated into this county between 2020 and 2021:
| from Los Angeles County, CA | |
| from Orange County, CA | |
| from San Diego County, CA |
5.29% of this county's 2020 resident taxpayers moved to other counties in 2021 ($64,726 average adjusted gross income)
| Here: | 5.29% |
| Nevada average: | 5.77% |
0.05% of residents moved to foreign countries ($695 average AGI)
Clark County: 0.05% Nevada average: 0.04%
Top counties to which taxpayers relocated from this county between 2020 and 2021:
| to Los Angeles County, CA | |
| to Maricopa County, AZ | |
| to San Diego County, CA |
| Businesses in Las Vegas, NV | ||||
| Name | Count | Name | Count | |
|---|---|---|---|---|
| 24 Hour Fitness | 10 | Jones New York | 18 | |
| 7-Eleven | 90 | Journeys | 7 | |
| 99 Cents Only Stores | 11 | Juicy Couture | 4 | |
| ALDO | 5 | Justice | 4 | |
| AT&T | 35 | KFC | 24 | |
| Abercrombie & Fitch | 3 | Kincaid | 3 | |
| Abercrombie Kids | 2 | Kmart | 5 | |
| Ace Hardware | 4 | Kohl's | 5 | |
| Aeropostale | 3 | Kroger | 34 | |
| Aerosoles | 2 | La Quinta | 5 | |
| Albertsons | 25 | La-Z-Boy | 2 | |
| American Eagle Outfitters | 1 | Lane Bryant | 6 | |
| Ann Taylor | 10 | Lane Furniture | 5 | |
| Apple Store | 3 | LensCrafters | 5 | |
| Applebee's | 8 | Levi Strauss & Co. | 3 | |
| Arby's | 12 | Little Caesars Pizza | 16 | |
| Ashley Furniture | 2 | Long John Silver's | 8 | |
| Audi | 1 | Lowe's | 10 | |
| AutoZone | 33 | Macy's | 4 | |
| Avenue | 3 | Marriott | 13 | |
| BMW | 1 | Marshalls | 2 | |
| Baja Fresh Mexican Grill | 10 | MasterBrand Cabinets | 42 | |
| Bakers | 3 | Maurices | 1 | |
| Banana Republic | 7 | Mazda | 2 | |
| Barnes & Noble | 2 | McDonald's | 77 | |
| Baskin-Robbins | 8 | Men's Wearhouse | 5 | |
| Bath & Body Works | 13 | Microtel | 2 | |
| Bebe | 5 | Motherhood Maternity | 7 | |
| Bed Bath & Beyond | 4 | New Balance | 20 | |
| Ben & Jerry's | 5 | New York & Co | 2 | |
| Bentleymotors.Com | 1 | Nike | 41 | |
| Best Western | 4 | Nissan | 3 | |
| Big O Tires | 11 | Nordstrom | 2 | |
| Blockbuster | 18 | Office Depot | 11 | |
| Brooks Brothers | 2 | OfficeMax | 9 | |
| Brookstone | 4 | Old Navy | 3 | |
| Budget Car Rental | 4 | Olive Garden | 5 | |
| Buffalo Wild Wings | 4 | On The Border | 1 | |
| Burger King | 31 | Outback | 6 | |
| Burlington Coat Factory | 2 | Outback Steakhouse | 6 | |
| CVS | 43 | Pac Sun | 6 | |
| Cache | 5 | Panda Express | 40 | |
| Caribou Coffee | 1 | Panera Bread | 2 | |
| Carl\s Jr. | 28 | Papa John's Pizza | 11 | |
| Casual Male XL | 3 | Payless | 19 | |
| Catherines | 2 | Penske | 8 | |
| Charlotte Russe | 4 | PetSmart | 9 | |
| Chevrolet | 3 | Pier 1 Imports | 6 | |
| Chico's | 5 | Pizza Hut | 30 | |
| Chipotle | 8 | Popeyes | 13 | |
| Chuck E. Cheese's | 4 | Pottery Barn | 1 | |
| Church's Chicken | 4 | Pottery Barn Kids | 1 | |
| Cinnabon | 7 | Qdoba Mexican Grill | 3 | |
| Circle K | 25 | Quiznos | 19 | |
| Clarks | 4 | RadioShack | 19 | |
| Cold Stone Creamery | 6 | Ramada | 1 | |
| Comfort Inn | 1 | Red Lobster | 2 | |
| Costco | 3 | Red Robin | 1 | |
| Cricket Wireless | 72 | Ruby Tuesday | 1 | |
| Curves | 8 | Rue21 | 2 | |
| Dairy Queen | 20 | Ryder Rental & Truck Leasing | 2 | |
| Days Inn | 1 | SAS Shoes | 3 | |
| Decora Cabinetry | 3 | SONIC Drive-In | 15 | |
| Dennys | 19 | Safeway | 11 | |
| Discount Tire | 14 | Saks Fifth Avenue | 1 | |
| Domino's Pizza | 17 | Sam's Club | 2 | |
| DressBarn | 5 | Sears | 12 | |
| Dressbarn | 5 | Sephora | 4 | |
| Dunkin Donuts | 12 | Skechers USA | 9 | |
| Eddie Bauer | 1 | Soma Intimates | 1 | |
| El Pollo Loco | 11 | Spencer Gifts | 1 | |
| Ethan Allen | 1 | Sprint Nextel | 13 | |
| Express | 4 | Starbucks | 129 | |
| Extended Stay America | 2 | Steak 'n Shake | 1 | |
| Extended Stay Deluxe | 1 | Subaru | 1 | |
| Famous Footwear | 7 | Subway | 44 | |
| Fashion Bug | 3 | Super 8 | 2 | |
| FedEx | 140 | T-Mobile | 53 | |
| Finish Line | 4 | T.G.I. Driday's | 6 | |
| Foot Locker | 5 | T.J.Maxx | 4 | |
| Ford | 3 | Taco Bell | 35 | |
| Forever 21 | 3 | Talbots | 1 | |
| Fredericks Of Hollywood | 5 | Target | 11 | |
| GNC | 17 | The Athlete's Foot | 2 | |
| GameStop | 22 | The Cheesecake Factory | 2 | |
| Gap | 6 | The Limited | 1 | |
| Goodwill | 2 | The Room Place | 3 | |
| Gymboree | 5 | Torrid | 2 | |
| H&M | 3 | Toyota | 3 | |
| H&R Block | 37 | Toys"R"Us | 7 | |
| Haagen-Dazs | 7 | Trader Joe's | 2 | |
| Haworth | 1 | Travelodge | 3 | |
| Hilton | 11 | U-Haul | 64 | |
| Holiday Inn | 6 | UPS | 131 | |
| Hollister Co. | 3 | Urban Outfitters | 2 | |
| Home Depot | 9 | Vans | 25 | |
| Homestead Studio Suites | 1 | Verizon Wireless | 14 | |
| Honda | 3 | Victoria's Secret | 8 | |
| Hot Topic | 4 | Volkswagen | 2 | |
| Howard Johnson | 1 | Vons | 10 | |
| Hyatt | 1 | Walgreens | 36 | |
| IHOP | 13 | Walmart | 21 | |
| IZOD | 2 | Wendy's | 23 | |
| J. Jill | 1 | Westin | 1 | |
| J.Crew | 2 | Wet Seal | 3 | |
| JCPenney | 4 | Whole Foods Market | 3 | |
| Jimmy John's | 5 | YMCA | 4 | |
| JoS. A. Bank | 1 | Z Gallerie | 1 | |
| Johnny Rockets | 7 | |||
Strongest AM radio stations in Las Vegas:
- KENO (1460 AM; 10 kW; LAS VEGAS, NV; Owner: LOTUS BROADCASTING CORP.)
- KBAD (920 AM; 5 kW; LAS VEGAS, NV; Owner: LOTUS BROADCASTING CORP.)
- KKVV (1060 AM; 5 kW; LAS VEGAS, NV; Owner: LAS VEGAS BROADCASTERS, INC.)
- KDWN (720 AM; 50 kW; LAS VEGAS, NV; Owner: RADIO NEVADA CORP.)
- KSHP (1400 AM; 5 kW; NORTH LAS VEGAS, NV; Owner: LAS VEGAS RADIO CO. INC)
- KXNT (840 AM; 50 kW; NORTH LAS VEGAS, NV; Owner: INFINITY RADIO OPERATIONS INC.)
- KSFN (1140 AM; 10 kW; NORTH LAS VEGAS, NV; Owner: INFINITY RADIO OPERATIONS INC.)
- KRLV (1340 AM; 1 kW; LAS VEGAS, NV; Owner: CONTINENTAL RADIO BROADCASTING ACQUISITIONS, LLC)
- KLAV (1230 AM; 1 kW; LAS VEGAS, NV; Owner: GOR-OVERGAARD BROADCASTING, INC.)
- KNUU (970 AM; 5 kW; PARADISE, NV; Owner: NEVADA MEDIA GROUP, INC.)
- KLSQ (870 AM; 10 kW; WHITNEY, NV; Owner: KLSQ-AM LICENSE CORPORATION)
- KDOX (1280 AM; 5 kW; HENDERSON, NV; Owner: S & R BROADCASTING, INC.)
- KLAC (570 AM; 50 kW; LOS ANGELES, CA; Owner: AMFM RADIO LICENSES, L.L.C.)
Strongest FM radio stations in Las Vegas:
- KISF (103.5 FM; LAS VEGAS, NV; Owner: HBC LICENSE CORPORATION)
- K211DC (90.1 FM; PAHRUMP, NV; Owner: CALVARY CHAPEL OF TWIN FALLS, INC.)
- KJUL (104.3 FM; NORTH LAS VEGAS, NV; Owner: KJUL LICENSE, LLC)
- KXPT (97.1 FM; LAS VEGAS, NV; Owner: LOTUS BROADCASTING CORP.)
- KNPR (89.5 FM; LAS VEGAS, NV; Owner: NEVADA PUBLIC RADIO CORPORATION)
- KQOL-FM (93.1 FM; LAS VEGAS, NV; Owner: CITICASTERS LICENSES, L.P.)
- KXTE (107.5 FM; PAHRUMP, NV; Owner: INFINITY RADIO OPERATIONS INC.)
- KOMP (92.3 FM; LAS VEGAS, NV; Owner: LOTUS BROADCASTING CORP.)
- KOAS (105.7 FM; DOLAN SPRINGS, AZ; Owner: DESERT SKY MEDIA, LLC)
- KLUC-FM (98.5 FM; LAS VEGAS, NV; Owner: INFINITY RADIO OPERATIONS INC.)
- K295AJ (106.9 FM; NORTH LAS VEGAS, NV; Owner: CSN INTERNATIONAL)
- KRRN-FM1 (92.7 FM; EAST LAS VEGAS, NV; Owner: ENTRAVISION HOLDINGS, LLC)
- KKLZ (96.3 FM; LAS VEGAS, NV; Owner: KJUL LICENSE, LLC)
- KSTJ (102.7 FM; BOULDER CITY, NV; Owner: KJUL LICENSE, LLC)
- KILA (90.5 FM; LAS VEGAS, NV; Owner: FAITH COMMUNICATIONS CORP.)
- KSNE-FM (106.5 FM; LAS VEGAS, NV; Owner: CITICASTERS LICENSES, L.P.)
- KMXB (94.1 FM; HENDERSON, NV; Owner: INFINITY RADIO OPERATIONS INC.)
- KCEP (88.1 FM; LAS VEGAS, NV; Owner: ECONOMIC OPPORTUNITY BOARD OF CLARK COUNTY)
- KWID (101.9 FM; LAS VEGAS, NV; Owner: CITICASTERS LICENSES, L.P.)
- KMZQ-FM (100.5 FM; HENDERSON, NV; Owner: INFINITY RADIO OPERATIONS INC.)
TV broadcast stations around Las Vegas:
- KYRK-LP (Channel 35; LAS VEGAS, NV; Owner: MAKO COMMUNICATIONS, LLC)
- K57FA (Channel 57; LAS VEGAS, NV; Owner: TRINITY BROADCASTING NETWORK)
- KHDF-CA (Channel 19; LAS VEGAS, NV; Owner: AMANDA ORRICK MINTZ)
- KEEN-LP (Channel 17; LAS VEGAS, NV; Owner: VMG BROADCASTING COMPANY)
- KVBC (Channel 3; LAS VEGAS, NV; Owner: VALLEY BROADCASTING COMPANY)
- KBLR (Channel 39; PARADISE, NV; Owner: SUMMIT MEDIA LIMITED PARTNERSHIP)
- KVVU-TV (Channel 5; HENDERSON, NV; Owner: KVVU BROADCASTING CORPORATION)
- K67GB (Channel 67; LAS VEGAS, NV; Owner: WORD OF GOD FELLOWSHIP, INC.)
- KFBT (Channel 33; LAS VEGAS, NV; Owner: CHANNEL 33, INC.)
- KLAS-TV (Channel 8; LAS VEGAS, NV; Owner: KLAS, INC. (A NEVADA CORPORATION))
- K43FO (Channel 43; LAS VEGAS, NV; Owner: THREE ANGELS BROADCASTING NETWORK, INC.)
- KTNV (Channel 13; LAS VEGAS, NV; Owner: JOURNAL BROADCAST CORPORATION)
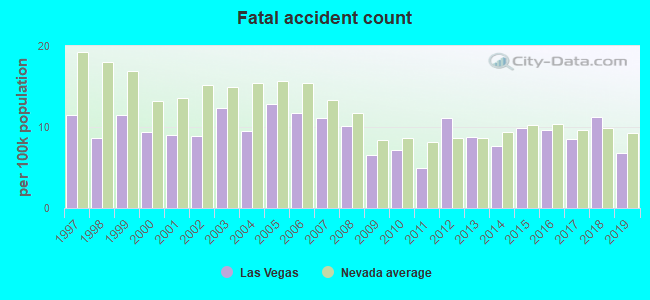
- National Bridge Inventory (NBI) Statistics
- 793Number of bridges
- 12,585ft / 3,836mTotal length
- $111,427,000Total costs
- 28,103,074Total average daily traffic
- 1,412,722Total average daily truck traffic
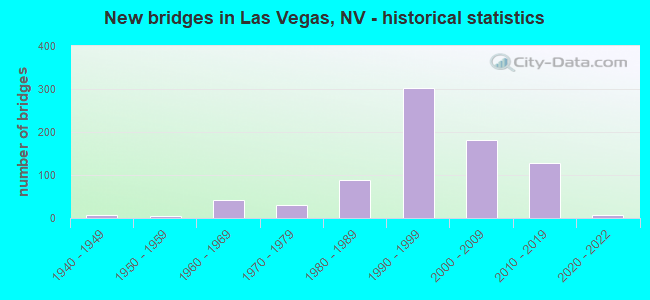
- New bridges - historical statistics
- 11930-1939
- 61940-1949
- 41950-1959
- 431960-1969
- 301970-1979
- 891980-1989
- 3021990-1999
- 1822000-2009
- 1292010-2019
- 72020-2022
FCC Registered Antenna Towers: 4,650 (See the full list of FCC Registered Antenna Towers)
FCC Registered Commercial Land Mobile Towers: 37 (See the full list of FCC Registered Commercial Land Mobile Towers in Las Vegas, NV)
FCC Registered Private Land Mobile Towers: 98 (See the full list of FCC Registered Private Land Mobile Towers)
FCC Registered Broadcast Land Mobile Towers: 1,360 (See the full list of FCC Registered Broadcast Land Mobile Towers)
FCC Registered Microwave Towers: 1,299 (See the full list of FCC Registered Microwave Towers in this town)
FCC Registered Paging Towers: 68 (See the full list of FCC Registered Paging Towers)
FCC Registered Maritime Coast & Aviation Ground Towers: 97 (See the full list of FCC Registered Maritime Coast & Aviation Ground Towers)
FCC Registered Amateur Radio Licenses: 4,988 (See the full list of FCC Registered Amateur Radio Licenses in Las Vegas)
FAA Registered Aircraft Manufacturers and Dealers: 81 (See the full list of FAA Registered Manufacturers and Dealers in Las Vegas)
FAA Registered Aircraft: 1,513 (See the full list of FAA Registered Aircraft)
| Home Mortgage Disclosure Act Aggregated Statistics For Year 2009 (Based on 94 full and 12 partial tracts) | ||||||||||||||
| A) FHA, FSA/RHS & VA Home Purchase Loans | B) Conventional Home Purchase Loans | C) Refinancings | D) Home Improvement Loans | E) Loans on Dwellings For 5+ Families | F) Non-occupant Loans on < 5 Family Dwellings (A B C & D) | G) Loans On Manufactured Home Dwelling (A B C & D) | ||||||||
|---|---|---|---|---|---|---|---|---|---|---|---|---|---|---|
| Number | Average Value | Number | Average Value | Number | Average Value | Number | Average Value | Number | Average Value | Number | Average Value | Number | Average Value | |
| LOANS ORIGINATED | 4,089 | $158,808 | 2,542 | $158,052 | 4,171 | $200,818 | 153 | $89,119 | 5 | $4,824,654 | 1,420 | $124,179 | 36 | $129,120 |
| APPLICATIONS APPROVED, NOT ACCEPTED | 365 | $152,925 | 240 | $156,153 | 543 | $210,438 | 60 | $19,447 | 1 | $140,000 | 166 | $122,201 | 6 | $95,710 |
| APPLICATIONS DENIED | 1,033 | $156,561 | 813 | $161,342 | 2,561 | $218,661 | 307 | $52,226 | 1 | $4,100,000 | 759 | $135,630 | 29 | $68,942 |
| APPLICATIONS WITHDRAWN | 460 | $157,941 | 471 | $161,303 | 1,296 | $205,622 | 76 | $107,516 | 4 | $6,670,308 | 311 | $133,652 | 5 | $73,600 |
| FILES CLOSED FOR INCOMPLETENESS | 121 | $161,243 | 74 | $168,203 | 359 | $206,460 | 22 | $104,159 | 0 | $0 | 72 | $149,644 | 1 | $213,000 |
Detailed mortgage data for all 106 tracts in Las Vegas, NV
| Private Mortgage Insurance Companies Aggregated Statistics For Year 2009 (Based on 83 full and 10 partial tracts) | ||||||
| A) Conventional Home Purchase Loans | B) Refinancings | C) Non-occupant Loans on < 5 Family Dwellings (A & B) | ||||
|---|---|---|---|---|---|---|
| Number | Average Value | Number | Average Value | Number | Average Value | |
| LOANS ORIGINATED | 264 | $192,871 | 60 | $245,695 | 28 | $141,625 |
| APPLICATIONS APPROVED, NOT ACCEPTED | 132 | $198,178 | 29 | $223,909 | 25 | $159,649 |
| APPLICATIONS DENIED | 74 | $188,047 | 23 | $221,403 | 8 | $128,436 |
| APPLICATIONS WITHDRAWN | 24 | $201,327 | 7 | $242,773 | 1 | $121,910 |
| FILES CLOSED FOR INCOMPLETENESS | 23 | $235,739 | 5 | $268,094 | 8 | $169,329 |
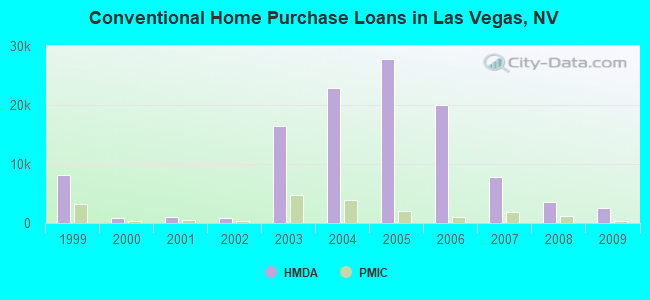
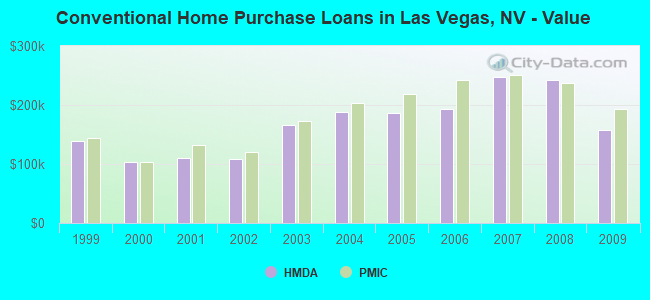
2002 - 2018 National Fire Incident Reporting System (NFIRS) incidents
- Fire incident types reported to NFIRS in Las Vegas, NV
- 29,77848.0%Outside Fires
- 19,38431.2%Structure Fires
- 10,15416.4%Mobile Property/Vehicle Fires
- 2,7494.4%Other
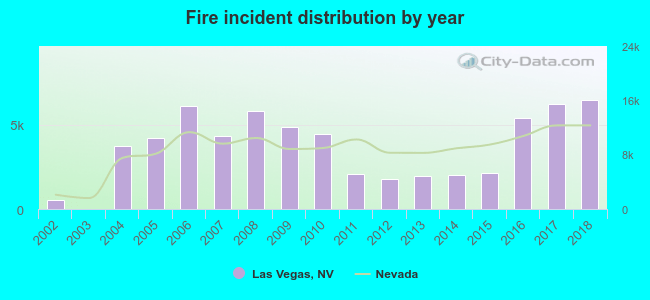 According to the data from the years 2002 - 2018 the average number of fire incidents per year is 3651. The highest number of fires - 6,450 took place in 2018, and the least - 4 in 2003. The data has a growing trend.
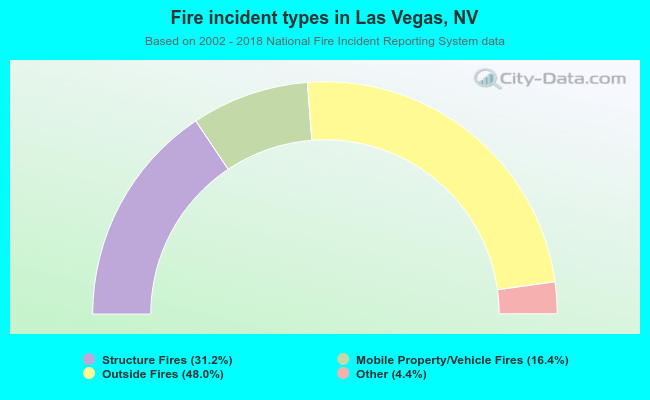 When looking into fire subcategories, the most incidents belonged to: Outside Fires (48.0%), and Structure Fires (31.2%).
Fire-safe hotels and motels in Las Vegas, Nevada:
- Warren Motel Apts, 3965 Las Vegas Blvd S, Las Vegas, Nevada 89119 , Phone: (702) 736-6235
- Best Western Mccarran Inn, 4970 Paradise Rd, Las Vegas, Nevada 89119 , Phone: (702) 798-5530, Fax: (702) 798-7627
- La Quinta Inn-las Vegas Convention CTR 3924, 3970 Paradise Rd, Las Vegas, Nevada 89109 , Phone: (702) 796-9000, Fax: (702) 796-3537
- Flamingo Las Vegas, 3555 Las Vegas Blvd S, Las Vegas, Nevada 89109 , Phone: (702) 733-3110, Fax: (702) 733-3456
- Atrium Suites Hotel, 4255 S Paradise Rd, Las Vegas, Nevada 89109 , Phone: (702) 369-4400, Fax: (702) 369-3770
- The Las Vegas Hotel, 3000 Paradise Rd, Las Vegas, Nevada 89109 , Phone: (702) 732-5111, Fax: (702) 732-5402
- Hooters Casino Hotel, 115 E Tropicana Ave, Las Vegas, Nevada 89109 , Phone: (702) 739-9000, Fax: (702) 739-7783
- Sportsmans Manor, 5660 Bouldes Hwy, Las Vegas, Nevada 89122 , Phone: (702) 458-7071, Fax: (702) 435-1443
- 98 other hotels and motels
| Most common first names in Las Vegas, NV among deceased individuals | ||
| Name | Count | Lived (average) |
|---|---|---|
| John | 3,593 | 71.9 years |
| Robert | 3,231 | 70.1 years |
| William | 2,988 | 71.9 years |
| Mary | 2,664 | 77.4 years |
| James | 2,612 | 70.6 years |
| Joseph | 1,909 | 73.5 years |
| Charles | 1,878 | 71.8 years |
| George | 1,691 | 73.5 years |
| Richard | 1,486 | 67.2 years |
| Helen | 1,365 | 79.0 years |
| Most common last names in Las Vegas, NV among deceased individuals | ||
| Last name | Count | Lived (average) |
|---|---|---|
| Smith | 1,247 | 71.8 years |
| Johnson | 930 | 71.3 years |
| Brown | 675 | 72.2 years |
| Williams | 647 | 70.4 years |
| Miller | 623 | 73.2 years |
| Jones | 601 | 71.6 years |
| Davis | 557 | 72.1 years |
| Anderson | 476 | 72.6 years |
| Wilson | 427 | 71.0 years |
| Moore | 395 | 71.2 years |
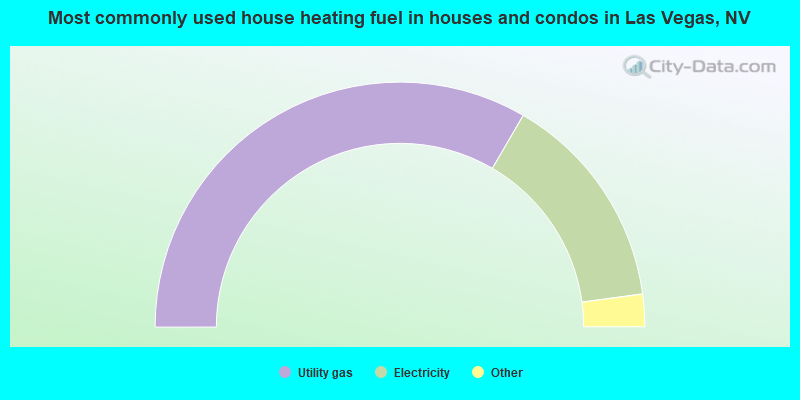
- 66.8%Utility gas
- 28.9%Electricity
- 2.2%Solar energy
- 1.7%Bottled, tank, or LP gas
- 0.2%No fuel used
- 0.1%Other fuel
- 0.1%Wood
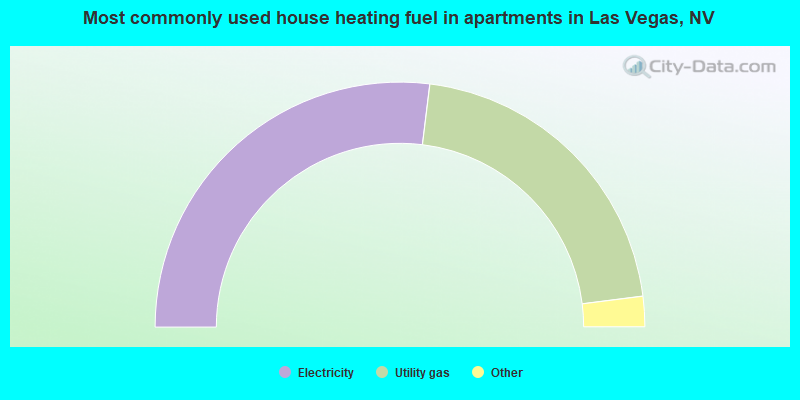
- 53.9%Electricity
- 42.1%Utility gas
- 2.5%Bottled, tank, or LP gas
- 1.3%No fuel used
- 0.2%Solar energy
Las Vegas compared to Nevada state average:
- Unemployed percentage significantly below state average.
- Black race population percentage above state average.
- Median age below state average.
- Foreign-born population percentage above state average.
- Length of stay since moving in below state average.
Las Vegas, NV compared to other similar cities:
Las Vegas on our top lists:
- #2 on the list of "Top 101 cities with the lowest maximum monthly morning or afternoon humidity (population 50,000+)"
- #2 on the list of "Top 101 cities with the lowest minimum monthly morning or afternoon humidity (population 50,000+)"
- #2 on the list of "Top 101 cities with the lowest average humidity (population 50,000+)"
- #7 on the list of "Top 100 cities with strongest arts, entertainment, recreation, accommodation and food services industries (pop. 50,000+)"
- #8 on the list of "Top 101 cities with largest percentage of females in industries: accommodation and food services (population 50,000+)"
- #10 on the list of "Top 101 cities with largest percentage of males in industries: accommodation and food services (population 50,000+)"
- #10 on the list of "Top 101 cities with the smallest precipitation differences during a year (population 50,000+)"
- #10 on the list of "Top 101 cities with largest percentage of females in industries: arts, entertainment, and recreation (population 50,000+)"
- #12 on the list of "Top 101 cities with largest percentage of males in occupations: personal care and service occupations (population 50,000+)"
- #12 on the list of "Top 101 cities with the lowest average yearly precipitation (population 50,000+)"
- #12 on the list of "Top 101 cities with largest percentage of males in industries: arts, entertainment, and recreation (population 50,000+)"
- #18 on the list of "Top 101 cities with the highest average sunshine amount (population 50,000+)"
- #18 on the list of "Top 101 cities with the highest number of days clear of clouds (population 50,000+)"
- #18 on the list of "Top 101 cities with the lowest number of days clear of clouds (population 50,000+)"
- #21 on the list of "Top 101 cities with largest percentage of females in occupations: building and grounds cleaning and maintenance occupations (population 50,000+)"
- #28 on the list of "Top 101 cities with largest percentage of males in occupations: fire fighting and prevention workers including supervisors (population 50,000+)"
- #29 on the list of "Top 101 cities with the most mentions on city-data.com forum"
- #30 on the list of "Top 101 cities with the highest daily high temperatures (population 50,000+)"
- #30 on the list of "Top 101 cities with the hottest summers (population 50,000+)"
- #35 on the list of "Top 101 biggest cities in 2013"
- #1 (89109) on the list of "Top 101 zip codes with the most big companies in 2005 (at least 1000 employees)"
- #1 (89109) on the list of "Top 101 zip codes with the most casinos in 2005"
- #3 (89109) on the list of "Top 101 zip codes with the highest 2012 average taxable interest for individuals (pop 5,000+)"
- #7 (89109) on the list of "Top 101 zip codes with the highest 2012 average net capital gain/loss (pop 5,000+)"
- #8 (89109) on the list of "Top 101 zip codes with the most medium-big companies in 2005 (at least 100 employees)"
- #11 (89109) on the list of "Top 101 zip codes with the most Internet business establishments in 2005"
- #13 (89109) on the list of "Top 101 zip codes with the most finance and insurance companies in 2005"
- #15 (89109) on the list of "Top 101 zip codes with the most full service restaurants in 2005"
- #19 (89030) on the list of "Top 101 zip codes with the smallest percentage of taxpayers reporting net capital gain/loss in 2012 (pop 1,000+)"
- #20 (89109) on the list of "Top 101 zip codes with the most alcohol drinking places in 2005"
- #24 (89101) on the list of "Top 101 zip codes with the most offices of lawyers in 2005"
- #35 (89134) on the list of "Top 101 zip codes with the smallest percentage of returns reporting salary or wage in 2012 (pop 5,000+)"
- #40 (89109) on the list of "Top 101 zip codes with the most hotels or motels in 2005"
- #41 (89109) on the list of "Top 101 zip codes with the most offices of physicians in 2005"
- #47 (89109) on the list of "Top 101 zip codes with the most museums in 2005"
- #50 (89030) on the list of "Top 101 zip codes with the smallest percentage of taxpayers reporting taxable interest in 2012 (pop 5,000+)"
- #99 (89109) on the list of "Top 101 zip codes with the highest 2012 average Adjusted Gross Income (AGI) for individuals (pop 5,000+)"
- #7 on the list of "Top 101 counties with the highest total withdrawal of fresh water for public supply"
- #9 on the list of "Top 101 counties with the highest surface withdrawal of fresh water for public supply"
- #9 on the list of "Top 101 counties with the highest carbon monoxide air pollution readings in 2012 (ppm)"
- #12 on the list of "Top 101 counties with the most Other adherents"
- #13 on the list of "Top 101 counties with the most Other congregations (pop. 50,000+)"
State forum archive:
- Nevada Pages: 2 3 4 5 6 7 8
- Las Vegas Pages: 2 3 4 5 6 7 8 9 10 11 12 13 14 15 16 17 18 19 20 21 22 23 24 25 26 27 28 29 30 31 32 33 34 35 36 37 38 39 40 41 42 43 44 45 46 47 48 49 50 51 52 53 54 55 56 57 58 59 60 61 62 63 64 65 66 67 68 69 70 71 72 73 74 75 76 77 78 79 80 81 82 83 84 85 86 87 88 89 90 91 92 93 94 95 96 97 98 99
- Reno-Sparks area Pages: 2 3 4 5 6 7 8 9

|
|
Total of 5155 patent applications in 2008-2024.


