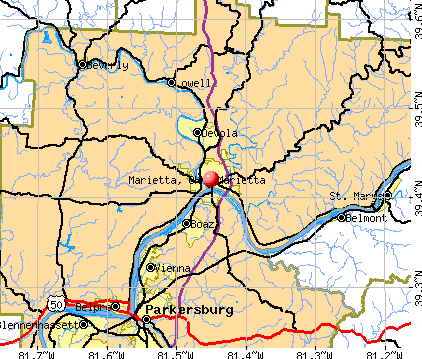
Marietta, Ohio

Marietta: Putnam Street - Downtown - Marietta, Ohio
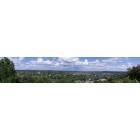
Marietta: panoramic of down town marietta
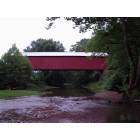
Marietta: Hune Bridge
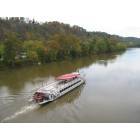
Marietta: The Valley Gem Sternwheeler cruises from Marietta, Ohio
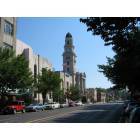
Marietta: Downtown Marietta, Ohio - Putnam Street - Courthouse
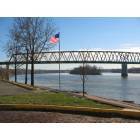
Marietta: American Flag at Ohio River - Marietta, Ohio 45750

Marietta: Ohio River at Marietta OH December 31, 2007
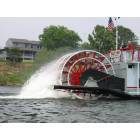
Marietta: The Valley Gem Sternwheeler cruises from Marietta, Ohio

Marietta: Marietta College - Entrance at Fifth Street

Marietta: Ohio River Bridge between Marietta and Williamstown
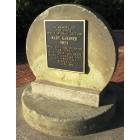
Marietta: First White Woman Settler 1788 Historical Marker Marietta OH
- see
19
more - add
your
Submit your own pictures of this city and show them to the world
- OSM Map
- General Map
- Google Map
- MSN Map
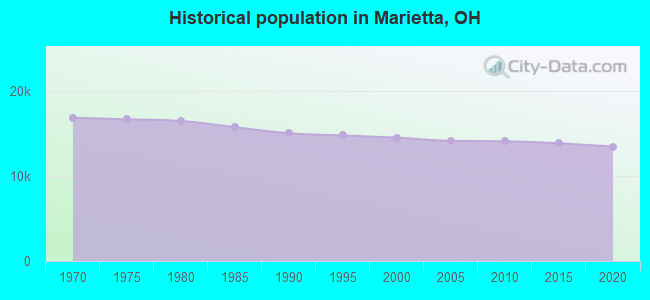
Population change since 2000: -9.2%
 |
| Males: 6,534 | |
| Females: 6,644 |
| Median resident age: | 39.7 years |
| Ohio median age: | 39.9 years |
Zip codes: 45750.
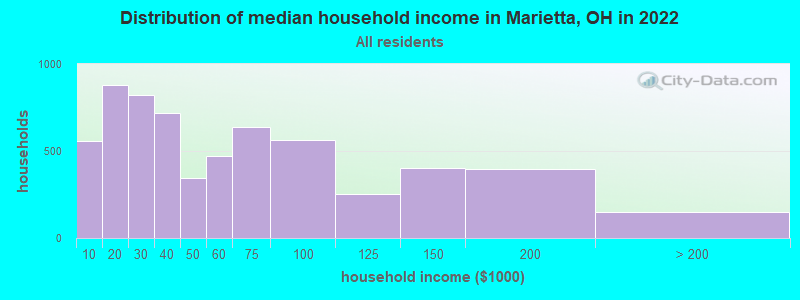
| Marietta: | $43,559 |
| OH: | $65,720 |
Estimated per capita income in 2022: $36,584 (it was $18,021 in 2000)
Marietta city income, earnings, and wages data
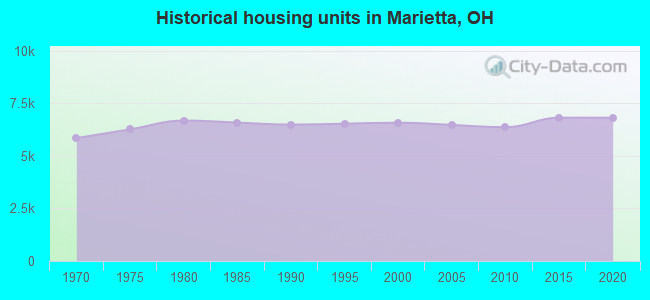
Estimated median house or condo value in 2022: $159,450 (it was $73,300 in 2000)
| Marietta: | $159,450 |
| OH: | $204,100 |
Mean prices in 2022: all housing units: $187,575; detached houses: $187,628; townhouses or other attached units: $346,192; in 2-unit structures: $191,758; in 5-or-more-unit structures: $393,112; mobile homes: $10,153
Median gross rent in 2022: $784.
(20.9% for White Non-Hispanic residents, 42.1% for Black residents, 22.6% for Hispanic or Latino residents, 100.0% for American Indian residents, 78.3% for other race residents, 44.6% for two or more races residents)
Detailed information about poverty and poor residents in Marietta, OH


Compare current foreclosures near Marietta, OH:
| Photo | Address | Area | Beds / Baths | Price | Details |
|---|---|---|---|---|---|

|
#1
Wells Ave
Marietta, OH 45750
|
1,512 sq. feet
|
- baths 3 beds |
show details | |

|
#2
Browns Rd
Marietta, OH 45750
|
1,944 sq. feet
|
- baths 4 beds |
show details | |

|
#3
Summers Rd
Marietta, OH 45750
|
1,664 sq. feet
|
- baths 5 beds |
show details | |

|
#4
Maple St
Marietta, OH 45750
|
808 sq. feet
|
- baths 3 beds |
show details | |

|
#5
Warner St
Marietta, OH 45750
|
1,920 sq. feet
|
- baths 4 beds |
show details | |

|
#6
9th St
Marietta, OH 45750
|
1,506 sq. feet
|
- baths 2 beds |
show details | |

|
#7
Greenhill Rd
Marietta, OH 45750
|
2,016 sq. feet
|
- baths 3 beds |
show details | |

|
#8
E Montgomery St
Marietta, OH 45750
|
1,670 sq. feet
|
- baths 3 beds |
show details | |

|
#9
Muskingum Dr
Marietta, OH 45750
|
1,820 sq. feet
|
- baths 3 beds |
show details | |

|
#10
Marietta Ln
Marietta, OH 45750
|
- sq. feet
|
- baths - beds |
show details |
| Photo | Address | Area | Beds / Baths | Price | Details |
|---|---|---|---|---|---|

|
#11
Vine St # B
Marietta, OH 45750
|
- sq. feet
|
- baths - beds |
show details | |

|
#12
Melody Ln
Marietta, OH 45750
|
- sq. feet
|
- baths - beds |
show details | |

|
#13
Browns Rd
Marietta, OH 45750
|
- sq. feet
|
- baths - beds |
show details | |

|
#14
Clark St
Marietta, OH 45750
|
- sq. feet
|
- baths - beds |
show details | |

|
#15
Millgate Rd
Marietta, OH 45750
|
- sq. feet
|
- baths - beds |
show details | |

|
#16
Christy Rd
Marietta, OH 45750
|
- sq. feet
|
- baths - beds |
show details | |

|
#17
Sandhill Rd
Marietta, OH 45750
|
- sq. feet
|
- baths - beds |
show details | |

|
#18
Newells Run Rd
Newport, OH 45768
|
1,722 sq. feet
|
2 baths 3 beds |
$84,500
|
show details |

|
#19
Edwin St
Parkersburg, WV 26101
|
1,236 sq. feet
|
2 baths 3 beds |
$22,500
|
show details |

|
#20
Maple St
Parkersburg, WV 26101
|
672 sq. feet
|
1 baths 2 beds |
$105,000
|
show details |
| Photo | Address | Area | Beds / Baths | Price | Details |
|---|---|---|---|---|---|

|
#21
Utah Ln
Parkersburg, WV 26104
|
1,272 sq. feet
|
2 baths 3 beds |
$74,500
|
show details |

|
#22
36th St
Parkersburg, WV 26104
|
1,819 sq. feet
|
2 baths 3 beds |
$69,900
|
show details |

|
#23
Sycamore St
Saint Marys, WV 26170
|
1,351 sq. feet
|
1 baths 3 beds |
show details | |

|
#24
Hebron Rd
Saint Marys, WV 26170
|
2,134 sq. feet
|
2 baths 4 beds |
show details | |

|
#25
Myrtle St
Parkersburg, WV 26101
|
952 sq. feet
|
1 baths 3 beds |
show details | |

|
#26
Camden Ave
Parkersburg, WV 26101
|
- sq. feet
|
- baths - beds |
$21,900
|
show details |

|
#27
30th St
Parkersburg, WV 26104
|
1,436 sq. feet
|
1 baths 3 beds |
show details | |

|
#28
Mary St
Parkersburg, WV 26101
|
1 sq. feet
|
1 baths 2 beds |
show details | |

|
#29
Lincoln St
Parkersburg, WV 26104
|
1,248 sq. feet
|
1 baths 2 beds |
show details | |

|
#30
Central Ave
Williamstown, WV 26187
|
1,852 sq. feet
|
3 baths 4 beds |
show details |
| Photo | Address | Area | Beds / Baths | Price | Details |
|---|---|---|---|---|---|

|
#31
Broad St
Parkersburg, WV 26104
|
- sq. feet
|
1 baths 3 beds |
show details | |

|
#32
Northwood Dr
Parkersburg, WV 26104
|
1,796 sq. feet
|
1 baths 3 beds |
show details | |

|
#33
Capital Dr
Parkersburg, WV 26101
|
1,790 sq. feet
|
1 baths 3 beds |
show details | |

|
#34
17th Ave
Parkersburg, WV 26101
|
760 sq. feet
|
1 baths 2 beds |
show details | |

|
#35
Briarwood Pl
Parkersburg, WV 26104
|
2,290 sq. feet
|
2 baths 4 beds |
show details | |

|
#36
Gale Ave
Newport, OH 45768
|
1,290 sq. feet
|
- baths 2 beds |
show details | |

|
#37
Wiley St
Belpre, OH 45714
|
1,078 sq. feet
|
- baths 3 beds |
show details | |

|
#38
Grant Ave
Belpre, OH 45714
|
2,196 sq. feet
|
- baths 3 beds |
show details | |

|
#39
Luke Chute Rd
Waterford, OH 45786
|
952 sq. feet
|
- baths 2 beds |
show details | |

|
#40
Florence St
Belpre, OH 45714
|
1,402 sq. feet
|
- baths 2 beds |
show details |
| Photo | Address | Area | Beds / Baths | Price | Details |
|---|---|---|---|---|---|

|
#41
Warren Chapel Rd
Fleming, OH 45729
|
1,544 sq. feet
|
- baths 2 beds |
show details | |

|
#42
Emerson Ave
Parkersburg, WV 26104
|
- sq. feet
|
- baths - beds |
show details | |

|
#43
Kittle St
Williamstown, WV 26187
|
- sq. feet
|
- baths - beds |
show details | |

|
#44
Lebanon Rd
Lower Salem, OH 45745
|
- sq. feet
|
- baths - beds |
show details | |

|
#45
Broad Run Rd
Saint Marys, WV 26170
|
- sq. feet
|
- baths - beds |
show details | |

|
#46
4th St
Lowell, OH 45744
|
- sq. feet
|
- baths - beds |
show details | |

|
#47
Harris Hwy # 3
Parkersburg, WV 26101
|
- sq. feet
|
- baths - beds |
show details | |

|
#48
Island View Dr
Parkersburg, WV 26101
|
- sq. feet
|
- baths - beds |
show details | |

|
#49
Bells Run Rd
Newport, OH 45768
|
- sq. feet
|
- baths - beds |
show details | |

|
Check over 1 million property listings on Foreclosure.com!
|
browse all offers | |||


- 12,07890.5%White alone
- 3322.5%Two or more races
- 2952.2%Black alone
- 2792.1%Hispanic
- 2191.6%Asian alone
- 540.4%Other race alone
- 70.05%American Indian alone
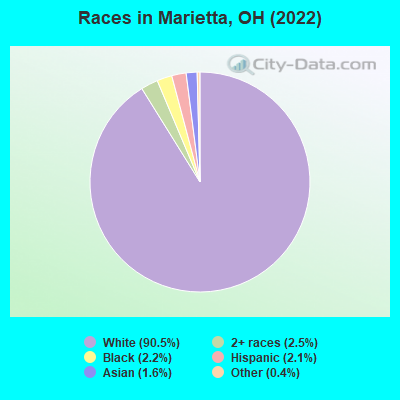
Races in Marietta detailed stats: ancestries, foreign born residents, place of birth
According to our research of Ohio and other state lists, there were 61 registered sex offenders living in Marietta, Ohio as of April 19, 2024.
The ratio of all residents to sex offenders in Marietta is 229 to 1.
Type |
2009 |
2010 |
2011 |
2012 |
2013 |
2014 |
2015 |
2016 |
2017 |
2018 |
2019 |
2020 |
2021 |
2022 |
|---|---|---|---|---|---|---|---|---|---|---|---|---|---|---|
| Murders (per 100,000) | 0 (0.0) | 0 (0.0) | 0 (0.0) | 0 (0.0) | 0 (0.0) | 0 (0.0) | 0 (0.0) | 0 (0.0) | 0 (0.0) | 0 (0.0) | 1 (7.4) | 0 (0.0) | 0 (0.0) | 0 (0.0) |
| Rapes (per 100,000) | 10 (70.1) | 9 (63.9) | 3 (21.3) | 1 (7.1) | 6 (42.8) | 3 (21.4) | 8 (57.4) | 3 (21.6) | 11 (81.0) | 11 (80.8) | 16 (118.1) | 4 (30.1) | 7 (52.7) | 6 (44.9) |
| Robberies (per 100,000) | 9 (63.1) | 6 (42.6) | 4 (28.4) | 4 (28.4) | 7 (50.0) | 1 (7.1) | 1 (7.2) | 6 (43.3) | 2 (14.7) | 3 (22.0) | 0 (0.0) | 7 (52.7) | 1 (7.5) | 0 (0.0) |
| Assaults (per 100,000) | 7 (49.0) | 5 (35.5) | 9 (63.9) | 6 (42.6) | 8 (57.1) | 6 (42.7) | 4 (28.7) | 7 (50.5) | 10 (73.6) | 16 (117.5) | 16 (118.1) | 10 (75.3) | 16 (120.3) | 4 (29.9) |
| Burglaries (per 100,000) | 88 (616.6) | 69 (489.9) | 42 (298.0) | 26 (184.7) | 20 (142.7) | 23 (163.7) | 27 (193.9) | 43 (310.1) | 42 (309.2) | 32 (235.0) | 26 (191.9) | 22 (165.7) | 24 (180.5) | 9 (67.3) |
| Thefts (per 100,000) | 348 (2,438) | 285 (2,023) | 196 (1,391) | 190 (1,350) | 186 (1,327) | 139 (989.3) | 151 (1,084) | 201 (1,449) | 206 (1,517) | 252 (1,850) | 195 (1,439) | 172 (1,295) | 227 (1,707) | 221 (1,653) |
| Auto thefts (per 100,000) | 15 (105.1) | 6 (42.6) | 8 (56.8) | 9 (63.9) | 8 (57.1) | 4 (28.5) | 10 (71.8) | 7 (50.5) | 17 (125.2) | 13 (95.5) | 4 (29.5) | 9 (67.8) | 10 (75.2) | 3 (22.4) |
| Arson (per 100,000) | 1 (7.0) | 2 (14.2) | 3 (21.3) | 1 (7.1) | 0 (0.0) | 0 (0.0) | 2 (14.4) | 3 (21.6) | 2 (14.7) | 1 (7.3) | 2 (14.8) | 2 (15.1) | 2 (15.0) | 1 (7.5) |
| City-Data.com crime index | 233.9 | 189.6 | 119.3 | 94.8 | 128.3 | 81.1 | 116.5 | 124.1 | 176.3 | 192.8 | 206.2 | 123.8 | 155.4 | 114.5 |
The City-Data.com crime index weighs serious crimes and violent crimes more heavily. Higher means more crime, U.S. average is 246.1. It adjusts for the number of visitors and daily workers commuting into cities.
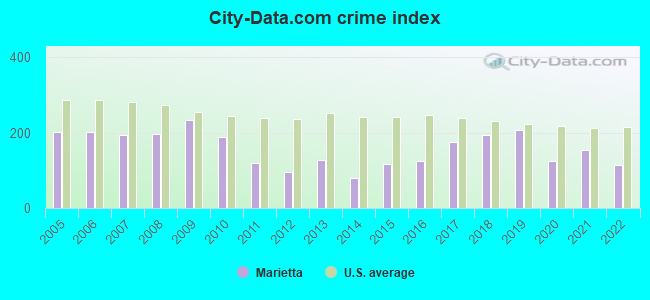
Crime rate in Marietta detailed stats: murders, rapes, robberies, assaults, burglaries, thefts, arson
Full-time law enforcement employees in 2013, including police officers: 37 (31 officers - 29 male; 2 female).
| Officers per 1,000 residents here: | 2.21 |
| Ohio average: | 2.45 |
 Recent articles from our blog. Our writers, many of them Ph.D. graduates or candidates, create easy-to-read articles on a wide variety of topics.

 | Looking at options: Marietta, OH (7 replies) |
| What is Ohio Culture? (76 replies) |
| curious about Marietta OH (13 replies) |
| How Do People Out of Town React When You Say You're From Ohio? (93 replies) |
| Marietta makes a best-of list (again) (7 replies) |
| Young family potentially relocating to Marietta, OH area (9 replies) |
Latest news from Marietta, OH collected exclusively by city-data.com from local newspapers, TV, and radio stations
Ancestries: German (22.0%), American (18.3%), English (13.0%), Irish (11.1%), Polish (3.0%), European (2.6%).
Current Local Time: EST time zone
Elevation: 616 feet
Land area: 8.31 square miles.
Population density: 1,586 people per square mile (low).
491 residents are foreign born (1.7% Asia, 1.2% Europe).
| This city: | 3.7% |
| Ohio: | 4.9% |
Median real estate property taxes paid for housing units with mortgages in 2022: $1,497 (0.8%)
Median real estate property taxes paid for housing units with no mortgage in 2022: $1,296 (1.0%)
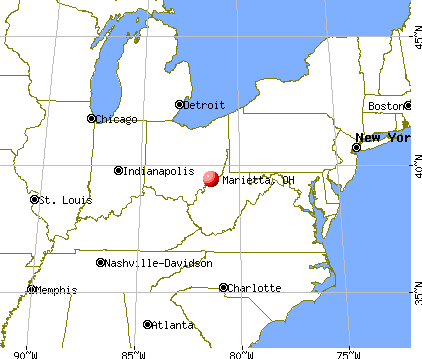
Nearest city with pop. 50,000+: Charleston, WV  (74.8 miles , pop. 53,421).
Nearest city with pop. 200,000+: Columbus, OH (91.0 miles , pop. 711,470).
Nearest city with pop. 1,000,000+: Philadelphia, PA (337.8 miles , pop. 1,517,550).
Nearest cities:
), ), ), ), ), ), )Latitude: 39.42 N, Longitude: 81.45 W
Daytime population change due to commuting: +7,148 (+53.6%)
Workers who live and work in this city: 3,971 (66.1%)
Area code: 740

Marietta, Ohio accommodation & food services, waste management - Economy and Business Data
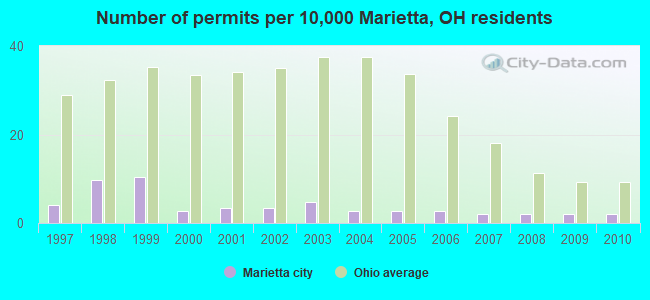
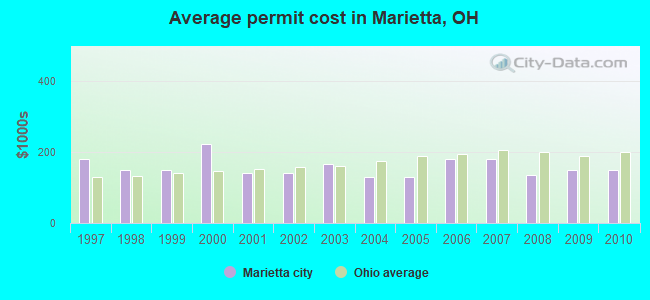
Single-family new house construction building permits:
- 2010: 3 buildings, average cost: $150,000
- 2009: 3 buildings, average cost: $150,000
- 2008: 3 buildings, average cost: $136,000
- 2007: 3 buildings, average cost: $180,500
- 2006: 4 buildings, average cost: $180,500
- 2005: 4 buildings, average cost: $129,600
- 2004: 4 buildings, average cost: $129,600
- 2003: 7 buildings, average cost: $165,500
- 2002: 5 buildings, average cost: $139,800
- 2001: 5 buildings, average cost: $139,800
- 2000: 4 buildings, average cost: $221,800
- 1999: 15 buildings, average cost: $149,100
- 1998: 14 buildings, average cost: $149,100
- 1997: 6 buildings, average cost: $179,300
| Here: | 4.0% |
| Ohio: | 3.1% |
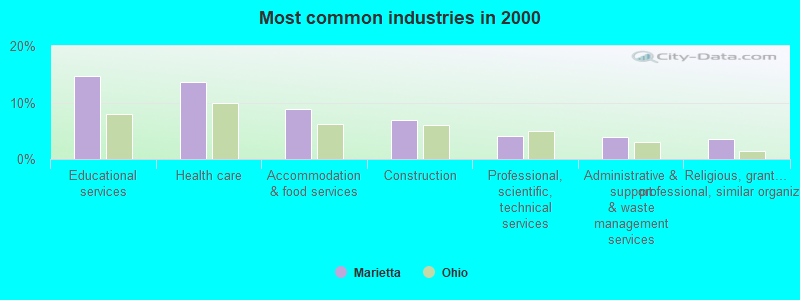
- Educational services (14.6%)
- Health care (13.6%)
- Accommodation & food services (8.8%)
- Construction (6.9%)
- Professional, scientific, technical services (4.0%)
- Administrative & support & waste management services (3.8%)
- Religious, grantmaking, civic, professional, similar organizations (3.5%)
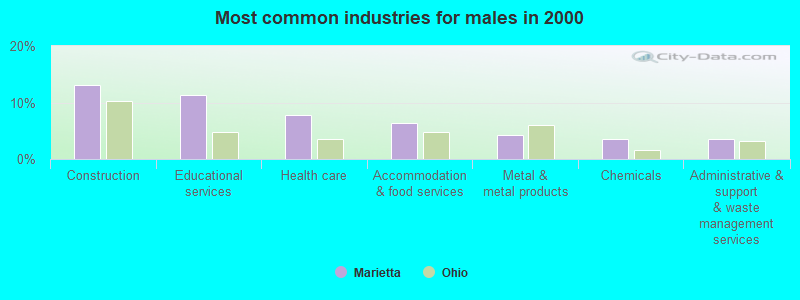
- Construction (13.0%)
- Educational services (11.3%)
- Health care (7.8%)
- Accommodation & food services (6.4%)
- Metal & metal products (4.2%)
- Chemicals (3.6%)
- Administrative & support & waste management services (3.6%)
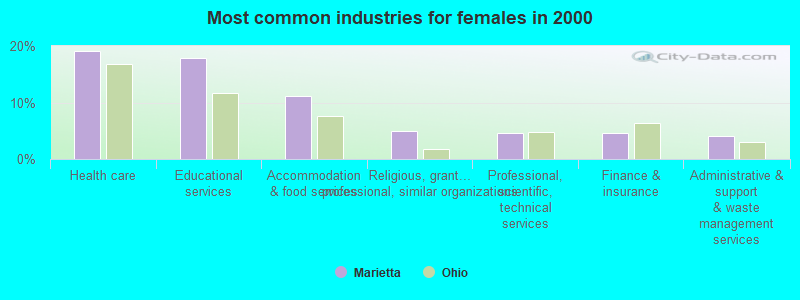
- Health care (19.1%)
- Educational services (17.8%)
- Accommodation & food services (11.2%)
- Religious, grantmaking, civic, professional, similar organizations (4.9%)
- Professional, scientific, technical services (4.7%)
- Finance & insurance (4.6%)
- Administrative & support & waste management services (4.1%)
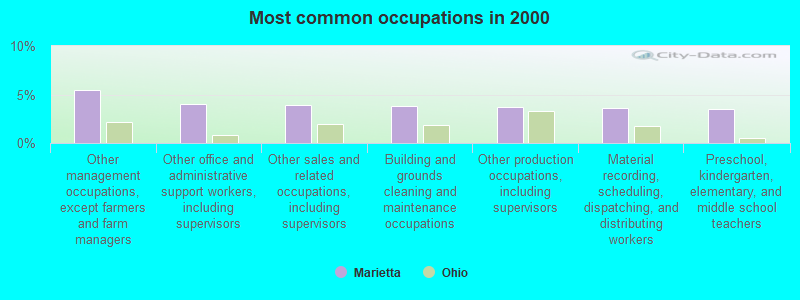
- Other management occupations, except farmers and farm managers (5.4%)
- Other office and administrative support workers, including supervisors (4.0%)
- Other sales and related occupations, including supervisors (3.9%)
- Building and grounds cleaning and maintenance occupations (3.8%)
- Other production occupations, including supervisors (3.8%)
- Material recording, scheduling, dispatching, and distributing workers (3.6%)
- Preschool, kindergarten, elementary, and middle school teachers (3.5%)
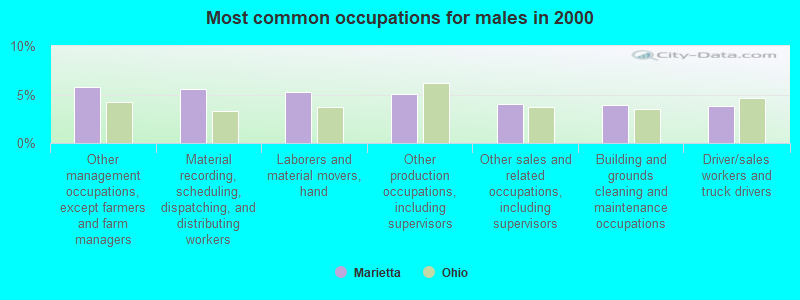
- Other management occupations, except farmers and farm managers (5.8%)
- Material recording, scheduling, dispatching, and distributing workers (5.6%)
- Laborers and material movers, hand (5.3%)
- Other production occupations, including supervisors (5.1%)
- Other sales and related occupations, including supervisors (4.1%)
- Building and grounds cleaning and maintenance occupations (3.9%)
- Driver/sales workers and truck drivers (3.9%)
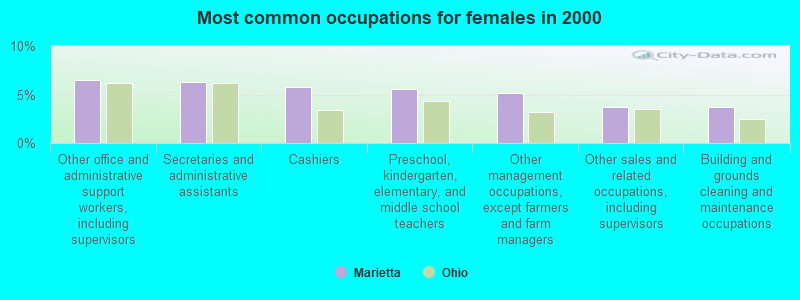
- Other office and administrative support workers, including supervisors (6.5%)
- Secretaries and administrative assistants (6.3%)
- Cashiers (5.8%)
- Preschool, kindergarten, elementary, and middle school teachers (5.5%)
- Other management occupations, except farmers and farm managers (5.1%)
- Other sales and related occupations, including supervisors (3.8%)
- Building and grounds cleaning and maintenance occupations (3.7%)
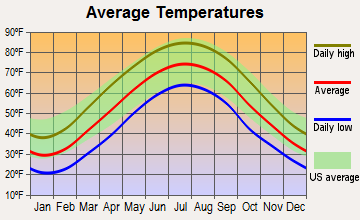
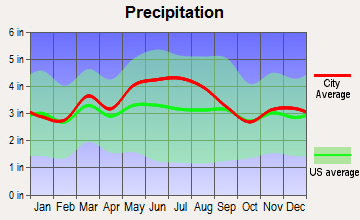
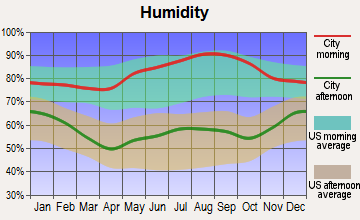
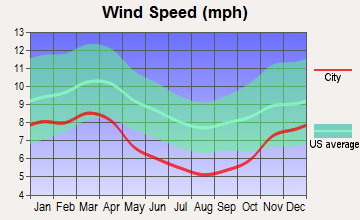
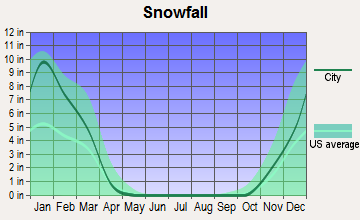
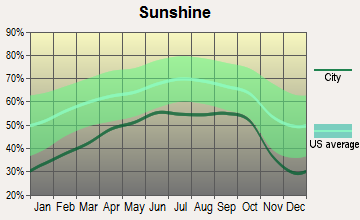
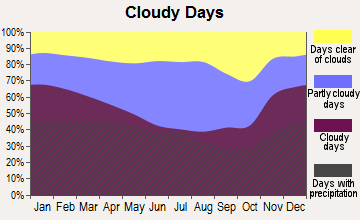
Average climate in Marietta, Ohio
Based on data reported by over 4,000 weather stations
|
|

(lower is better)
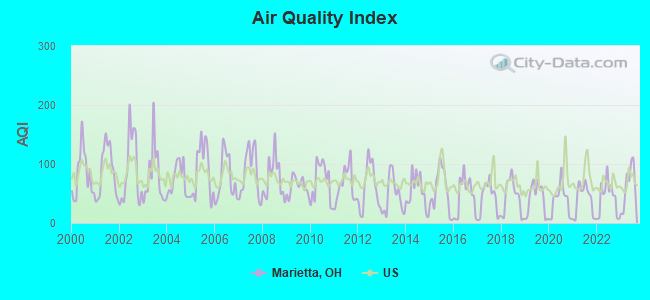
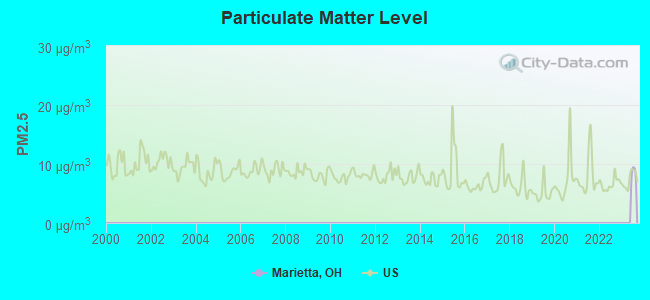
Air Quality Index (AQI) level in 2023 was 64.0. This is about average.
| City: | 64.0 |
| U.S.: | 72.6 |
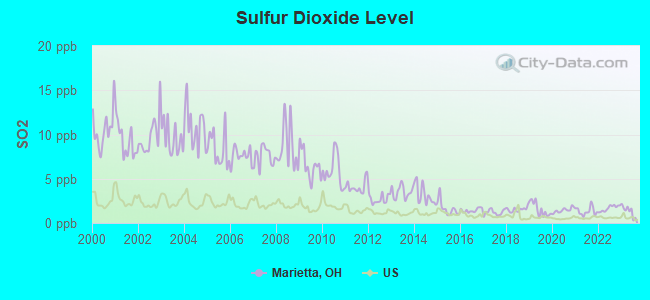
Sulfur Dioxide (SO2) [ppb] level in 2023 was 1.36. This is about average. Closest monitor was 0.7 miles away from the city center.
| City: | 1.36 |
| U.S.: | 1.51 |
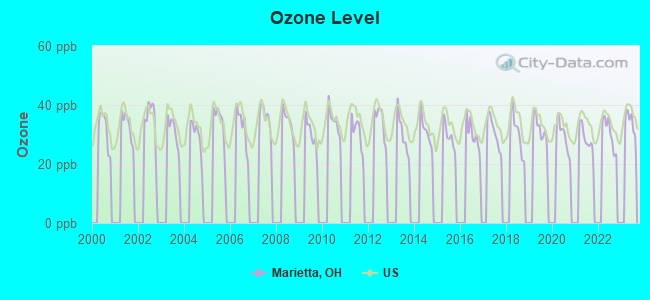
Ozone [ppb] level in 2022 was 30.5. This is about average. Closest monitor was 0.9 miles away from the city center.
| City: | 30.5 |
| U.S.: | 33.3 |
Tornado activity:
Marietta-area historical tornado activity is significantly below Ohio state average. It is 57% smaller than the overall U.S. average.
On 4/23/1968, a category F5 (max. wind speeds 261-318 mph) tornado 57.8 miles away from the Marietta city center killed 7 people and injured 93 people and caused between $500,000 and $5,000,000 in damages.
On 10/1/1986, a category F3 (max. wind speeds 158-206 mph) tornado 36.8 miles away from the city center injured one person and caused between $50,000 and $500,000 in damages.
Earthquake activity:
Marietta-area historical earthquake activity is significantly above Ohio state average. It is 22% smaller than the overall U.S. average.On 8/23/2011 at 17:51:04, a magnitude 5.8 (5.8 MW, Depth: 3.7 mi, Class: Moderate, Intensity: VI - VII) earthquake occurred 216.6 miles away from the city center
On 9/25/1998 at 19:52:52, a magnitude 5.2 (4.8 MB, 4.3 MS, 5.2 LG, 4.5 MW, Depth: 3.1 mi) earthquake occurred 153.6 miles away from the city center
On 7/27/1980 at 18:52:21, a magnitude 5.2 (5.1 MB, 4.7 MS, 5.0 UK, 5.2 UK) earthquake occurred 158.5 miles away from the city center
On 1/31/1986 at 16:46:43, a magnitude 5.0 (5.0 MB) earthquake occurred 151.6 miles away from the city center
On 8/9/2020 at 12:07:37, a magnitude 5.1 (5.1 MW, Depth: 4.7 mi) earthquake occurred 204.6 miles away from Marietta center
On 9/7/1988 at 02:28:09, a magnitude 4.6 (4.5 MB, 4.6 LG, Class: Light, Intensity: IV - V) earthquake occurred 157.9 miles away from Marietta center
Magnitude types: regional Lg-wave magnitude (LG), body-wave magnitude (MB), surface-wave magnitude (MS), moment magnitude (MW)
Natural disasters:
The number of natural disasters in Washington County (17) is near the US average (15).Major Disasters (Presidential) Declared: 11
Emergencies Declared: 3
Causes of natural disasters: Floods: 10, Storms: 10, Mudslides: 4, Landslides: 3, Snowstorms: 2, Blizzard: 1, Heavy Rain: 1, Hurricane: 1, Tornado: 1, Wind: 1, Winter Storm: 1, Other: 1 (Note: some incidents may be assigned to more than one category).

Main business address for: PEOPLES BANCORP INC (NATIONAL COMMERCIAL BANKS).
Hospitals in Marietta:
- MARIETTA MEMORIAL HOSPITAL (Voluntary non-profit - Other, provides emergency services, 401 MATTHEW STREET)
- SELBY GENERAL HOSPITAL (Voluntary non-profit - Private, 1106 COLEGATE DRIVE)
- VENCARE HOSPICE - MARIETTA (476 PIKE STREET)
- VOCA OF OHIO/GARFIELD GROUP HM (914 GARFIELD AVENUE)
- VOCA OF OHIO/HILLCREST GROUP HOME (219 HILLCREST DRIVE)
- VOCA OF OHIO/MONTGOMERY GH (513 MONTGOMERY STREET)
Nursing Homes in Marietta:
- ARBORS AT MARIETTA (400 SEVENTH STREET)
- HARMAR PLACE REHAB AND EXTENDED CARE (401 HARMAR STREET)
- HEARTLAND OF MARIETTA (5001 STATE ROUTE 60)
- MARIETTA CARE AND REHAB CTR (117 BARTLETT STREET)
- MARIETTA CONV CTR (117 BARTLETT ST)
Dialysis Facilities in Marietta:
- DAVITA - MARIETTA DIALYSIS (1019 PIKE STREET)
- FMC - DIALYSIS SPECIALISTS OF MARIETTA (14-16 ACME STREET)
Home Health Centers in Marietta:
Heliports located in Marietta:
See details about Heliports located in Marietta, OHColleges/Universities in Marietta:
- Marietta College (Full-time enrollment: 1,677; Location: Irvine Bldg; Private, not-for-profit; Website: www.marietta.edu; Offers Master's degree)
- Washington State Community College (Full-time enrollment: 1,346; Location: 710 Colegate Dr; Public; Website: www.wscc.edu)
- Washington County Career Center-Adult Technical Training (Full-time enrollment: 105; Location: 21740 St. Rt. 676; Public; Website: www.mycareerschool.com)
Colleges/universities with over 2000 students nearest to Marietta:
- West Virginia University at Parkersburg (about 15 miles; Parkersburg, WV; Full-time enrollment: 2,619)
- Ohio University-Main Campus (about 36 miles; Athens, OH; FT enrollment: 26,181)
- Hocking College (about 42 miles; Nelsonville, OH; FT enrollment: 4,146)
- Muskingum University (about 43 miles; New Concord, OH; FT enrollment: 2,073)
- Zane State College (about 49 miles; Zanesville, OH; FT enrollment: 2,200)
- West Liberty University (about 69 miles; West Liberty, WV; FT enrollment: 2,728)
- Fairmont State University (about 69 miles; Fairmont, WV; FT enrollment: 3,714)
Public high schools in Marietta:
- MARIETTA HIGH SCHOOL (Students: 964, Location: 208 DAVIS AVE, Grades: 9-12)
- MARIETTA MIDDLE SCHOOL (Students: 678, Location: 242 N 7TH ST, Grades: 6-9)
- WASHINGTON COUNTY CC USE 051706 (Location: 21740 STATE ROUTE 676, Grades: 11-12)
Private high school in Marietta:
Public elementary/middle schools in Marietta:
- WARREN ELEMENTARY SCHOOL (Students: 446, Location: 16885 STATE ROUTE 550, Grades: KG-8)
- PHILLIPS ELEMENTARY SCHOOL (Students: 415, Location: 300 PIKE ST, Grades: KG-5)
- WASHINGTON ELEMENTARY SCHOOL (Students: 373, Location: 401 WASHINGTON ST, Grades: KG-5)
- HARMAR ELEMENTARY SCHOOL (Students: 314, Location: 100 FORT SQ, Grades: KG-5)
- PUTNAM ELEMENTARY SCHOOL (Students: 267, Location: 598 MASONIC PARK RD, Grades: KG-6)
Private elementary/middle schools in Marietta:
User-submitted facts and corrections:
- North Hills School is closed permant due to funds
- North Hills School is closed permant due to funds
- Valley Beauty School has been closed since November of 2003 due to a fire that destroyed 4 buildings on Front Street. The owners have a salon located on Putnam Street now, but they do not operate a school there.
Points of interest:
Notable locations in Marietta: Washington County Fairgrounds (A), Marietta Industrial Park (B), Don Drumm Stadium (C), Washington County Courthouse (D), Campus Martius Museum (E), Marietta Fire Department Station 3 (F), Childrens Toy and Doll Museum (G), Butchs Cola Museum (H), William Bay Irvine Administration Building (I), Parsons Hall (J), Mills Hall (K), Mary O Beach Hall (L), Marietta City Hall (M), Gilman Student Center (N), Marietta Fire Department Station 4 (O), Marietta Fire Department Station 1 Headquarters (P), Fayer Weather Hall (Q), Erwin Hall (R), Elsie Newton Hall (S), Edward Rolfe Brown Hall (T). Display/hide their locations on the map
Shopping Centers: Frontier Shopping Center (1), Washington Shopping Center (2), Lafayette Shopping Center (3). Display/hide their locations on the map
Main business address in Marietta: PEOPLES BANCORP INC (A). Display/hide its location on the map
Churches in Marietta include: Unitarian Universalist Church (A), Wayne Street Congregational Church (B), Marietta Bible Center (C), Harmar Hill Chapel (D), Harmar Congregational Church (E), Grace Gospel Church (F), First Church of the Nazarene (G), Church of God (H), Central Christian Church (I). Display/hide their locations on the map
Cemeteries: Old Saint Marys Cemetery (1), Harmar Cemetery (2), Oak Grove Cemetery (3), New Saint Marys Cemetery (4), Mound Cemetery (5). Display/hide their locations on the map
Reservoir: Cyanamid Corporation Pond (A). Display/hide its location on the map
Streams, rivers, and creeks: Muskingum River (A), Goose Creek (B), Indian Run (C). Display/hide their locations on the map
Parks in Marietta include: Muskingum Park (1), Fort Harmar Monument (2), East Muskingum Park (3), Ohio Riverfront Park (4), Indian Acres Park (5), Lookout Park (6), Marietta Historic District (7), Harmar Historic District (8), Buckeye Park (9). Display/hide their locations on the map
Tourist attractions: Children's Toy & Doll Museum Inc (206 Gilman Avenue), Castle (Museums; 418 4th Street), Fearing House Museum (Cultural Attractions- Events- & Facilities; 131 Gilman Avenue).
Hotels: Holiday Inn (701 Pike Street), Best Western Marietta (279 Muskingum Drive), Comfort Inn (700 Pike Street), Econo Lodge Marietta (702 Pike Street), Hampton Inn Marietta- OH (508 Pike Street), Gun Room Restaurant (101 Front Street), Best Value Inn (506 Pike Street).
Birthplace of: Brian Moynihan - Banker, Charles G. Dawes - Army general, Hobart Bosworth - Film director, Althea Flynt - Magazine publisher, Frances Dana Barker Gage - Writer, Chief Zimmer - Major League Baseball catcher, Dewey F. Bartlett - Politician, E. H. Moore - Mathematician, John Brough - Politician, Nancy Hollister - Politician.
Drinking water stations with addresses in Marietta and their reported violations in the past:
RENO MINI MART (Population served: 100, Groundwater):Past health violations:HOUSE OF WINES (Population served: 25, Groundwater):Past monitoring violations:
- MCL, Acute (TCR) - Between JUL-2005 and SEP-2005, Contaminant: Coliform. Follow-up actions: St Public Notif requested (JUL-26-2005), St Violation/Reminder Notice (JUL-26-2005), St Compliance achieved (APR-19-2007)
- MCL, Monthly (TCR) - Between APR-2005 and JUN-2005, Contaminant: Coliform. Follow-up actions: St Public Notif requested (JUL-06-2005), St Violation/Reminder Notice (JUL-06-2005), St Compliance achieved (APR-19-2007)
- Monitoring, Repeat Major (TCR) - Between JUL-2005 and SEP-2005, Contaminant: Coliform (TCR). Follow-up actions: St Public Notif requested (JUL-26-2005), St Violation/Reminder Notice (JUL-26-2005), St Compliance achieved (APR-19-2007)
- One routine major monitoring violation
- One regular monitoring violation
Past monitoring violations:
- One routine major monitoring violation
| This city: | 2.1 people |
| Ohio: | 2.4 people |
| This city: | 55.2% |
| Whole state: | 65.0% |
| This city: | 8.3% |
| Whole state: | 6.8% |
Likely homosexual households (counted as self-reported same-sex unmarried-partner households)
- Lesbian couples: 0.4% of all households
- Gay men: 0.3% of all households
People in group quarters in Marietta in 2010:
- 1,068 people in college/university student housing
- 353 people in nursing facilities/skilled-nursing facilities
- 108 people in local jails and other municipal confinement facilities
- 26 people in group homes intended for adults
- 23 people in correctional facilities intended for juveniles
- 7 people in other noninstitutional facilities
People in group quarters in Marietta in 2000:
- 803 people in college dormitories (includes college quarters off campus)
- 516 people in nursing homes
- 58 people in local jails and other confinement facilities (including police lockups)
- 18 people in other noninstitutional group quarters
- 17 people in training schools for juvenile delinquents
- 16 people in homes for the mentally retarded
- 8 people in other nonhousehold living situations
- 4 people in mental (psychiatric) hospitals or wards
- 4 people in unknown juvenile institutions
Banks with branches in Marietta (2011 data):
- Peoples Bank, National Association: at 138 Putnam Street, Telebank Phone Banking Branch, Kroger Branch, Second Street Branch, Frontier Branch, Messenger Service Branch. Info updated 2006/11/29: Bank assets: $1,788.7 mil, Deposits: $1,356.7 mil, local headquarters, positive income, Commercial Lending Specialization, 45 total offices, Holding Company: Peoples Bancorp Inc.
- JPMorgan Chase Bank, National Association: Colegate Branch, Pike And Acme Branch, Marrietta Branch. Info updated 2011/11/10: Bank assets: $1,811,678.0 mil, Deposits: $1,190,738.0 mil, headquarters in Columbus, OH, positive income, International Specialization, 5577 total offices, Holding Company: Jpmorgan Chase & Co.
- Advantage Bank: 714 Pike Street Branch at 714 Pike Street, branch established on 1998/01/20; Marietta Savings Bank Branch at 226 Third Street, branch established on 1923/01/01. Info updated 2011/03/23: Bank assets: $767.1 mil, Deposits: $634.2 mil, headquarters in Cambridge, OH, positive income, Commercial Lending Specialization, 26 total offices, Holding Company: Camco Financial Corporation
- First Bank of Ohio: Marietta Branch at 320 Front Street, branch established on 1934/01/01. Info updated 2011/12/09: Bank assets: $159.9 mil, Deposits: $104.2 mil, headquarters in Tiffin, OH, positive income, 5 total offices, Holding Company: Tonti Financial Corporation
- The Settlers Bank: at 115-121 Third Street, branch established on 1999/07/19. Info updated 2006/11/03: Bank assets: $111.4 mil, Deposits: $95.2 mil, local headquarters, positive income, Commercial Lending Specialization, 1 total offices, Holding Company: Third Street Bancshares, Inc.
- Wesbanco Bank, Inc.: 200 Putnam Street Branch at 200 Putnam Street, branch established on 1972/05/01. Info updated 2009/04/02: Bank assets: $5,520.2 mil, Deposits: $4,394.5 mil, headquarters in Wheeling, WV, positive income, Commercial Lending Specialization, 115 total offices, Holding Company: Wesbanco, Inc.
- The Citizens Bank Company: Marietta Branch at 110 Second Street, branch established on 1996/07/24. Info updated 2006/11/03: Bank assets: $94.4 mil, Deposits: $79.9 mil, headquarters in Beverly, OH, positive income, 2 total offices, Holding Company: Muskingum Valley Bancshares, Inc.
For population 15 years and over in Marietta:
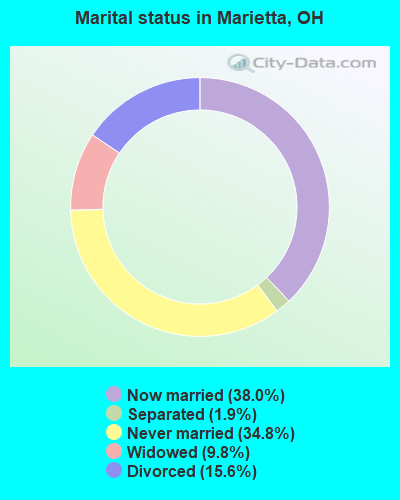
- Never married: 34.8%
- Now married: 38.0%
- Separated: 1.9%
- Widowed: 9.8%
- Divorced: 15.6%
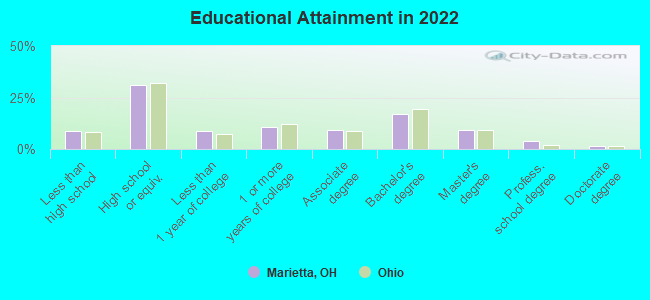
For population 25 years and over in Marietta:
- High school or higher: 90.7%
- Bachelor's degree or higher: 30.0%
- Graduate or professional degree: 13.7%
- Unemployed: 12.5%
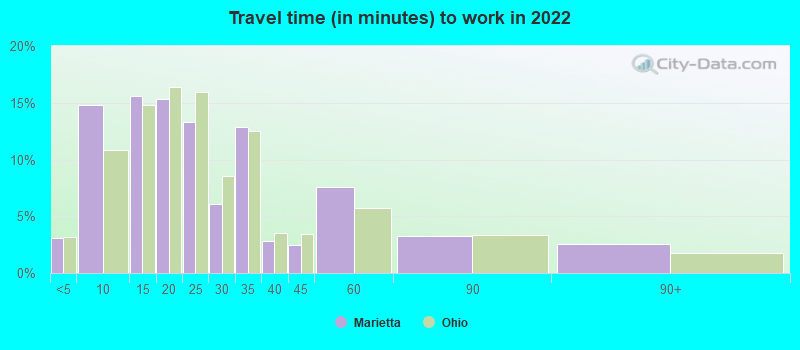
- Mean travel time to work (commute): 14.7 minutes
| Here: | 10.9 |
| Ohio average: | 11.0 |
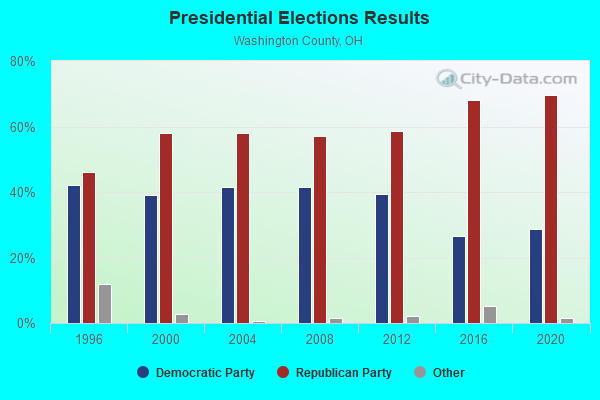
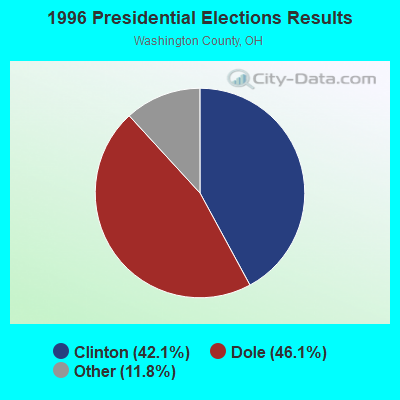
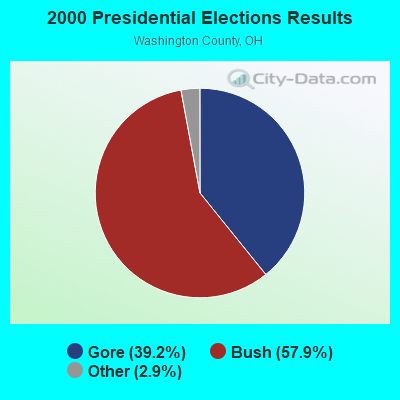
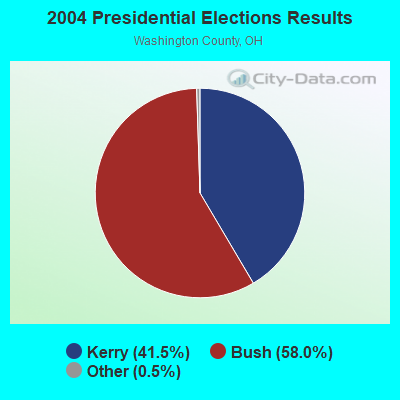
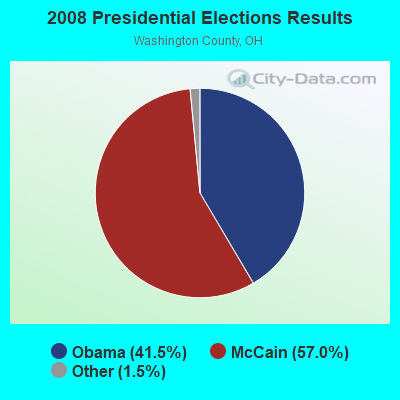
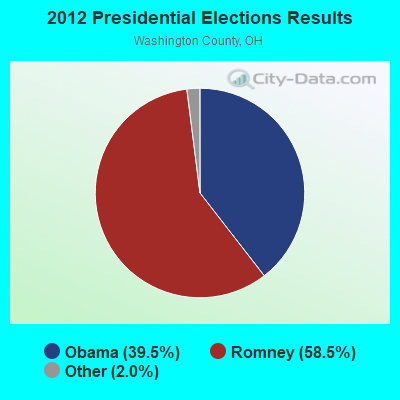
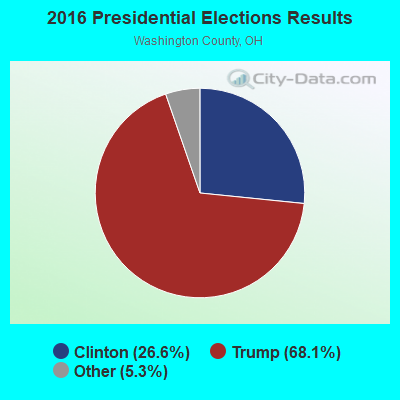
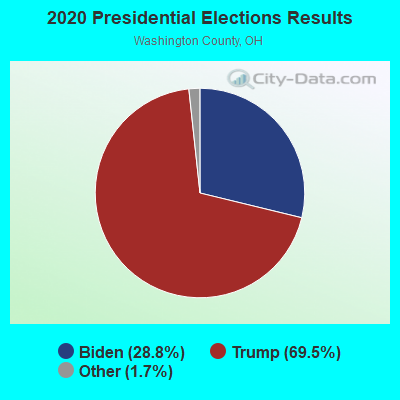
Graphs represent county-level data. Detailed 2008 Election Results
Religion statistics for Marietta, OH (based on Washington County data)
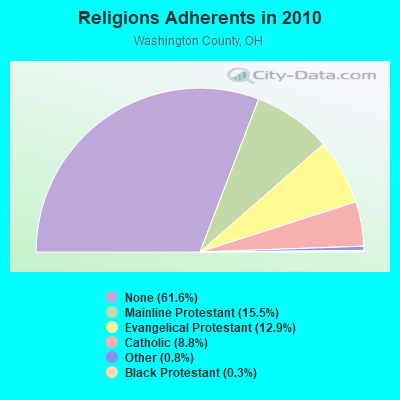
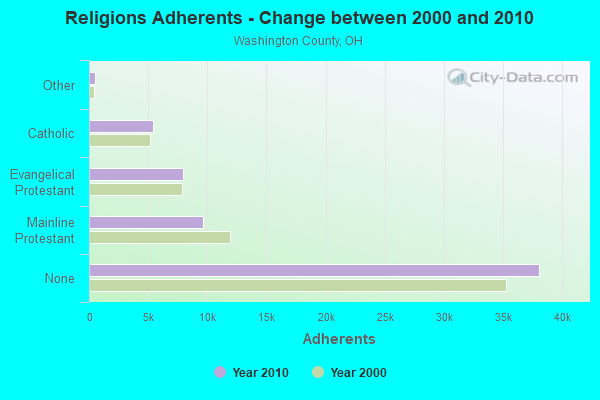
| Religion | Adherents | Congregations |
|---|---|---|
| Mainline Protestant | 9,598 | 59 |
| Evangelical Protestant | 7,981 | 67 |
| Catholic | 5,424 | 6 |
| Other | 521 | 4 |
| Black Protestant | 178 | 1 |
| None | 38,076 | - |
Food Environment Statistics:
| Here: | 2.43 / 10,000 pop. |
| Ohio: | 1.89 / 10,000 pop. |
| This county: | 0.16 / 10,000 pop. |
| Ohio: | 0.13 / 10,000 pop. |
| This county: | 0.97 / 10,000 pop. |
| State: | 1.25 / 10,000 pop. |
| Washington County: | 4.86 / 10,000 pop. |
| Ohio: | 2.93 / 10,000 pop. |
| This county: | 5.19 / 10,000 pop. |
| State: | 6.25 / 10,000 pop. |
| This county: | 12.1% |
| Ohio: | 10.3% |
| This county: | 30.1% |
| Ohio: | 29.1% |
| This county: | 11.7% |
| State: | 11.9% |
Health and Nutrition:
| This city: | 54.6% |
| Ohio: | 50.4% |
| Marietta: | 54.3% |
| Ohio: | 47.8% |
| Marietta: | 28.3 |
| Ohio: | 28.7 |
| Marietta: | 20.8% |
| State: | 20.6% |
| Here: | 10.4% |
| Ohio: | 10.4% |
| Marietta: | 7.0 |
| State: | 6.8 |
| Here: | 34.7% |
| Ohio: | 34.3% |
| Here: | 61.1% |
| Ohio: | 57.0% |
| Marietta: | 79.3% |
| Ohio: | 79.1% |
More about Health and Nutrition of Marietta, OH Residents
| Local government employment and payroll (March 2022) | |||||
| Function | Full-time employees | Monthly full-time payroll | Average yearly full-time wage | Part-time employees | Monthly part-time payroll |
|---|---|---|---|---|---|
| Firefighters | 34 | $183,578 | $64,792 | 0 | $0 |
| Police Protection - Officers | 27 | $152,051 | $67,578 | 0 | $0 |
| Judicial and Legal | 24 | $82,810 | $41,405 | 3 | $403 |
| Streets and Highways | 20 | $89,444 | $53,666 | 0 | $0 |
| Sewerage | 19 | $80,932 | $51,115 | 0 | $0 |
| Water Supply | 17 | $73,716 | $52,035 | 0 | $0 |
| Other Government Administration | 15 | $63,740 | $50,992 | 12 | $7,431 |
| Financial Administration | 11 | $43,805 | $47,787 | 0 | $0 |
| Police - Other | 9 | $40,174 | $53,565 | 0 | $0 |
| Health | 7 | $33,429 | $57,307 | 4 | $8,529 |
| Parks and Recreation | 6 | $24,399 | $48,798 | 0 | $0 |
| Correction | 4 | $20,673 | $62,019 | 0 | $0 |
| Fire - Other | 3 | $18,988 | $75,952 | 0 | $0 |
| Housing and Community Development (Local) | 2 | $9,154 | $54,924 | 0 | $0 |
| Other and Unallocable | 1 | $4,247 | $50,964 | 2 | $5,055 |
| Totals for Government | 199 | $921,138 | $55,546 | 21 | $21,419 |
Marietta government finances - Expenditure in 2017 (per resident):
- Construction - Sewerage: $2,530,000 ($191.99)
Water Utilities: $819,000 ($62.15)
Regular Highways: $468,000 ($35.51)
- Current Operations - Water Utilities: $5,291,000 ($401.50)
Sewerage: $4,998,000 ($379.27)
Local Fire Protection: $3,980,000 ($302.02)
Police Protection: $3,641,000 ($276.29)
Public Welfare - Other: $2,044,000 ($155.11)
Regular Highways: $1,837,000 ($139.40)
General Public Buildings: $1,534,000 ($116.41)
Financial Administration: $969,000 ($73.53)
Judicial and Legal Services: $841,000 ($63.82)
Health - Other: $774,000 ($58.73)
Housing and Community Development: $547,000 ($41.51)
Central Staff Services: $488,000 ($37.03)
Corrections - Other: $437,000 ($33.16)
General - Other: $366,000 ($27.77)
Parks and Recreation: $305,000 ($23.14)
Parking Facilities: $68,000 ($5.16)
Transit Utilities: $37,000 ($2.81)
Protective Inspection and Regulation - Other: $21,000 ($1.59)
Miscellaneous Commercial Activities - Other: $18,000 ($1.37)
- Other Capital Outlay - General - Other: $177,000 ($13.43)
- Total Salaries and Wages: $10,384,000 ($787.98)
- Water Utilities - Interest on Debt: $165,000 ($12.52)
Marietta government finances - Revenue in 2017 (per resident):
- Charges - Sewerage: $5,351,000 ($406.06)
Parks and Recreation: $317,000 ($24.06)
Parking Facilities: $69,000 ($5.24)
Miscellaneous Commercial Activities: $30,000 ($2.28)
- Federal Intergovernmental - Housing and Community Development: $2,598,000 ($197.15)
- Local Intergovernmental - Highways: $53,000 ($4.02)
- Miscellaneous - Fines and Forfeits: $514,000 ($39.00)
General Revenue - Other: $336,000 ($25.50)
Interest Earnings: $78,000 ($5.92)
Rents: $8,000 ($0.61)
- Revenue - Water Utilities: $4,037,000 ($306.34)
- State Intergovernmental - Highways: $206,000 ($15.63)
Health and Hospitals: $81,000 ($6.15)
- Tax - Individual Income: $9,662,000 ($733.19)
Corporation Net Income: $886,000 ($67.23)
Property: $521,000 ($39.54)
Motor Vehicle License: $243,000 ($18.44)
Alcoholic Beverage License: $34,000 ($2.58)
Tobacco Products Sales: $1,000 ($0.08)
Marietta government finances - Debt in 2017 (per resident):
- Long Term Debt - Beginning Outstanding - Unspecified Public Purpose: $18,592,000 ($1410.84)
Outstanding Unspecified Public Purpose: $17,955,000 ($1362.50)
Retired Unspecified Public Purpose: $11,109,000 ($843.00)
Issue, Unspecified Public Purpose: $10,472,000 ($794.66)
Outstanding Nonguaranteed - Industrial Revenue: $18,000 ($1.37)
Beginning Outstanding - Public Debt for Private Purpose: $18,000 ($1.37)
Marietta government finances - Cash and Securities in 2017 (per resident):
- Other Funds - Cash and Securities: $13,034,000 ($989.07)
- Sinking Funds - Cash and Securities: $18,000 ($1.37)
| Businesses in Marietta, OH | ||||
| Name | Count | Name | Count | |
|---|---|---|---|---|
| ALDI | 1 | Long John Silver's | 1 | |
| AT&T | 1 | Lowe's | 1 | |
| Advance Auto Parts | 1 | MasterBrand Cabinets | 1 | |
| Applebee's | 1 | McDonald's | 4 | |
| Arby's | 1 | Microtel | 1 | |
| AutoZone | 1 | New Balance | 1 | |
| Burger King | 1 | Papa John's Pizza | 1 | |
| CVS | 1 | Pizza Hut | 1 | |
| Comfort Inn | 1 | Quiznos | 1 | |
| Curves | 1 | RadioShack | 1 | |
| Dairy Queen | 1 | Rite Aid | 1 | |
| Domino's Pizza | 1 | Ryan's Grill | 1 | |
| FedEx | 4 | SAS Shoes | 1 | |
| Ford | 1 | Subway | 3 | |
| GNC | 2 | Super 8 | 1 | |
| GameStop | 1 | Taco Bell | 1 | |
| H&R Block | 1 | Tim Hortons | 1 | |
| Hilton | 1 | True Value | 1 | |
| Holiday Inn | 1 | U-Haul | 2 | |
| KFC | 1 | UPS | 8 | |
| Kincaid | 1 | Verizon Wireless | 1 | |
| Kmart | 1 | Walgreens | 1 | |
| Kroger | 1 | Walmart | 1 | |
| La-Z-Boy | 1 | Wendy's | 2 | |
| Lane Furniture | 2 | YMCA | 1 | |
| Little Caesars Pizza | 1 | |||
Strongest AM radio stations in Marietta:
- WMOA (1490 AM; 1 kW; MARIETTA, OH; Owner: QUIET RADIO, INC.)
- WBRJ (910 AM; 5 kW; MARIETTA, OH; Owner: CLEAR CHANNEL BROADCASTING LICENSES, INC.)
- WADC (1050 AM; 5 kW; PARKERSBURG, WV; Owner: BURBACH OF DE, LLC)
- WWVA (1170 AM; 53 kW; WHEELING, WV; Owner: CAPSTAR TX LIMITED PARTNERSHIP)
- WTVN (610 AM; 50 kW; COLUMBUS, OH; Owner: CITICASTERS LICENSES, L.P.)
- WJAW (630 AM; 1 kW; ST. MARYS, WV; Owner: JAWCO, INC.)
- WLTP (1450 AM; 1 kW; PARKERSBURG, WV; Owner: CLEAR CHANNEL BROADCASTING LICENSES, INC.)
- WKYG (1230 AM; 1 kW; PARKERSBURG, WV; Owner: BURBACH OF DE, LLC)
- KDKA (1020 AM; 50 kW; PITTSBURGH, PA; Owner: INFINITY BROADCASTING OPERATIONS, INC.)
- WKNR (850 AM; 50 kW; CLEVELAND, OH; Owner: CARON BROADCASTING, INC.)
- WBGS (1030 AM; daytime; 10 kW; POINT PLEASANT, WV; Owner: BIG RIVER RADIO, INC.)
- WRFD (880 AM; daytime; 23 kW; COLUMBUS-WORTHINGTON, OH; Owner: SALEM MEDIA OF OHIO, INC.)
- WLW (700 AM; 50 kW; CINCINNATI, OH; Owner: JACOR BROADCASTING CORPORATION)
Strongest FM radio stations in Marietta:
- WMRT (88.3 FM; MARIETTA, OH; Owner: MARIETTA COLLEGE)
- WCMO (98.5 FM; MARIETTA, OH; Owner: MARIETTA COLLEGE)
- WVVP-LP (96.1 FM; MARIETTA, OH; Owner: FELLOWSHIP BAPTIST CHURCH)
- WMBP (91.9 FM; BELPRE, OH; Owner: LOWER OHIO VALLEY EDUCATIONAL CORP.)
- WDMX (100.1 FM; VIENNA, WV; Owner: CLEAR CHANNEL BROADCASTING LICENSES, INC.)
- WVVV (96.9 FM; WILLIAMSTOWN, WV; Owner: BENNCO, INC.)
- WHBR-FM (103.1 FM; PARKERSBURG, WV; Owner: BURBACH OF DE, LLC)
- W300AQ (107.9 FM; WILLIAMSTOWN, WV; Owner: CHRISTIAN VOICE OF CENTRAL OHIO, INC)
- WRVB (102.1 FM; MARIETTA, OH; Owner: CLEAR CHANNEL BROADCASTING LICENSES, INC.)
- WXIL (95.1 FM; PARKERSBURG, WV; Owner: BURBACH OF DE, LLC)
- WCVV (89.5 FM; BELPRE, OH; Owner: BELPRE EDUC. B/CNG FOUNDATION)
- WNUS (107.1 FM; BELPRE, OH; Owner: CLEAR CHANNEL BROADCASTING LICENSES, INC.)
- WGGE (99.1 FM; PARKERSBURG, WV; Owner: BURBACH OF DE, LLC)
- WRRR-FM (93.9 FM; ST. MARYS, WV; Owner: SEVEN RANGES RADIO COMPANY, INC.)
- WJAW-FM (100.9 FM; MCCONNELSVILLE, OH; Owner: QUIET RADIO INC. D/B/A WJAW RADIO)
- WRZZ (106.1 FM; ELIZABETH, WV; Owner: CLEAR CHANNEL BROADCASTING LICENSES, INC.)
- W282AI (104.3 FM; PARKERSBURG, WV; Owner: FINE ARTS RADIO)
TV broadcast stations around Marietta:
- WTAP-TV (Channel 15; PARKERSBURG, WV; Owner: GRAY MIDAMERICA TV LICENSEE CORP.)
- W45BW (Channel 45; PARKERSBURG, WV; Owner: TRINITY BROADCASTING NETWORK)
- W26AL (Channel 26; MARIETTA, OH; Owner: THE CHRISTIAN CENTER, INC.)
- WOUC-TV (Channel 44; CAMBRIDGE, OH; Owner: OHIO UNIVERSITY)
- WOUB-TV (Channel 20; ATHENS, OH; Owner: OHIO UNIVERSITY)
- National Bridge Inventory (NBI) Statistics
- 29Number of bridges
- 932ft / 284mTotal length
- $100,000,000Total costs
- 226,637Total average daily traffic
- 19,028Total average daily truck traffic
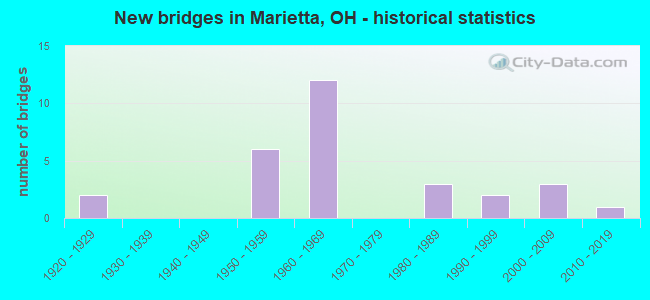
- New bridges - historical statistics
- 21920-1929
- 61950-1959
- 121960-1969
- 31980-1989
- 21990-1999
- 32000-2009
- 12010-2019
FCC Registered Private Land Mobile Towers: 2 (See the full list of FCC Registered Private Land Mobile Towers in Marietta, OH)
FCC Registered Broadcast Land Mobile Towers: 56 (See the full list of FCC Registered Broadcast Land Mobile Towers)
FCC Registered Microwave Towers: 31 (See the full list of FCC Registered Microwave Towers in this town)
FCC Registered Paging Towers: 6 (See the full list of FCC Registered Paging Towers)
FCC Registered Amateur Radio Licenses: 199 (See the full list of FCC Registered Amateur Radio Licenses in Marietta)
FAA Registered Aircraft: 37 (See the full list of FAA Registered Aircraft in Marietta)
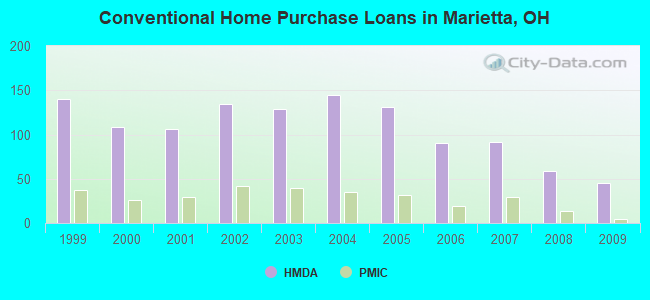
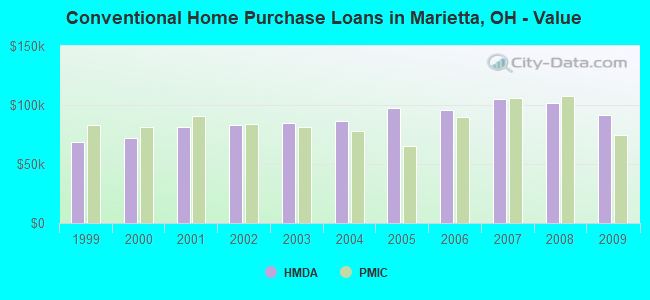
| Home Mortgage Disclosure Act Aggregated Statistics For Year 2009 (Based on 2 full and 4 partial tracts) | ||||||||||||||
| A) FHA, FSA/RHS & VA Home Purchase Loans | B) Conventional Home Purchase Loans | C) Refinancings | D) Home Improvement Loans | E) Loans on Dwellings For 5+ Families | F) Non-occupant Loans on < 5 Family Dwellings (A B C & D) | G) Loans On Manufactured Home Dwelling (A B C & D) | ||||||||
|---|---|---|---|---|---|---|---|---|---|---|---|---|---|---|
| Number | Average Value | Number | Average Value | Number | Average Value | Number | Average Value | Number | Average Value | Number | Average Value | Number | Average Value | |
| LOANS ORIGINATED | 25 | $85,455 | 45 | $91,626 | 124 | $136,694 | 15 | $90,239 | 0 | $0 | 19 | $70,894 | 5 | $48,520 |
| APPLICATIONS APPROVED, NOT ACCEPTED | 4 | $111,340 | 1 | $109,440 | 6 | $117,208 | 0 | $0 | 1 | $3,505,800 | 0 | $0 | 0 | $0 |
| APPLICATIONS DENIED | 6 | $78,730 | 5 | $127,562 | 45 | $103,237 | 6 | $67,938 | 0 | $0 | 6 | $36,550 | 1 | $47,330 |
| APPLICATIONS WITHDRAWN | 2 | $106,860 | 10 | $110,315 | 22 | $103,560 | 0 | $0 | 0 | $0 | 0 | $0 | 1 | $54,050 |
| FILES CLOSED FOR INCOMPLETENESS | 0 | $0 | 2 | $110,120 | 6 | $96,328 | 0 | $0 | 0 | $0 | 0 | $0 | 0 | $0 |
Detailed HMDA statistics for the following Tracts: 0204.00 , 0205.00, 0208.00, 0209.00, 0210.00
| Private Mortgage Insurance Companies Aggregated Statistics For Year 2009 (Based on 2 full and 4 partial tracts) | ||||
| A) Conventional Home Purchase Loans | B) Refinancings | |||
|---|---|---|---|---|
| Number | Average Value | Number | Average Value | |
| LOANS ORIGINATED | 5 | $74,786 | 6 | $143,455 |
| APPLICATIONS APPROVED, NOT ACCEPTED | 1 | $110,970 | 2 | $51,955 |
| APPLICATIONS DENIED | 1 | $328,400 | 2 | $197,530 |
| APPLICATIONS WITHDRAWN | 0 | $0 | 0 | $0 |
| FILES CLOSED FOR INCOMPLETENESS | 0 | $0 | 0 | $0 |
Detailed PMIC statistics for the following Tracts: 0204.00 , 0205.00, 0208.00, 0209.00, 0210.00
2002 - 2018 National Fire Incident Reporting System (NFIRS) incidents
- Fire incident types reported to NFIRS in Marietta, OH
- 62339.8%Structure Fires
- 59337.8%Outside Fires
- 32820.9%Mobile Property/Vehicle Fires
- 231.5%Other
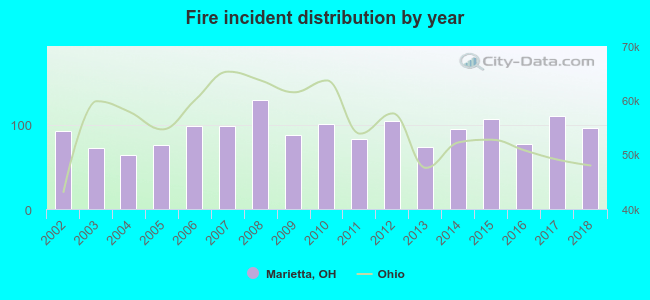 Based on the data from the years 2002 - 2018 the average number of fires per year is 92. The highest number of fires - 129 took place in 2008, and the least - 64 in 2004. The data has an increasing trend.
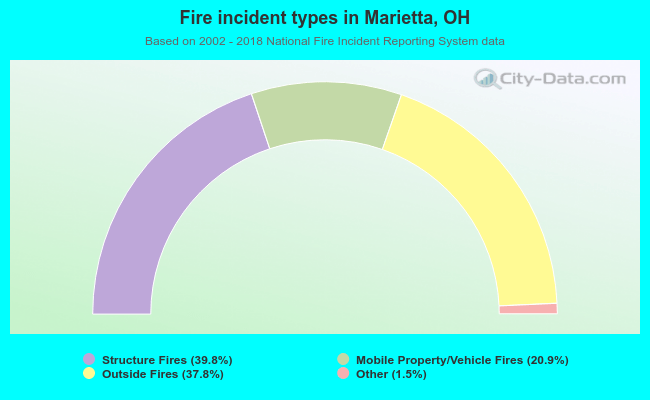 When looking into fire subcategories, the most incidents belonged to: Structure Fires (39.8%), and Outside Fires (37.8%).
Fire-safe hotels and motels in Marietta, Ohio:
- Super 8 Marietta, 46 Acme St, Marietta, Ohio 45750 , Phone: (740) 374-8888, Fax: (740) 374-8476
- Best Western Plus, 701 Pike St, Marietta, Ohio 45750 , Phone: (740) 374-9660, Fax: (740) 373-1762
- Microtel Inn And Suites, 506 Pike St, Marietta, Ohio 45750 , Phone: (740) 373-7373, Fax: (740) 373-3609
- Comfort Inn Marietta, 700 Pike St, Marietta, Ohio 45750 , Phone: (740) 374-8190, Fax: (740) 374-3649
- Hampton Inn, 508 Pike St, Marietta, Ohio 45750 , Phone: (740) 373-5353, Fax: (740) 373-3803
- Fairfield Inn & Suites, 200 Cherry Tree Ln, Marietta, Ohio 45750 , Phone: (740) 374-3000, Fax: (740) 374-6988
- Comfort Suites, 202 Cherry Tree Ln, Marietta, Ohio 45750 , Phone: (740) 376-1600
- Red Roof Inn, 702 Pike St, Marietta, Ohio 45750 , Phone: (740) 336-7866, Fax: (740) 336-7859
- Holiday Inn Express & Suites Marietta, 970 Pike St, Marietta, Ohio 45750 , Phone: (740) 760-1515, Fax: (740) 760-1305
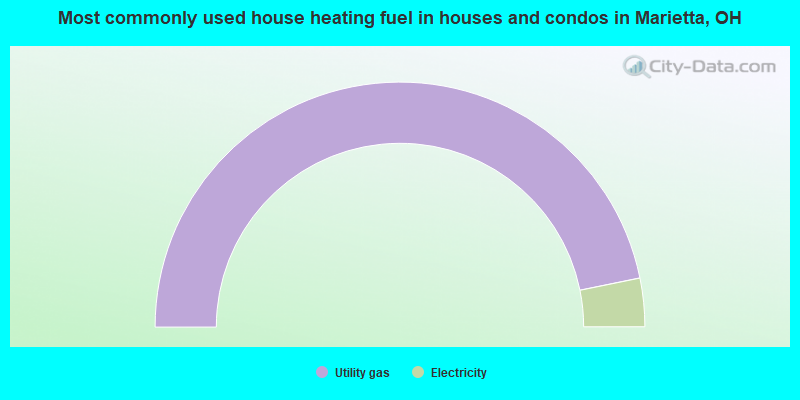
- 93.6%Utility gas
- 6.4%Electricity
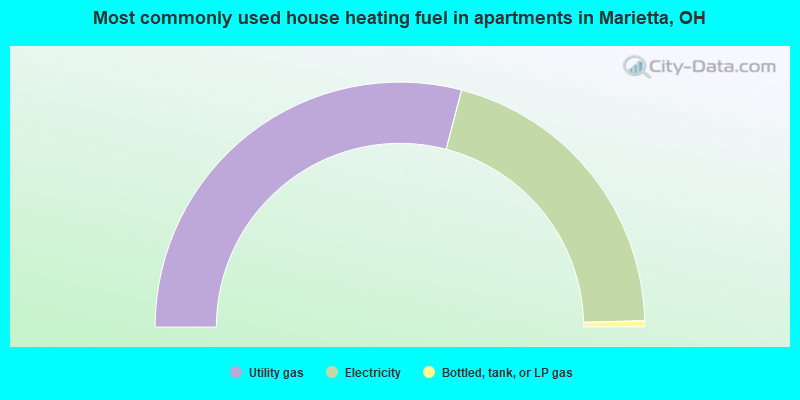
- 58.1%Utility gas
- 41.1%Electricity
- 0.8%Bottled, tank, or LP gas
Marietta compared to Ohio state average:
- Median household income below state average.
- Black race population percentage significantly below state average.
- Hispanic race population percentage below state average.
- Length of stay since moving in significantly above state average.
- Institutionalized population percentage above state average.
Marietta on our top lists:
- #50 on the list of "Top 101 cities with the largest city-data.com crime index decrease from 2002 to 2012 (population 5,000+)"
- #88 on the list of "Top 101 counties with the lowest percentage of residents relocating to other counties in 2011 (pop. 50,000+)"
- #98 on the list of "Top 101 counties with the highest number of deaths per 1000 residents 2007-2013 (pop. 50,000+)"

|
|
Total of 61 patent applications in 2008-2024.