Murrieta, California Submit your own pictures of this city and show them to the world
OSM Map
General Map
Google Map
MSN Map
OSM Map
General Map
Google Map
MSN Map
OSM Map
General Map
Google Map
MSN Map
OSM Map
General Map
Google Map
MSN Map
Please wait while loading the map...
Population in 2022: 113,783 (99% urban, 1% rural). Population change since 2000: +157.0%Males: 55,378 Females: 58,405
March 2022 cost of living index in Murrieta: 82.7 (low, U.S. average is 100) Percentage of residents living in poverty in 2022: 5.4%for White Non-Hispanic residents , 4.3% for Black residents , 4.5% for Hispanic or Latino residents , 17.4% for American Indian residents , 9.3% for Native Hawaiian and other Pacific Islander residents , 4.4% for other race residents , 6.0% for two or more races residents )
Profiles of local businesses
Business Search - 14 Million verified businesses
Data:
Median household income ($)
Median household income (% change since 2000)
Household income diversity
Ratio of average income to average house value (%)
Ratio of average income to average rent
Median household income ($) - White
Median household income ($) - Black or African American
Median household income ($) - Asian
Median household income ($) - Hispanic or Latino
Median household income ($) - American Indian and Alaska Native
Median household income ($) - Multirace
Median household income ($) - Other Race
Median household income for houses/condos with a mortgage ($)
Median household income for apartments without a mortgage ($)
Races - White alone (%)
Races - White alone (% change since 2000)
Races - Black alone (%)
Races - Black alone (% change since 2000)
Races - American Indian alone (%)
Races - American Indian alone (% change since 2000)
Races - Asian alone (%)
Races - Asian alone (% change since 2000)
Races - Hispanic (%)
Races - Hispanic (% change since 2000)
Races - Native Hawaiian and Other Pacific Islander alone (%)
Races - Native Hawaiian and Other Pacific Islander alone (% change since 2000)
Races - Two or more races (%)
Races - Two or more races (% change since 2000)
Races - Other race alone (%)
Races - Other race alone (% change since 2000)
Racial diversity
Unemployment (%)
Unemployment (% change since 2000)
Unemployment (%) - White
Unemployment (%) - Black or African American
Unemployment (%) - Asian
Unemployment (%) - Hispanic or Latino
Unemployment (%) - American Indian and Alaska Native
Unemployment (%) - Multirace
Unemployment (%) - Other Race
Population density (people per square mile)
Population - Males (%)
Population - Females (%)
Population - Males (%) - White
Population - Males (%) - Black or African American
Population - Males (%) - Asian
Population - Males (%) - Hispanic or Latino
Population - Males (%) - American Indian and Alaska Native
Population - Males (%) - Multirace
Population - Males (%) - Other Race
Population - Females (%) - White
Population - Females (%) - Black or African American
Population - Females (%) - Asian
Population - Females (%) - Hispanic or Latino
Population - Females (%) - American Indian and Alaska Native
Population - Females (%) - Multirace
Population - Females (%) - Other Race
Coronavirus confirmed cases (Apr 19, 2024)
Deaths caused by coronavirus (Apr 19, 2024)
Coronavirus confirmed cases (per 100k population) (Apr 19, 2024)
Deaths caused by coronavirus (per 100k population) (Apr 19, 2024)
Daily increase in number of cases (Apr 19, 2024)
Weekly increase in number of cases (Apr 19, 2024)
Cases doubled (in days) (Apr 19, 2024)
Hospitalized patients (Apr 18, 2022)
Negative test results (Apr 18, 2022)
Total test results (Apr 18, 2022)
COVID Vaccine doses distributed (per 100k population) (Sep 19, 2023)
COVID Vaccine doses administered (per 100k population) (Sep 19, 2023)
COVID Vaccine doses distributed (Sep 19, 2023)
COVID Vaccine doses administered (Sep 19, 2023)
Likely homosexual households (%)
Likely homosexual households (% change since 2000)
Likely homosexual households - Lesbian couples (%)
Likely homosexual households - Lesbian couples (% change since 2000)
Likely homosexual households - Gay men (%)
Likely homosexual households - Gay men (% change since 2000)
Cost of living index
Median gross rent ($)
Median contract rent ($)
Median monthly housing costs ($)
Median house or condo value ($)
Median house or condo value ($ change since 2000)
Mean house or condo value by units in structure - 1, detached ($)
Mean house or condo value by units in structure - 1, attached ($)
Mean house or condo value by units in structure - 2 ($)
Mean house or condo value by units in structure by units in structure - 3 or 4 ($)
Mean house or condo value by units in structure - 5 or more ($)
Mean house or condo value by units in structure - Boat, RV, van, etc. ($)
Mean house or condo value by units in structure - Mobile home ($)
Median house or condo value ($) - White
Median house or condo value ($) - Black or African American
Median house or condo value ($) - Asian
Median house or condo value ($) - Hispanic or Latino
Median house or condo value ($) - American Indian and Alaska Native
Median house or condo value ($) - Multirace
Median house or condo value ($) - Other Race
Median resident age
Resident age diversity
Median resident age - Males
Median resident age - Females
Median resident age - White
Median resident age - Black or African American
Median resident age - Asian
Median resident age - Hispanic or Latino
Median resident age - American Indian and Alaska Native
Median resident age - Multirace
Median resident age - Other Race
Median resident age - Males - White
Median resident age - Males - Black or African American
Median resident age - Males - Asian
Median resident age - Males - Hispanic or Latino
Median resident age - Males - American Indian and Alaska Native
Median resident age - Males - Multirace
Median resident age - Males - Other Race
Median resident age - Females - White
Median resident age - Females - Black or African American
Median resident age - Females - Asian
Median resident age - Females - Hispanic or Latino
Median resident age - Females - American Indian and Alaska Native
Median resident age - Females - Multirace
Median resident age - Females - Other Race
Commute - mean travel time to work (minutes)
Travel time to work - Less than 5 minutes (%)
Travel time to work - Less than 5 minutes (% change since 2000)
Travel time to work - 5 to 9 minutes (%)
Travel time to work - 5 to 9 minutes (% change since 2000)
Travel time to work - 10 to 19 minutes (%)
Travel time to work - 10 to 19 minutes (% change since 2000)
Travel time to work - 20 to 29 minutes (%)
Travel time to work - 20 to 29 minutes (% change since 2000)
Travel time to work - 30 to 39 minutes (%)
Travel time to work - 30 to 39 minutes (% change since 2000)
Travel time to work - 40 to 59 minutes (%)
Travel time to work - 40 to 59 minutes (% change since 2000)
Travel time to work - 60 to 89 minutes (%)
Travel time to work - 60 to 89 minutes (% change since 2000)
Travel time to work - 90 or more minutes (%)
Travel time to work - 90 or more minutes (% change since 2000)
Marital status - Never married (%)
Marital status - Now married (%)
Marital status - Separated (%)
Marital status - Widowed (%)
Marital status - Divorced (%)
Median family income ($)
Median family income (% change since 2000)
Median non-family income ($)
Median non-family income (% change since 2000)
Median per capita income ($)
Median per capita income (% change since 2000)
Median family income ($) - White
Median family income ($) - Black or African American
Median family income ($) - Asian
Median family income ($) - Hispanic or Latino
Median family income ($) - American Indian and Alaska Native
Median family income ($) - Multirace
Median family income ($) - Other Race
Median year house/condo built
Median year apartment built
Year house built - Built 2005 or later (%)
Year house built - Built 2000 to 2004 (%)
Year house built - Built 1990 to 1999 (%)
Year house built - Built 1980 to 1989 (%)
Year house built - Built 1970 to 1979 (%)
Year house built - Built 1960 to 1969 (%)
Year house built - Built 1950 to 1959 (%)
Year house built - Built 1940 to 1949 (%)
Year house built - Built 1939 or earlier (%)
Average household size
Household density (households per square mile)
Average household size - White
Average household size - Black or African American
Average household size - Asian
Average household size - Hispanic or Latino
Average household size - American Indian and Alaska Native
Average household size - Multirace
Average household size - Other Race
Occupied housing units (%)
Vacant housing units (%)
Owner occupied housing units (%)
Renter occupied housing units (%)
Vacancy status - For rent (%)
Vacancy status - For sale only (%)
Vacancy status - Rented or sold, not occupied (%)
Vacancy status - For seasonal, recreational, or occasional use (%)
Vacancy status - For migrant workers (%)
Vacancy status - Other vacant (%)
Residents with income below the poverty level (%)
Residents with income below 50% of the poverty level (%)
Children below poverty level (%)
Poor families by family type - Married-couple family (%)
Poor families by family type - Male, no wife present (%)
Poor families by family type - Female, no husband present (%)
Poverty status for native-born residents (%)
Poverty status for foreign-born residents (%)
Poverty among high school graduates not in families (%)
Poverty among people who did not graduate high school not in families (%)
Residents with income below the poverty level (%) - White
Residents with income below the poverty level (%) - Black or African American
Residents with income below the poverty level (%) - Asian
Residents with income below the poverty level (%) - Hispanic or Latino
Residents with income below the poverty level (%) - American Indian and Alaska Native
Residents with income below the poverty level (%) - Multirace
Residents with income below the poverty level (%) - Other Race
Air pollution - Air Quality Index (AQI)
Air pollution - CO
Air pollution - NO2
Air pollution - SO2
Air pollution - Ozone
Air pollution - PM10
Air pollution - PM25
Air pollution - Pb
Crime - Murders per 100,000 population
Crime - Rapes per 100,000 population
Crime - Robberies per 100,000 population
Crime - Assaults per 100,000 population
Crime - Burglaries per 100,000 population
Crime - Thefts per 100,000 population
Crime - Auto thefts per 100,000 population
Crime - Arson per 100,000 population
Crime - City-data.com crime index
Crime - Violent crime index
Crime - Property crime index
Crime - Murders per 100,000 population (5 year average)
Crime - Rapes per 100,000 population (5 year average)
Crime - Robberies per 100,000 population (5 year average)
Crime - Assaults per 100,000 population (5 year average)
Crime - Burglaries per 100,000 population (5 year average)
Crime - Thefts per 100,000 population (5 year average)
Crime - Auto thefts per 100,000 population (5 year average)
Crime - Arson per 100,000 population (5 year average)
Crime - City-data.com crime index (5 year average)
Crime - Violent crime index (5 year average)
Crime - Property crime index (5 year average)
1996 Presidential Elections Results (%) - Democratic Party (Clinton)
1996 Presidential Elections Results (%) - Republican Party (Dole)
1996 Presidential Elections Results (%) - Other
2000 Presidential Elections Results (%) - Democratic Party (Gore)
2000 Presidential Elections Results (%) - Republican Party (Bush)
2000 Presidential Elections Results (%) - Other
2004 Presidential Elections Results (%) - Democratic Party (Kerry)
2004 Presidential Elections Results (%) - Republican Party (Bush)
2004 Presidential Elections Results (%) - Other
2008 Presidential Elections Results (%) - Democratic Party (Obama)
2008 Presidential Elections Results (%) - Republican Party (McCain)
2008 Presidential Elections Results (%) - Other
2012 Presidential Elections Results (%) - Democratic Party (Obama)
2012 Presidential Elections Results (%) - Republican Party (Romney)
2012 Presidential Elections Results (%) - Other
2016 Presidential Elections Results (%) - Democratic Party (Clinton)
2016 Presidential Elections Results (%) - Republican Party (Trump)
2016 Presidential Elections Results (%) - Other
2020 Presidential Elections Results (%) - Democratic Party (Biden)
2020 Presidential Elections Results (%) - Republican Party (Trump)
2020 Presidential Elections Results (%) - Other
Ancestries Reported - Arab (%)
Ancestries Reported - Czech (%)
Ancestries Reported - Danish (%)
Ancestries Reported - Dutch (%)
Ancestries Reported - English (%)
Ancestries Reported - French (%)
Ancestries Reported - French Canadian (%)
Ancestries Reported - German (%)
Ancestries Reported - Greek (%)
Ancestries Reported - Hungarian (%)
Ancestries Reported - Irish (%)
Ancestries Reported - Italian (%)
Ancestries Reported - Lithuanian (%)
Ancestries Reported - Norwegian (%)
Ancestries Reported - Polish (%)
Ancestries Reported - Portuguese (%)
Ancestries Reported - Russian (%)
Ancestries Reported - Scotch-Irish (%)
Ancestries Reported - Scottish (%)
Ancestries Reported - Slovak (%)
Ancestries Reported - Subsaharan African (%)
Ancestries Reported - Swedish (%)
Ancestries Reported - Swiss (%)
Ancestries Reported - Ukrainian (%)
Ancestries Reported - United States (%)
Ancestries Reported - Welsh (%)
Ancestries Reported - West Indian (%)
Ancestries Reported - Other (%)
Educational Attainment - No schooling completed (%)
Educational Attainment - Less than high school (%)
Educational Attainment - High school or equivalent (%)
Educational Attainment - Less than 1 year of college (%)
Educational Attainment - 1 or more years of college (%)
Educational Attainment - Associate degree (%)
Educational Attainment - Bachelor's degree (%)
Educational Attainment - Master's degree (%)
Educational Attainment - Professional school degree (%)
Educational Attainment - Doctorate degree (%)
School Enrollment - Nursery, preschool (%)
School Enrollment - Kindergarten (%)
School Enrollment - Grade 1 to 4 (%)
School Enrollment - Grade 5 to 8 (%)
School Enrollment - Grade 9 to 12 (%)
School Enrollment - College undergrad (%)
School Enrollment - Graduate or professional (%)
School Enrollment - Not enrolled in school (%)
School enrollment - Public schools (%)
School enrollment - Private schools (%)
School enrollment - Not enrolled (%)
Median number of rooms in houses and condos
Median number of rooms in apartments
Housing units lacking complete plumbing facilities (%)
Housing units lacking complete kitchen facilities (%)
Density of houses
Urban houses (%)
Rural houses (%)
Households with people 60 years and over (%)
Households with people 65 years and over (%)
Households with people 75 years and over (%)
Households with one or more nonrelatives (%)
Households with no nonrelatives (%)
Population in households (%)
Family households (%)
Nonfamily households (%)
Population in families (%)
Family households with own children (%)
Median number of bedrooms in owner occupied houses
Mean number of bedrooms in owner occupied houses
Median number of bedrooms in renter occupied houses
Mean number of bedrooms in renter occupied houses
Median number of vehichles in owner occupied houses
Mean number of vehichles in owner occupied houses
Median number of vehichles in renter occupied houses
Mean number of vehichles in renter occupied houses
Mortgage status - with mortgage (%)
Mortgage status - with second mortgage (%)
Mortgage status - with home equity loan (%)
Mortgage status - with both second mortgage and home equity loan (%)
Mortgage status - without a mortgage (%)
Average family size
Average family size - White
Average family size - Black or African American
Average family size - Asian
Average family size - Hispanic or Latino
Average family size - American Indian and Alaska Native
Average family size - Multirace
Average family size - Other Race
Geographical mobility - Same house 1 year ago (%)
Geographical mobility - Moved within same county (%)
Geographical mobility - Moved from different county within same state (%)
Geographical mobility - Moved from different state (%)
Geographical mobility - Moved from abroad (%)
Place of birth - Born in state of residence (%)
Place of birth - Born in other state (%)
Place of birth - Native, outside of US (%)
Place of birth - Foreign born (%)
Housing units in structures - 1, detached (%)
Housing units in structures - 1, attached (%)
Housing units in structures - 2 (%)
Housing units in structures - 3 or 4 (%)
Housing units in structures - 5 to 9 (%)
Housing units in structures - 10 to 19 (%)
Housing units in structures - 20 to 49 (%)
Housing units in structures - 50 or more (%)
Housing units in structures - Mobile home (%)
Housing units in structures - Boat, RV, van, etc. (%)
House/condo owner moved in on average (years ago)
Renter moved in on average (years ago)
Year householder moved into unit - Moved in 1999 to March 2000 (%)
Year householder moved into unit - Moved in 1995 to 1998 (%)
Year householder moved into unit - Moved in 1990 to 1994 (%)
Year householder moved into unit - Moved in 1980 to 1989 (%)
Year householder moved into unit - Moved in 1970 to 1979 (%)
Year householder moved into unit - Moved in 1969 or earlier (%)
Means of transportation to work - Drove car alone (%)
Means of transportation to work - Carpooled (%)
Means of transportation to work - Public transportation (%)
Means of transportation to work - Bus or trolley bus (%)
Means of transportation to work - Streetcar or trolley car (%)
Means of transportation to work - Subway or elevated (%)
Means of transportation to work - Railroad (%)
Means of transportation to work - Ferryboat (%)
Means of transportation to work - Taxicab (%)
Means of transportation to work - Motorcycle (%)
Means of transportation to work - Bicycle (%)
Means of transportation to work - Walked (%)
Means of transportation to work - Other means (%)
Working at home (%)
Industry diversity
Most Common Industries - Agriculture, forestry, fishing and hunting, and mining (%)
Most Common Industries - Agriculture, forestry, fishing and hunting (%)
Most Common Industries - Mining, quarrying, and oil and gas extraction (%)
Most Common Industries - Construction (%)
Most Common Industries - Manufacturing (%)
Most Common Industries - Wholesale trade (%)
Most Common Industries - Retail trade (%)
Most Common Industries - Transportation and warehousing, and utilities (%)
Most Common Industries - Transportation and warehousing (%)
Most Common Industries - Utilities (%)
Most Common Industries - Information (%)
Most Common Industries - Finance and insurance, and real estate and rental and leasing (%)
Most Common Industries - Finance and insurance (%)
Most Common Industries - Real estate and rental and leasing (%)
Most Common Industries - Professional, scientific, and management, and administrative and waste management services (%)
Most Common Industries - Professional, scientific, and technical services (%)
Most Common Industries - Management of companies and enterprises (%)
Most Common Industries - Administrative and support and waste management services (%)
Most Common Industries - Educational services, and health care and social assistance (%)
Most Common Industries - Educational services (%)
Most Common Industries - Health care and social assistance (%)
Most Common Industries - Arts, entertainment, and recreation, and accommodation and food services (%)
Most Common Industries - Arts, entertainment, and recreation (%)
Most Common Industries - Accommodation and food services (%)
Most Common Industries - Other services, except public administration (%)
Most Common Industries - Public administration (%)
Occupation diversity
Most Common Occupations - Management, business, science, and arts occupations (%)
Most Common Occupations - Management, business, and financial occupations (%)
Most Common Occupations - Management occupations (%)
Most Common Occupations - Business and financial operations occupations (%)
Most Common Occupations - Computer, engineering, and science occupations (%)
Most Common Occupations - Computer and mathematical occupations (%)
Most Common Occupations - Architecture and engineering occupations (%)
Most Common Occupations - Life, physical, and social science occupations (%)
Most Common Occupations - Education, legal, community service, arts, and media occupations (%)
Most Common Occupations - Community and social service occupations (%)
Most Common Occupations - Legal occupations (%)
Most Common Occupations - Education, training, and library occupations (%)
Most Common Occupations - Arts, design, entertainment, sports, and media occupations (%)
Most Common Occupations - Healthcare practitioners and technical occupations (%)
Most Common Occupations - Health diagnosing and treating practitioners and other technical occupations (%)
Most Common Occupations - Health technologists and technicians (%)
Most Common Occupations - Service occupations (%)
Most Common Occupations - Healthcare support occupations (%)
Most Common Occupations - Protective service occupations (%)
Most Common Occupations - Fire fighting and prevention, and other protective service workers including supervisors (%)
Most Common Occupations - Law enforcement workers including supervisors (%)
Most Common Occupations - Food preparation and serving related occupations (%)
Most Common Occupations - Building and grounds cleaning and maintenance occupations (%)
Most Common Occupations - Personal care and service occupations (%)
Most Common Occupations - Sales and office occupations (%)
Most Common Occupations - Sales and related occupations (%)
Most Common Occupations - Office and administrative support occupations (%)
Most Common Occupations - Natural resources, construction, and maintenance occupations (%)
Most Common Occupations - Farming, fishing, and forestry occupations (%)
Most Common Occupations - Construction and extraction occupations (%)
Most Common Occupations - Installation, maintenance, and repair occupations (%)
Most Common Occupations - Production, transportation, and material moving occupations (%)
Most Common Occupations - Production occupations (%)
Most Common Occupations - Transportation occupations (%)
Most Common Occupations - Material moving occupations (%)
People in Group quarters - Institutionalized population (%)
People in Group quarters - Correctional institutions (%)
People in Group quarters - Federal prisons and detention centers (%)
People in Group quarters - Halfway houses (%)
People in Group quarters - Local jails and other confinement facilities (including police lockups) (%)
People in Group quarters - Military disciplinary barracks (%)
People in Group quarters - State prisons (%)
People in Group quarters - Other types of correctional institutions (%)
People in Group quarters - Nursing homes (%)
People in Group quarters - Hospitals/wards, hospices, and schools for the handicapped (%)
People in Group quarters - Hospitals/wards and hospices for chronically ill (%)
People in Group quarters - Hospices or homes for chronically ill (%)
People in Group quarters - Military hospitals or wards for chronically ill (%)
People in Group quarters - Other hospitals or wards for chronically ill (%)
People in Group quarters - Hospitals or wards for drug/alcohol abuse (%)
People in Group quarters - Mental (Psychiatric) hospitals or wards (%)
People in Group quarters - Schools, hospitals, or wards for the mentally retarded (%)
People in Group quarters - Schools, hospitals, or wards for the physically handicapped (%)
People in Group quarters - Institutions for the deaf (%)
People in Group quarters - Institutions for the blind (%)
People in Group quarters - Orthopedic wards and institutions for the physically handicapped (%)
People in Group quarters - Wards in general hospitals for patients who have no usual home elsewhere (%)
People in Group quarters - Wards in military hospitals for patients who have no usual home elsewhere (%)
People in Group quarters - Juvenile institutions (%)
People in Group quarters - Long-term care (%)
People in Group quarters - Homes for abused, dependent, and neglected children (%)
People in Group quarters - Residential treatment centers for emotionally disturbed children (%)
People in Group quarters - Training schools for juvenile delinquents (%)
People in Group quarters - Short-term care, detention or diagnostic centers for delinquent children (%)
People in Group quarters - Type of juvenile institution unknown (%)
People in Group quarters - Noninstitutionalized population (%)
People in Group quarters - College dormitories (includes college quarters off campus) (%)
People in Group quarters - Military quarters (%)
People in Group quarters - On base (%)
People in Group quarters - Barracks, unaccompanied personnel housing (UPH), (Enlisted/Officer), ;and similar group living quarters for military personnel (%)
People in Group quarters - Transient quarters for temporary residents (%)
People in Group quarters - Military ships (%)
People in Group quarters - Group homes (%)
People in Group quarters - Homes or halfway houses for drug/alcohol abuse (%)
People in Group quarters - Homes for the mentally ill (%)
People in Group quarters - Homes for the mentally retarded (%)
People in Group quarters - Homes for the physically handicapped (%)
People in Group quarters - Other group homes (%)
People in Group quarters - Religious group quarters (%)
People in Group quarters - Dormitories (%)
People in Group quarters - Agriculture workers' dormitories on farms (%)
People in Group quarters - Job Corps and vocational training facilities (%)
People in Group quarters - Other workers' dormitories (%)
People in Group quarters - Crews of maritime vessels (%)
People in Group quarters - Other nonhousehold living situations (%)
People in Group quarters - Other noninstitutional group quarters (%)
Residents speaking English at home (%)
Residents speaking English at home - Born in the United States (%)
Residents speaking English at home - Native, born elsewhere (%)
Residents speaking English at home - Foreign born (%)
Residents speaking Spanish at home (%)
Residents speaking Spanish at home - Born in the United States (%)
Residents speaking Spanish at home - Native, born elsewhere (%)
Residents speaking Spanish at home - Foreign born (%)
Residents speaking other language at home (%)
Residents speaking other language at home - Born in the United States (%)
Residents speaking other language at home - Native, born elsewhere (%)
Residents speaking other language at home - Foreign born (%)
Class of Workers - Employee of private company (%)
Class of Workers - Self-employed in own incorporated business (%)
Class of Workers - Private not-for-profit wage and salary workers (%)
Class of Workers - Local government workers (%)
Class of Workers - State government workers (%)
Class of Workers - Federal government workers (%)
Class of Workers - Self-employed workers in own not incorporated business and Unpaid family workers (%)
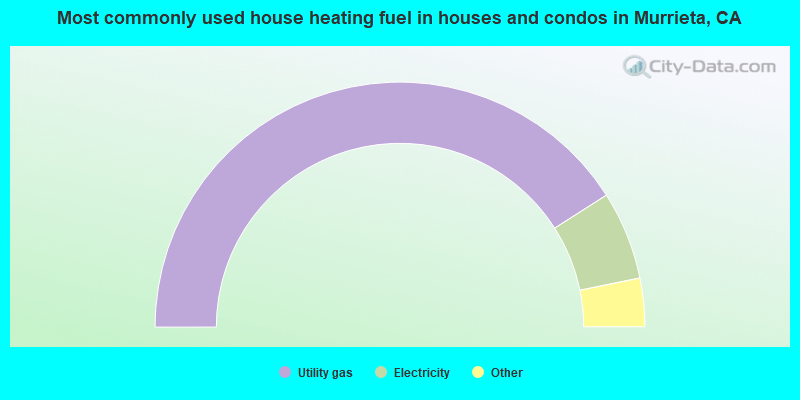
House heating fuel used in houses and condos - Utility gas (%)
House heating fuel used in houses and condos - Bottled, tank, or LP gas (%)
House heating fuel used in houses and condos - Electricity (%)
House heating fuel used in houses and condos - Fuel oil, kerosene, etc. (%)
House heating fuel used in houses and condos - Coal or coke (%)
House heating fuel used in houses and condos - Wood (%)
House heating fuel used in houses and condos - Solar energy (%)
House heating fuel used in houses and condos - Other fuel (%)
House heating fuel used in houses and condos - No fuel used (%)
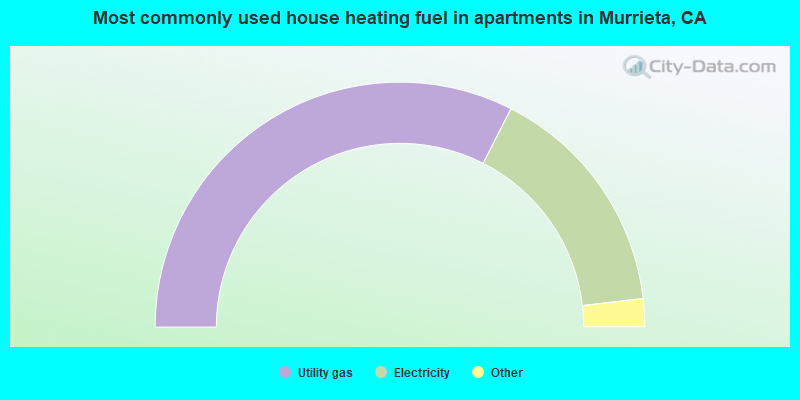
House heating fuel used in apartments - Utility gas (%)
House heating fuel used in apartments - Bottled, tank, or LP gas (%)
House heating fuel used in apartments - Electricity (%)
House heating fuel used in apartments - Fuel oil, kerosene, etc. (%)
House heating fuel used in apartments - Coal or coke (%)
House heating fuel used in apartments - Wood (%)
House heating fuel used in apartments - Solar energy (%)
House heating fuel used in apartments - Other fuel (%)
House heating fuel used in apartments - No fuel used (%)
Armed forces status - In Armed Forces (%)
Armed forces status - Civilian (%)
Armed forces status - Civilian - Veteran (%)
Armed forces status - Civilian - Nonveteran (%)
Fatal accidents locations in years 2005-2021
Fatal accidents locations in 2005
Fatal accidents locations in 2006
Fatal accidents locations in 2007
Fatal accidents locations in 2008
Fatal accidents locations in 2009
Fatal accidents locations in 2010
Fatal accidents locations in 2011
Fatal accidents locations in 2012
Fatal accidents locations in 2013
Fatal accidents locations in 2014
Fatal accidents locations in 2015
Fatal accidents locations in 2016
Fatal accidents locations in 2017
Fatal accidents locations in 2018
Fatal accidents locations in 2019
Fatal accidents locations in 2020
Fatal accidents locations in 2021
Alcohol use - People drinking some alcohol every month (%)
Alcohol use - People not drinking at all (%)
Alcohol use - Average days/month drinking alcohol
Alcohol use - Average drinks/week
Alcohol use - Average days/year people drink much
Audiometry - Average condition of hearing (%)
Audiometry - People that can hear a whisper from across a quiet room (%)
Audiometry - People that can hear normal voice from across a quiet room (%)
Audiometry - Ears ringing, roaring, buzzing (%)
Audiometry - Had a job exposure to loud noise (%)
Audiometry - Had off-work exposure to loud noise (%)
Blood Pressure & Cholesterol - Has high blood pressure (%)
Blood Pressure & Cholesterol - Checking blood pressure at home (%)
Blood Pressure & Cholesterol - Frequently checking blood cholesterol (%)
Blood Pressure & Cholesterol - Has high cholesterol level (%)
Consumer Behavior - Money monthly spent on food at supermarket/grocery store
Consumer Behavior - Money monthly spent on food at other stores
Consumer Behavior - Money monthly spent on eating out
Consumer Behavior - Money monthly spent on carryout/delivered foods
Consumer Behavior - Income spent on food at supermarket/grocery store (%)
Consumer Behavior - Income spent on food at other stores (%)
Consumer Behavior - Income spent on eating out (%)
Consumer Behavior - Income spent on carryout/delivered foods (%)
Current Health Status - General health condition (%)
Current Health Status - Blood donors (%)
Current Health Status - Has blood ever tested for HIV virus (%)
Current Health Status - Left-handed people (%)
Dermatology - People using sunscreen (%)
Diabetes - Diabetics (%)
Diabetes - Had a blood test for high blood sugar (%)
Diabetes - People taking insulin (%)
Diet Behavior & Nutrition - Diet health (%)
Diet Behavior & Nutrition - Milk product consumption (# of products/month)
Diet Behavior & Nutrition - Meals not home prepared (#/week)
Diet Behavior & Nutrition - Meals from fast food or pizza place (#/week)
Diet Behavior & Nutrition - Ready-to-eat foods (#/month)
Diet Behavior & Nutrition - Frozen meals/pizza (#/month)
Drug Use - People that ever used marijuana or hashish (%)
Drug Use - Ever used hard drugs (%)
Drug Use - Ever used any form of cocaine (%)
Drug Use - Ever used heroin (%)
Drug Use - Ever used methamphetamine (%)
Health Insurance - People covered by health insurance (%)
Kidney Conditions-Urology - Avg. # of times urinating at night
Medical Conditions - People with asthma (%)
Medical Conditions - People with anemia (%)
Medical Conditions - People with psoriasis (%)
Medical Conditions - People with overweight (%)
Medical Conditions - Elderly people having difficulties in thinking or remembering (%)
Medical Conditions - People who ever received blood transfusion (%)
Medical Conditions - People having trouble seeing even with glass/contacts (%)
Medical Conditions - People with arthritis (%)
Medical Conditions - People with gout (%)
Medical Conditions - People with congestive heart failure (%)
Medical Conditions - People with coronary heart disease (%)
Medical Conditions - People with angina pectoris (%)
Medical Conditions - People who ever had heart attack (%)
Medical Conditions - People who ever had stroke (%)
Medical Conditions - People with emphysema (%)
Medical Conditions - People with thyroid problem (%)
Medical Conditions - People with chronic bronchitis (%)
Medical Conditions - People with any liver condition (%)
Medical Conditions - People who ever had cancer or malignancy (%)
Mental Health - People who have little interest in doing things (%)
Mental Health - People feeling down, depressed, or hopeless (%)
Mental Health - People who have trouble sleeping or sleeping too much (%)
Mental Health - People feeling tired or having little energy (%)
Mental Health - People with poor appetite or overeating (%)
Mental Health - People feeling bad about themself (%)
Mental Health - People who have trouble concentrating on things (%)
Mental Health - People moving or speaking slowly or too fast (%)
Mental Health - People having thoughts they would be better off dead (%)
Oral Health - Average years since last visit a dentist
Oral Health - People embarrassed because of mouth (%)
Oral Health - People with gum disease (%)
Oral Health - General health of teeth and gums (%)
Oral Health - Average days a week using dental floss/device
Oral Health - Average days a week using mouthwash for dental problem
Oral Health - Average number of teeth
Pesticide Use - Households using pesticides to control insects (%)
Pesticide Use - Households using pesticides to kill weeds (%)
Physical Activity - People doing vigorous-intensity work activities (%)
Physical Activity - People doing moderate-intensity work activities (%)
Physical Activity - People walking or bicycling (%)
Physical Activity - People doing vigorous-intensity recreational activities (%)
Physical Activity - People doing moderate-intensity recreational activities (%)
Physical Activity - Average hours a day doing sedentary activities
Physical Activity - Average hours a day watching TV or videos
Physical Activity - Average hours a day using computer
Physical Functioning - People having limitations keeping them from working (%)
Physical Functioning - People limited in amount of work they can do (%)
Physical Functioning - People that need special equipment to walk (%)
Physical Functioning - People experiencing confusion/memory problems (%)
Physical Functioning - People requiring special healthcare equipment (%)
Prescription Medications - Average number of prescription medicines taking
Preventive Aspirin Use - Adults 40+ taking low-dose aspirin (%)
Reproductive Health - Vaginal deliveries (%)
Reproductive Health - Cesarean deliveries (%)
Reproductive Health - Deliveries resulted in a live birth (%)
Reproductive Health - Pregnancies resulted in a delivery (%)
Reproductive Health - Women breastfeeding newborns (%)
Reproductive Health - Women that had a hysterectomy (%)
Reproductive Health - Women that had both ovaries removed (%)
Reproductive Health - Women that have ever taken birth control pills (%)
Reproductive Health - Women taking birth control pills (%)
Reproductive Health - Women that have ever used Depo-Provera or injectables (%)
Reproductive Health - Women that have ever used female hormones (%)
Sexual Behavior - People 18+ that ever had sex (vaginal, anal, or oral) (%)
Sexual Behavior - Males 18+ that ever had vaginal sex with a woman (%)
Sexual Behavior - Males 18+ that ever performed oral sex on a woman (%)
Sexual Behavior - Males 18+ that ever had anal sex with a woman (%)
Sexual Behavior - Males 18+ that ever had any sex with a man (%)
Sexual Behavior - Females 18+ that ever had vaginal sex with a man (%)
Sexual Behavior - Females 18+ that ever performed oral sex on a man (%)
Sexual Behavior - Females 18+ that ever had anal sex with a man (%)
Sexual Behavior - Females 18+ that ever had any kind of sex with a woman (%)
Sexual Behavior - Average age people first had sex
Sexual Behavior - Average number of female sex partners in lifetime (males 18+)
Sexual Behavior - Average number of female vaginal sex partners in lifetime (males 18+)
Sexual Behavior - Average age people first performed oral sex on a woman (18+)
Sexual Behavior - Average number of woman performed oral sex on in lifetime (18+)
Sexual Behavior - Average number of male sex partners in lifetime (males 18+)
Sexual Behavior - Average number of male anal sex partners in lifetime (males 18+)
Sexual Behavior - Average age people first performed oral sex on a man (18+)
Sexual Behavior - Average number of male oral sex partners in lifetime (18+)
Sexual Behavior - People using protection when performing oral sex (%)
Sexual Behavior - Average number of times people have vaginal or anal sex a year
Sexual Behavior - People having sex without condom (%)
Sexual Behavior - Average number of male sex partners in lifetime (females 18+)
Sexual Behavior - Average number of male vaginal sex partners in lifetime (females 18+)
Sexual Behavior - Average number of female sex partners in lifetime (females 18+)
Sexual Behavior - Circumcised males 18+ (%)
Sleep Disorders - Average hours sleeping at night
Sleep Disorders - People that has trouble sleeping (%)
Smoking-Cigarette Use - People smoking cigarettes (%)
Taste & Smell - People 40+ having problems with smell (%)
Taste & Smell - People 40+ having problems with taste (%)
Taste & Smell - People 40+ that ever had wisdom teeth removed (%)
Taste & Smell - People 40+ that ever had tonsils teeth removed (%)
Taste & Smell - People 40+ that ever had a loss of consciousness because of a head injury (%)
Taste & Smell - People 40+ that ever had a broken nose or other serious injury to face or skull (%)
Taste & Smell - People 40+ that ever had two or more sinus infections (%)
Weight - Average height (inches)
Weight - Average weight (pounds)
Weight - Average BMI
Weight - People that are obese (%)
Weight - People that ever were obese (%)
Weight - People trying to lose weight (%)
52,463 46.1% White alone 38,470 33.8% Hispanic 7,872 6.9% Asian alone 6,568 5.8% Two or more races 6,368 5.6% Black alone 1,654 1.5% Other race alone 242 0.2% American Indian alone 137 0.1% Native Hawaiian and Other
According to our research of California and other state lists, there were 75 registered sex offenders living in Murrieta, California as of April 18, 2024 . The ratio of all residents to sex offenders in Murrieta is 1,489 to 1.The ratio of registered sex offenders to all residents in this city is lower than the state average.
Officers per 1,000 residents here:
0.87California average:
2.30
Latest news from Murrieta, CA collected exclusively by city-data.com from local newspapers, TV, and radio stations
Ancestries: English (5.9%), German (4.9%), Irish (4.1%), American (3.7%), Italian (3.1%), European (3.1%).
Current Local Time:
Land area: 28.4 square miles.
Population density: 4,008 people per square mile (average).
17,756 residents are foreign born (7.3% Latin America , 5.8% Asia ).
This city:
15.6%California:
26.5%
Median real estate property taxes paid for housing units with mortgages in 2022: $6,094 (0.9%)Median real estate property taxes paid for housing units with no mortgage in 2022: $4,508 (0.7%)
Nearest city with pop. 50,000+: Temecula, CA
Nearest city with pop. 200,000+: Riverside, CA
Nearest city with pop. 1,000,000+: San Diego, CA
Nearest cities:
Latitude: 33.57 N, Longitude: 117.20 W
Daytime population change due to commuting: -14,983 (-13.2%)Workers who live and work in this city: 18,635 (34.7%)
Single-family new house construction building permits:
2022: 18 buildings , average cost: $220,4002021: 25 buildings , average cost: $394,0002020: 136 buildings , average cost: $366,0002019: 162 buildings , average cost: $275,5002018: 397 buildings , average cost: $270,8002017: 200 buildings , average cost: $274,0002016: 143 buildings , average cost: $271,3002015: 182 buildings , average cost: $266,5002014: 16 buildings , average cost: $297,5002013: 13 buildings , average cost: $550,1002012: 35 buildings , average cost: $240,7002011: 67 buildings , average cost: $267,3002010: 40 buildings , average cost: $270,1002009: 42 buildings , average cost: $223,3002008: 15 buildings , average cost: $375,1002007: 93 buildings , average cost: $328,0002006: 377 buildings , average cost: $351,6002005: 2147 buildings , average cost: $173,0002004: 2509 buildings , average cost: $170,7002003: 1530 buildings , average cost: $188,2002002: 1648 buildings , average cost: $158,5002001: 1069 buildings , average cost: $155,3002000: 886 buildings , average cost: $190,4001999: 653 buildings , average cost: $189,9001998: 833 buildings , average cost: $177,0001997: 713 buildings , average cost: $173,900Unemployment in December 2023:
Most common occupations in Murrieta, CA (%)
Both Males Females
Other sales and related occupations, including supervisors (5.8%)
Sales representatives, services, wholesale and manufacturing (5.1%)
Other management occupations, except farmers and farm managers (4.9%)
Preschool, kindergarten, elementary, and middle school teachers (3.7%)
Retail sales workers, except cashiers (3.4%)
Other office and administrative support workers, including supervisors (3.0%)
Electrical equipment mechanics and other installation, maintenance, and repair workers, including supervisors (2.8%)
Sales representatives, services, wholesale and manufacturing (6.7%)
Other sales and related occupations, including supervisors (5.7%)
Other management occupations, except farmers and farm managers (5.3%)
Electrical equipment mechanics and other installation, maintenance, and repair workers, including supervisors (4.8%)
Driver/sales workers and truck drivers (4.6%)
Material recording, scheduling, dispatching, and distributing workers (3.3%)
Top executives (3.1%)
Preschool, kindergarten, elementary, and middle school teachers (6.3%)
Secretaries and administrative assistants (5.9%)
Other sales and related occupations, including supervisors (5.8%)
Other office and administrative support workers, including supervisors (5.4%)
Retail sales workers, except cashiers (4.6%)
Other management occupations, except farmers and farm managers (4.4%)
Cashiers (4.3%)
Earthquake activity:
Murrieta-area historical earthquake activity is significantly above California state average. It is 6842% greater than the overall U.S. average. On 6/28/1992 at 11:57:34, a magnitude 7.6 (6.2 MB, 7.6 MS, 7.3 MW, Depth: 0.7 mi, Class: Major, Intensity: VIII - XII) earthquake occurred 57.3 miles away from the city center, causing 3 deaths ( 1 shaking deaths, 2 other deaths) and 400 injuries, causing $100,000,000 total damage and $40,000,000 insured lossesOn 7/21/1952 at 11:52:14, a magnitude 7.7 (7.7 UK) earthquake occurred 142.6 miles away from the city center, causing $50,000,000 total damage On 10/16/1999 at 09:46:44, a magnitude 7.4 (6.3 MB, 7.4 MS, 7.2 MW, 7.3 ML) earthquake occurred 78.8 miles away from Murrieta center On 5/19/1940 at 04:36:40, a magnitude 7.2 (7.2 UK) earthquake occurred 90.2 miles away from the city center, causing $33,000,000 total damage On 4/21/1918 at 22:32:30, a magnitude 6.8 (6.8 UK, Class: Strong, Intensity: VII - IX) earthquake occurred 21.6 miles away from Murrieta center On 12/31/1934 at 18:45:56, a magnitude 7.1 (7.1 UK) earthquake occurred 103.5 miles away from Murrieta center Magnitude types: body-wave magnitude (MB), local magnitude (ML), surface-wave magnitude (MS), moment magnitude (MW) Natural disasters: The number of natural disasters in Riverside County (46) is a lot greater than the US average (15).Major Disasters (Presidential) Declared: 27Emergencies Declared: 1Fires: 22, Floods: 20, Storms: 8, Winter Storms: 8, Landslides: 6, Mudslides: 5, Heavy Rains: 2, Earthquake: 1, Flash Flood: 1, Freeze: 1, Hurricane: 1, Tornado: 1, Tropical Storm: 1, Other: 1 (Note: some incidents may be assigned to more than one category). Hospitals and medical centers in Murrieta: LOMA LINDA UNIVERSITY MEDICAL CENTER-MURRIETA (Proprietary, provides emergency services, 28062 BAXTER ROAD) SOUTHWEST HEALTHCARE SYSTEM (Proprietary, 25500 MEDICAL CENTER DRIVE) COUNTRY VILLA MURRIETA HEALTHCARE CENTER (24100 MONROE AVENUE)
RANCHO SPRINGS MEDICAL CENTER D/P SNF (25500 MEDICAL CENTER DRIVE)
DAVITA-MURRIETA (25100 HANCOCK AVENUE, SUITE 101-103)
Amtrak stations near Murrieta: 16 miles: PERRIS (B.W. PERRIS INN, 480 REDLANDS AVE.) - Bus Station 17 miles: HEMET (COCOS REST., 3246 FLORIDA AVE.) - Bus Station
College/University in Murrieta: The University of America Location: 38397 Innovation Court; Private, not-for-profit; Website: ua-edu.us; Offers Doctor's degree )
Colleges/universities with over 2000 students nearest to Murrieta:
Mt San Jacinto Community College District (about 22 miles; San Jacinto, CA ; Full-time enrollment: 8,426)
Moreno Valley College (about 22 miles; Moreno Valley, CA ; FT enrollment: 4,650)
Saddleback College (about 27 miles; Mission Viejo, CA ; FT enrollment: 13,716)
MiraCosta College (about 27 miles; Oceanside, CA ; FT enrollment: 11,189)
California Baptist University (about 28 miles; Riverside, CA ; FT enrollment: 6,085)
La Sierra University (about 29 miles; Riverside, CA ; FT enrollment: 2,205)
Palomar College (about 30 miles; San Marcos, CA ; FT enrollment: 15,037)
Public high schools in Murrieta: VISTA MURRIETA HIGH Students: 2,559, Location: 28251 CLINTON KEITH RD., Grades: 9-12)MURRIETA VALLEY HIGH Students: 2,268, Location: 42200 NIGHTHAWK WAY, Grades: 9-12)MURRIETA MESA HIGH Students: 427, Location: 24801 MONROE AVE., Grades: 9-12)TENAJA CANYON ACADEMY Students: 30, Location: 24150 HAYES AVE., Grades: KG-12)Private high schools in Murrieta: CALVARY MURRIETA CHRISTIAN SCHOOLS Students: 718, Location: 24225 MONROE AVE, Grades: PK-12)
OAK GROVE INSTITUTE Students: 169, Location: 24275 JEFFERSON AVE, Grades: UG-12)
MURRIETA SPRINGS ADVENTIST CHRISTIAN ACADEMY Students: 70, Location: 32477 STARBUCK CIR, Grades: KG-9)
Biggest public elementary/middle schools in Murrieta: SHIVELA MIDDLE Students: 1,555, Location: 24515 LINCOLN AVE., Grades: 6-8)WARM SPRINGS MIDDLE Students: 1,289, Location: 39245 CALLE DE FORTUNA, Grades: 6-8)BELLA VISTA MIDDLE Students: 1,219, Location: 31650 BROWNING ST., Grades: 6-8)LISA J. MAILS ELEMENTARY Students: 868, Location: 35185 BRIGGS RD., Grades: KG-7)DOROTHY MCELHINNEY MIDDLE Students: 740, Location: 35185 BRIGGS RD., Grades: 6-8)DANIEL N. BUCHANAN ELEMENTARY Students: 695, Location: 40121 TORREY PINES RD., Grades: KG-5)MURRIETA ELEMENTARY Students: 614, Location: 24725 ADAMS AVE., Grades: KG-5)ANTELOPE HILLS ELEMENTARY Students: 551, Location: 36105 MURRIETA OAKS AVE., Grades: KG-5)MONTE VISTA ELEMENTARY Students: 548, Location: 37420 VIA MIRA MOSA, Grades: KG-5)TOVASHAL ELEMENTARY Students: 504, Location: 23801 VIA SANTEE, Grades: KG-5)See full list of schools located in Murrieta Library in Murrieta: MURRIETA PUBLIC LIBRARY Operating income: $2,323,863; Location: EIGHT TOWN SQUARE; 81,182 books ; 2,649 audio materials ; 4,722 video materials ; 5 local licensed databases ; 34 other licensed databases ; 210 print serial subscriptions ; 2 electronic serial subscriptions )
User-submitted facts and corrections:
There are two additional medical facilities: Rancho Springs Medical Center and Inland Valley Medical Center.
Notable locations in Murrieta: (A) , The Colony Golf Course (B) , Bear Creek Golf and Country Club (C) , Riverside County Bear Creek Forest Service Station (D) , Murrieta Town Hall (E) , Murrieta Chamber of Commerce (F) , American Medical Response Unit 302 (G) , American Medical Response Murrieta Station 2 (H) , Riverside County Fire Department Station 75 - Bear Creek (I) , Murrieta Fire Department Station 4 (J) , Murrieta Fire Department Station 2 (K) , Murrieta Fire Department Station 3 (L) , Murrieta Fire Department Station 1 (M) . Display/hide their locations on the map
Shopping Center: (1) . Display/hide its location on the map
Churches in Murrieta include: (A) , United Church of the Valley (B) . Display/hide their locations on the map
Cemetery: (1) . Display/hide its location on the map
Creek: (A) . Display/hide its location on the map
Parks in Murrieta include: (1) , California Oaks Sports Park (2) , Meadow Ridge Park (3) , Park F (4) , Pond Park (5) , Rancho Acacias Park (6) , Willowglen Park (7) . Display/hide their locations on the map
Tourist attractions: (1) , Brunswick Recreation Centers (Brunswick Cal Oaks B) (2) . Display/hide their approximate locations on the map
Birthplace of: Rickie Fowler - Professional golfer, Ambyr Childers - Soap opera actor, Daniel Fleming - College basketball player (UC Riverside Highlanders), Federico Lopez (fighter) - Martial artist, Ike Williams - College basketball player (UCLA Bruins).
Riverside County has a predicted average indoor radon screening level between 2 and 4 pCi/L (pico curies per liter) - Moderate Potential Average household size: This city:
3.1 peopleCalifornia:
2.9 people
Percentage of family households: This city:
79.5%Whole state:
68.7%
Percentage of households with unmarried partners: This city:
5.6%Whole state:
7.2%
Likely homosexual households (counted as self-reported same-sex unmarried-partner households)
Lesbian couples: 0.4% of all households Gay men: 0.2% of all households
People in group quarters in Murrieta in 2010:
143 people in college/university student housing
96 people in workers' group living quarters and job corps centers
76 people in residential treatment centers for juveniles (non-correctional)
56 people in nursing facilities/skilled-nursing facilities
52 people in group homes intended for adults
6 people in in-patient hospice facilities
People in group quarters in Murrieta in 2000:
73 people in other group homes
63 people in nursing homes
50 people in other noninstitutional group quarters
Banks with most branches in Murrieta (2011 data):
Bank of America, National Association: Murrieta Branch, Clinton Keith Branch, West Murrieta Branch, Winchester Branch. Info updated 2009/11/18: Bank assets: $1,451,969.3 mil, Deposits: $1,077,176.8 mil, headquarters in Charlotte, NC, positive income , 5782 total offices , Holding Company: Bank Of America Corporation
Wells Fargo Bank, National Association: Silverhawk Branch, Cal-Oaks Plaza Branch, Murrieta Branch, Heritage Marketplace. Info updated 2011/04/05: Bank assets: $1,161,490.0 mil, Deposits: $905,653.0 mil, headquarters in Sioux Falls, SD, positive income , 6395 total offices , Holding Company: Wells Fargo & Company
U.S. Bank National Association: Temecula Albertsons Branch, Murrieta & Winchester Vons Branch, Murrieta Ralphs Branch, Murrieta Stater Brothers. Info updated 2012/01/30: Bank assets: $330,470.8 mil, Deposits: $236,091.5 mil, headquarters in Cincinnati, OH, positive income , 3121 total offices , Holding Company: U.S. Bancorp
JPMorgan Chase Bank, National Association: Murrieta Albertsons Branch at 28047 Scott Rd, branch established on 2010/09/22; Murrieta Branch at 40655 California Oaks Road, branch established on 1990/05/29. Info updated 2011/11/10: Bank assets: $1,811,678.0 mil, Deposits: $1,190,738.0 mil, headquarters in Columbus, OH, positive income , International Specialization, 5577 total offices , Holding Company: Jpmorgan Chase & Co.
Commerce Bank of Temecula Valley: Commerce Bank Of Temecula Valley at 25220 Hancock Avenue, Suite #140, branch established on 2007/09/17. Info updated 2011/09/07: Bank assets: $46.0 mil, Deposits: $36.6 mil, local headquarters , negative income in the last year , Commercial Lending Specialization, 1 total offices
First-Citizens Bank & Trust Company: Murrieta Branch at 41500 Ivy Street, branch established on 2001/01/11. Info updated 2011/10/11: Bank assets: $20,566.4 mil, Deposits: $17,596.8 mil, headquarters in Raleigh, NC, positive income , Commercial Lending Specialization, 433 total offices , Holding Company: First Citizens Bancshares, Inc.
Rabobank, National Association: Murrieta Branch at 40723 Murrieta Hot Springs Rd., branch established on 2007/07/01. Info updated 2011/01/27: Bank assets: $11,745.0 mil, Deposits: $8,446.0 mil, headquarters in Roseville, CA, positive income , Agricultural Specialization, 124 total offices , Holding Company: Cooperatieve Centrale Raiffeisen-Boerenleenbank B.A., "rabobank Nederland
Compass Bank: Murrieta Branch at 40780 California Oaks Road, branch established on 1991/03/01. Info updated 2011/02/24: Bank assets: $63,107.0 mil, Deposits: $46,232.4 mil, headquarters in Birmingham, AL, negative income in the last year , Commercial Lending Specialization, 720 total offices , Holding Company: Banco Bilbao Vizcaya Argentaria, S.A.
Pacific Western Bank: Murrieta Branch Office at 41381 Kalmia Avenue, branch established on 2004/10/04. Info updated 2011/03/14: Bank assets: $5,513.1 mil, Deposits: $4,614.5 mil, headquarters in Los Angeles, CA, positive income , Commercial Lending Specialization, 78 total offices , Holding Company: Capgen Capital Group Ii Lp
For population 15 years and over in Murrieta:
Never married: 31.7%Now married: 52.6%Separated: 1.8%Widowed: 4.3%Divorced: 9.6% For population 25 years and over in Murrieta:
High school or higher: 92.7%Bachelor's degree or higher: 30.7%Graduate or professional degree: 11.1%Unemployed: 4.6%Mean travel time to work (commute): 27.6 minutes
Education Gini index (Inequality in education) Here:
10.2California average:
15.5
Religion statistics for Murrieta, CA (based on Riverside County data)
Religion Adherents Congregations Catholic 602,765 51 Evangelical Protestant 240,306 741 Other 77,581 194 Mainline Protestant 29,535 103 Black Protestant 19,170 40 Orthodox 3,647 11 None 1,216,637 -
Source: Clifford Grammich, Kirk Hadaway, Richard Houseal, Dale E.Jones, Alexei Krindatch, Richie Stanley and Richard H.Taylor. 2012. 2010 U.S.Religion Census: Religious Congregations & Membership Study. Association of Statisticians of American Religious Bodies. Jones, Dale E., et al. 2002. Congregations and Membership in the United States 2000. Nashville, TN: Glenmary Research Center. Graphs represent county-level data
Food Environment Statistics: Number of grocery stores : 330This county :
1.60 / 10,000 pop.California :
2.14 / 10,000 pop.
Number of supercenters and club stores : 11This county :
0.05 / 10,000 pop.California :
0.04 / 10,000 pop.
Number of convenience stores (no gas) : 91Here :
0.44 / 10,000 pop.State :
0.62 / 10,000 pop.
Number of convenience stores (with gas) : 311This county :
1.51 / 10,000 pop.California :
1.49 / 10,000 pop.
Number of full-service restaurants : 1,125This county :
5.45 / 10,000 pop.California :
7.42 / 10,000 pop.
Adult diabetes rate : This county :
7.7%California :
7.3%
Adult obesity rate : This county :
24.5%California :
21.3%
Low-income preschool obesity rate : Here :
15.2%California :
17.9%
Health and Nutrition: Healthy diet rate : Here:
51.2%California:
49.4%
Average overall health of teeth and gums : Murrieta:
49.9%State:
48.0%
Average BMI : Murrieta:
28.5California:
28.1
People feeling badly about themselves : Here:
20.6%California:
20.2%
People not drinking alcohol at all : This city:
10.1%California:
11.2%
Average hours sleeping at night : Murrieta:
6.8California:
6.8
Overweight people : Here:
34.9%California:
31.5%
General health condition : Here:
57.8%California:
56.4%
Average condition of hearing : Here:
80.2%California:
80.9%
More about Health and Nutrition of Murrieta, CA Residents
Local government employment and payroll (March 2022)
Function
Full-time employees
Monthly full-time payroll
Average yearly full-time wage
Part-time employees
Monthly part-time payroll
Police Protection - Officers
126 $1,125,072 $107,150 0 $0 Firefighters
66 $615,257 $111,865 0 $0 Police - Other
31 $131,314 $50,831 8 $12,723 Parks and Recreation
30 $217,827 $87,131 11 $19,534 Other and Unallocable
26 $168,501 $77,770 1 $2,881 Streets and Highways
19 $167,834 $106,000 0 $0 Other Government Administration
18 $157,382 $104,921 2 $3,855 Financial Administration
18 $118,266 $78,844 4 $20,549 Local Libraries
17 $137,592 $97,124 14 $30,172 Fire - Other
6 $50,766 $101,532 1 $2,834
Totals for Government
357 $2,889,810 $97,136 41 $92,548
Murrieta government finances - Expenditure in 2017 (per resident):
Construction - Regular Highways: $23,160,000 ($203.55)
Housing and Community Development: $6,893,000 ($60.58)Police Protection: $928,000 ($8.16)Protective Inspection and Regulation - Other: $462,000 ($4.06)Parks and Recreation: $23,000 ($0.20)Current Operations - Police Protection: $24,845,000 ($218.35)
Parks and Recreation: $10,408,000 ($91.47)Central Staff Services: $9,804,000 ($86.16)Protective Inspection and Regulation - Other: $4,460,000 ($39.20)Regular Highways: $3,695,000 ($32.47)Libraries: $2,114,000 ($18.58)Financial Administration: $1,882,000 ($16.54)Housing and Community Development: $1,828,000 ($16.07)Health - Other: $515,000 ($4.53)General - Interest on Debt: $2,652,000 ($23.31)
Other Capital Outlay - Police Protection: $859,000 ($7.55)
General - Other: $823,000 ($7.23)Regular Highways: $444,000 ($3.90)Central Staff Services: $111,000 ($0.98)Housing and Community Development: $37,000 ($0.33)
Murrieta government finances - Revenue in 2017 (per resident):
Charges - Other: $4,344,000 ($38.18)
Parks and Recreation: $798,000 ($7.01)Federal Intergovernmental - Other: $1,570,000 ($13.80)
Housing and Community Development: $73,000 ($0.64)Local Intergovernmental - Other: $698,000 ($6.13)
Miscellaneous - Special Assessments: $8,465,000 ($74.40)
Sale of Property: $857,000 ($7.53)Fines and Forfeits: $562,000 ($4.94)General Revenue - Other: $355,000 ($3.12)Interest Earnings: $224,000 ($1.97)Rents: $199,000 ($1.75)State Intergovernmental - Highways: $2,157,000 ($18.96)
Other: $1,178,000 ($10.35)General Local Government Support: $99,000 ($0.87)Tax - Property: $20,557,000 ($180.67)
General Sales and Gross Receipts: $17,901,000 ($157.33)Other License: $4,450,000 ($39.11)Public Utilities Sales: $3,558,000 ($31.27)Occupation and Business License - Other: $753,000 ($6.62)Other Selective Sales: $589,000 ($5.18)Documentary and Stock Transfer: $588,000 ($5.17)
Murrieta government finances - Debt in 2017 (per resident):
Long Term Debt - Beginning Outstanding - Unspecified Public Purpose: $54,318,000 ($477.38)
Outstanding Unspecified Public Purpose: $52,069,000 ($457.62)Retired Unspecified Public Purpose: $2,249,000 ($19.77)
Murrieta government finances - Cash and Securities in 2017 (per resident):
Bond Funds - Cash and Securities: $7,913,000 ($69.54)
Other Funds - Cash and Securities: $101,356,000 ($890.78)
Sinking Funds - Cash and Securities: $20,930,000 ($183.95)
7.19% of this county's 2021 resident taxpayers lived in other counties in 2020 ($71,521 average adjusted gross income )
Here:
7.19%California average:
5.19%
0.03% of residents moved from foreign countries ($210 average AGI )Riverside County:
0.03%California average:
0.03%
Top counties from which taxpayers relocated into this county between 2020 and 2021:
6.28% of this county's 2020 resident taxpayers moved to other counties in 2021 ($64,593 average adjusted gross income )
Here:
6.28%California average:
6.14%
0.02% of residents moved to foreign countries ($200 average AGI )Riverside County:
0.02%California average:
0.02%
Top counties to which taxpayers relocated from this county between 2020 and 2021:
Businesses in Murrieta, CA
Name Count Name Count
24 Hour Fitness 1 KFC 1 7-Eleven 3 Kohl's 1 99 Cents Only Stores 1 Kroger 3 AT&T 1 Lane Furniture 2 Albertsons 3 Little Caesars Pizza 2 Applebee's 1 Lowe's 1 Arby's 1 MasterBrand Cabinets 5 Ashley Furniture 1 McDonald's 4 AutoZone 1 Nike 5 BMW 1 Office Depot 1 Bed Bath & Beyond 1 OfficeMax 1 Big O Tires 1 Panda Express 2 Blockbuster 2 Payless 1 Brunswick Bowling & Billiards 1 Penske 1 Buffalo Wild Wings 1 PetSmart 1 Burger King 1 Pizza Hut 1 Burlington Coat Factory 1 Popeyes 1 CVS 3 Quiznos 1 Carl\s Jr. 4 RadioShack 1 Chick-Fil-A 1 Rite Aid 2 Chuck E. Cheese's 1 SONIC Drive-In 1 Circle K 2 Sam's Club 1 Cold Stone Creamery 1 Sears 1 Comfort Inn 1 Sprint Nextel 1 DHL 1 Staples 1 Dairy Queen 1 Starbucks 8 Decora Cabinetry 1 T-Mobile 6 Dennys 1 Taco Bell 2 Discount Tire 1 Target 2 Domino's Pizza 1 The Room Place 1 El Pollo Loco 1 Toys"R"Us 2 Famous Footwear 1 U-Haul 1 Fashion Bug 1 UPS 10 FedEx 7 Verizon Wireless 2 Goodwill 1 Volkswagen 1 H&R Block 2 Vons 1 Home Depot 1 Walgreens 4 IHOP 1 Walmart 1 Jack In The Box 4 Wendy's 1 Jones New York 2
Strongest AM radio stations in Murrieta:
KPLS (830 AM; 50 kW; ORANGE, CA; Owner: CRN LICENSES, LLC)
KFI (640 AM; 50 kW; LOS ANGELES, CA; Owner: CAPSTAR TX LIMITED PARTNERSHIP)
KFMB (760 AM; 50 kW; SAN DIEGO, CA; Owner: MIDWEST TELEVISION, INC.)
KLAC (570 AM; 50 kW; LOS ANGELES, CA; Owner: AMFM RADIO LICENSES, L.L.C.)
KTNQ (1020 AM; 50 kW; LOS ANGELES, CA; Owner: KTNQ-AM LICENSE CORP.)
KCBQ (1170 AM; 50 kW; SAN DIEGO, CA; Owner: RADIO 1210, INC.)
KXTA (1150 AM; 50 kW; LOS ANGELES, CA; Owner: CITICASTERS LICENSES, L.P.)
KPRZ (1210 AM; 20 kW; SAN MARCOS, CA; Owner: RADIO 1210, INC.)
KDIS (1110 AM; 50 kW; PASADENA, CA; Owner: ABC,INC.)
KFWB (980 AM; 50 kW; LOS ANGELES, CA; Owner: INFINITY BROADCASTING OPERATIONS, INC.)
KSPN (710 AM; 50 kW; LOS ANGELES, CA; Owner: KABC-AM RADIO, INC.)
KNX (1070 AM; 50 kW; LOS ANGELES, CA; Owner: INFINITY BROADCASTING OPERATIONS, INC.)
KMPC (1540 AM; 50 kW; LOS ANGELES, CA; Owner: ROSE CITY RADIO CORPORATION)
Strongest FM radio stations in Murrieta:
KRTM (88.9 FM; TEMECULA, CA; Owner: PENFOLD COMMUNICATIONS, INC.)
KXFG (92.9 FM; SUN CITY, CA; Owner: INFINITY RADIO OPERATIONS INC.)
KGBB (103.3 FM; TEMECULA, CA; Owner: CLEAR CHANNEL BROADCASTING LICENSES, INC.)
KMYT (94.5 FM; TEMECULA, CA; Owner: CLEAR CHANNEL BROADCASTING LICENSES, INC.)
KWVE (107.9 FM; SAN CLEMENTE, CA; Owner: CALVARY CHAPEL OF COSTA MESA)
KLRD (90.1 FM; YUCAIPA, CA; Owner: EDUCATIONAL MEDIA FOUNDATION)
K252BF (98.3 FM; TEMECULA, CA; Owner: ENTRAVISION HOLDINGS, LLC)
KUOR-FM (89.1 FM; REDLANDS, CA; Owner: UNIVERSITY OF REDLANDS)
KWRP (96.1 FM; SAN JACINTO, CA; Owner: MAGIC BROADCASTING, INC.)
KXRS (105.7 FM; HEMET, CA; Owner: LAZER BROADCASTING CORPORATION)
KPLM-FM2 (106.1 FM; SAN JACINTO, CA; Owner: RM BROADCASTING L.L.C.)
KATY-FM (101.3 FM; IDYLLWILD, CA; Owner: ALL PRO BROADCASTING, INC.)
KOLA (99.9 FM; SAN BERNARDINO, CA; Owner: INLAND EMPIRE BROADCASTING CORP.)
KVCR (91.9 FM; SAN BERNARDINO, CA; Owner: SAN BERNARDINO COMMUNITY COLLEGE DISTRICT)
KUCR (88.3 FM; RIVERSIDE, CA; Owner: THE REGENTS OF THE UNIV. OF CA)
K201AR (88.1 FM; BANNING, CA; Owner: KSGN, INC.)
K232CX (94.3 FM; DESERT HOT SPRINGS, CA; Owner: MCC RADIO, LLC)
KCXX (103.9 FM; LAKE ARROWHEAD, CA; Owner: ALL-PRO BROADCASTING, INC.)
KLVJ (100.1 FM; JULIAN, CA; Owner: EDUCATIONAL MEDIA FOUNDATION)
K295AI (106.9 FM; MUSCOY, CA; Owner: ASSOCIATION FOR COMMUNITY EDUCATION, INC.)
TV broadcast stations around Murrieta:
K47FL (Channel 47; FALLBROOK, CA; Owner: CHANNEL 51 OF SAN DIEGO, INC.)
KDIG-LP (Channel 67; ENCINITAS, CA; Owner: STEPHEN M. CILURZO tr/as BRIMARC BROADCASTING)
National Bridge Inventory (NBI) Statistics 43 Number of bridges495ft / 151m Total length1,346,471 Total average daily traffic84,645 Total average daily truck traffic
New bridges - historical statistics
1 1960-1969 22 1970-1979 2 1980-1989 10 1990-1999 4 2000-2009 4 2010-2019
See full National Bridge Inventory statistics for Murrieta, CA
Home Mortgage Disclosure Act Aggregated Statistics For Year 2009(Based on 3 full and 6 partial tracts) A) FHA, FSA/RHS & VA B) Conventional C) Refinancings D) Home Improvement Loans F) Non-occupant Loans on G) Loans On Manufactured Number Average Value Number Average Value Number Average Value Number Average Value Number Average Value Number Average Value
LOANS ORIGINATED 670 $227,805 411 $178,858 718 $221,485 33 $104,210 186 $159,385 18 $154,515 APPLICATIONS APPROVED, NOT ACCEPTED 46 $231,989 55 $178,580 94 $251,649 5 $70,644 27 $164,038 2 $88,855 APPLICATIONS DENIED 127 $232,491 113 $171,627 323 $244,429 18 $96,533 84 $168,234 9 $107,222 APPLICATIONS WITHDRAWN 97 $236,008 61 $182,379 217 $231,609 9 $145,937 38 $159,887 6 $169,517 FILES CLOSED FOR INCOMPLETENESS 20 $209,711 19 $169,356 58 $225,814 3 $41,093 9 $155,268 1 $24,480
Aggregated Statistics For Year 2008(Based on 3 full and 6 partial tracts) A) FHA, FSA/RHS & VA B) Conventional C) Refinancings D) Home Improvement Loans F) Non-occupant Loans on G) Loans On Manufactured Number Average Value Number Average Value Number Average Value Number Average Value Number Average Value Number Average Value
LOANS ORIGINATED 537 $264,078 647 $224,091 378 $234,739 40 $108,986 197 $193,881 21 $177,696 APPLICATIONS APPROVED, NOT ACCEPTED 47 $251,774 133 $240,015 144 $273,050 14 $32,446 41 $217,289 13 $127,375 APPLICATIONS DENIED 143 $275,192 229 $249,380 525 $298,972 79 $107,241 101 $212,798 23 $195,755 APPLICATIONS WITHDRAWN 77 $267,361 141 $235,186 201 $282,234 17 $167,125 52 $216,349 8 $181,365 FILES CLOSED FOR INCOMPLETENESS 17 $247,993 32 $299,475 47 $311,391 4 $149,880 10 $237,879 4 $243,990
Aggregated Statistics For Year 2007(Based on 3 full and 6 partial tracts) A) FHA, FSA/RHS & VA B) Conventional C) Refinancings D) Home Improvement Loans F) Non-occupant Loans on G) Loans On Manufactured Number Average Value Number Average Value Number Average Value Number Average Value Number Average Value Number Average Value
LOANS ORIGINATED 50 $314,853 824 $278,063 1,604 $291,679 201 $163,130 199 $278,015 46 $203,294 APPLICATIONS APPROVED, NOT ACCEPTED 2 $345,525 297 $284,225 460 $302,485 57 $147,612 68 $259,251 13 $151,910 APPLICATIONS DENIED 6 $338,688 448 $340,268 1,526 $341,884 209 $183,348 130 $336,641 36 $197,500 APPLICATIONS WITHDRAWN 7 $270,533 237 $303,261 600 $325,208 45 $201,926 58 $301,632 14 $215,765 FILES CLOSED FOR INCOMPLETENESS 2 $175,020 66 $351,341 213 $362,472 15 $204,838 18 $395,092 2 $142,915
Aggregated Statistics For Year 2006(Based on 3 full and 6 partial tracts) A) FHA, FSA/RHS & VA B) Conventional C) Refinancings D) Home Improvement Loans E) Loans on Dwellings For 5+ Families F) Non-occupant Loans on G) Loans On Manufactured Number Average Value Number Average Value Number Average Value Number Average Value Number Average Value Number Average Value Number Average Value
LOANS ORIGINATED 14 $289,581 2,172 $265,243 2,780 $296,396 383 $159,131 1 $80,000,000 365 $270,423 54 $175,707 APPLICATIONS APPROVED, NOT ACCEPTED 1 $188,790 460 $271,239 606 $307,257 95 $188,627 0 $0 100 $285,632 14 $169,045 APPLICATIONS DENIED 3 $265,967 819 $281,603 1,747 $321,666 292 $159,213 0 $0 176 $298,068 39 $184,770 APPLICATIONS WITHDRAWN 4 $267,642 537 $300,494 1,177 $328,183 97 $178,806 0 $0 99 $289,401 8 $276,558 FILES CLOSED FOR INCOMPLETENESS 0 $0 127 $278,264 276 $320,690 11 $141,808 0 $0 24 $226,216 4 $159,732
Aggregated Statistics For Year 2005(Based on 3 full and 6 partial tracts) A) FHA, FSA/RHS & VA B) Conventional C) Refinancings D) Home Improvement Loans F) Non-occupant Loans on G) Loans On Manufactured Number Average Value Number Average Value Number Average Value Number Average Value Number Average Value Number Average Value
LOANS ORIGINATED 10 $256,929 3,842 $262,823 3,116 $293,458 397 $173,585 520 $260,015 80 $196,163 APPLICATIONS APPROVED, NOT ACCEPTED 2 $281,755 810 $266,531 549 $296,675 70 $147,463 106 $260,310 19 $183,298 APPLICATIONS DENIED 3 $173,067 1,093 $271,340 1,305 $310,285 276 $123,844 141 $282,045 55 $178,287 APPLICATIONS WITHDRAWN 5 $240,238 898 $282,488 1,091 $303,440 146 $179,504 129 $262,348 27 $208,640 FILES CLOSED FOR INCOMPLETENESS 0 $0 223 $271,952 378 $325,897 26 $118,297 34 $270,457 5 $227,892
Aggregated Statistics For Year 2004(Based on 3 full and 6 partial tracts) A) FHA, FSA/RHS & VA B) Conventional C) Refinancings D) Home Improvement Loans E) Loans on Dwellings For 5+ Families F) Non-occupant Loans on G) Loans On Manufactured Number Average Value Number Average Value Number Average Value Number Average Value Number Average Value Number Average Value Number Average Value
LOANS ORIGINATED 15 $193,930 2,887 $253,203 3,741 $258,812 412 $153,778 1 $18,338,220 453 $232,505 91 $167,787 APPLICATIONS APPROVED, NOT ACCEPTED 2 $184,225 617 $253,377 618 $259,453 61 $136,299 0 $0 68 $246,707 26 $176,010 APPLICATIONS DENIED 5 $210,028 681 $260,810 1,184 $260,684 252 $112,634 0 $0 106 $247,830 47 $154,070 APPLICATIONS WITHDRAWN 8 $199,262 671 $269,597 1,189 $259,924 111 $137,251 0 $0 78 $255,636 30 $174,385 FILES CLOSED FOR INCOMPLETENESS 1 $192,150 150 $271,175 263 $270,775 22 $80,582 0 $0 22 $224,661 1 $335,130
Aggregated Statistics For Year 2003(Based on 3 full and 6 partial tracts) A) FHA, FSA/RHS & VA B) Conventional C) Refinancings D) Home Improvement Loans E) Loans on Dwellings For 5+ Families F) Non-occupant Loans on Number Average Value Number Average Value Number Average Value Number Average Value Number Average Value Number Average Value
LOANS ORIGINATED 77 $212,482 2,795 $201,853 5,298 $196,741 190 $65,368 1 $28,166,000 480 $177,754 APPLICATIONS APPROVED, NOT ACCEPTED 18 $183,152 543 $199,548 815 $194,915 45 $58,469 0 $0 88 $175,013 APPLICATIONS DENIED 17 $197,202 430 $205,085 1,228 $201,852 170 $59,322 0 $0 90 $196,006 APPLICATIONS WITHDRAWN 21 $187,185 500 $220,632 1,202 $203,437 49 $104,353 0 $0 66 $178,334 FILES CLOSED FOR INCOMPLETENESS 3 $195,290 103 $195,497 222 $205,785 22 $49,873 0 $0 13 $179,502
Aggregated Statistics For Year 1999(Based on 3 partial tracts) A) FHA, FSA/RHS & VA B) Conventional C) Refinancings D) Home Improvement Loans E) Loans on Dwellings For 5+ Families F) Non-occupant Loans on Number Average Value Number Average Value Number Average Value Number Average Value Number Average Value Number Average Value
LOANS ORIGINATED 194 $143,747 419 $138,025 458 $131,398 107 $31,100 3 $114,517 49 $120,261 APPLICATIONS APPROVED, NOT ACCEPTED 9 $150,706 51 $149,405 103 $122,266 55 $31,720 1 $121,640 7 $122,901 APPLICATIONS DENIED 22 $155,190 98 $153,616 254 $117,958 82 $27,715 1 $110,960 11 $147,250 APPLICATIONS WITHDRAWN 31 $144,656 99 $138,808 165 $121,808 9 $31,574 1 $96,230 8 $105,415 FILES CLOSED FOR INCOMPLETENESS 4 $178,968 14 $139,402 46 $132,229 2 $47,690 0 $0 1 $148,360
Detailed mortgage data for all 9 tracts in Murrieta, CA
Private Mortgage Insurance Companies Aggregated Statistics For Year 2009(Based on 3 full and 6 partial tracts) A) Conventional B) Refinancings C) Non-occupant Loans on D) Loans On Manufactured Number Average Value Number Average Value Number Average Value Number Average Value
LOANS ORIGINATED 52 $217,530 5 $224,796 5 $181,278 0 $0 APPLICATIONS APPROVED, NOT ACCEPTED 31 $211,331 4 $271,370 2 $112,405 1 $159,360 APPLICATIONS DENIED 11 $204,489 2 $264,790 0 $0 0 $0 APPLICATIONS WITHDRAWN 3 $270,427 2 $189,500 1 $116,950 0 $0 FILES CLOSED FOR INCOMPLETENESS 7 $262,377 1 $251,970 0 $0 0 $0
Aggregated Statistics For Year 2008(Based on 3 full and 6 partial tracts) A) Conventional B) Refinancings C) Non-occupant Loans on Number Average Value Number Average Value Number Average Value
LOANS ORIGINATED 218 $278,386 27 $325,956 10 $235,167 APPLICATIONS APPROVED, NOT ACCEPTED 97 $311,888 43 $378,439 9 $294,227 APPLICATIONS DENIED 35 $238,990 4 $352,012 5 $236,678 APPLICATIONS WITHDRAWN 12 $304,698 2 $426,750 0 $0 FILES CLOSED FOR INCOMPLETENESS 5 $341,306 1 $442,880 0 $0
Aggregated Statistics For Year 2007(Based on 3 full and 6 partial tracts) A) Conventional B) Refinancings C) Non-occupant Loans on D) Loans On Manufactured Number Average Value Number Average Value Number Average Value Number Average Value
LOANS ORIGINATED 111 $350,489 78 $392,415 11 $322,427 2 $203,510 APPLICATIONS APPROVED, NOT ACCEPTED 15 $360,083 40 $414,925 1 $303,250 1 $275,610 APPLICATIONS DENIED 5 $305,152 3 $507,627 1 $442,000 0 $0 APPLICATIONS WITHDRAWN 8 $377,662 9 $456,567 2 $492,865 0 $0 FILES CLOSED FOR INCOMPLETENESS 0 $0 0 $0 0 $0 0 $0
Aggregated Statistics For Year 2006(Based on 3 full and 6 partial tracts) A) Conventional B) Refinancings C) Non-occupant Loans on D) Loans On Manufactured Number Average Value Number Average Value Number Average Value Number Average Value
LOANS ORIGINATED 42 $360,905 61 $398,230 7 $356,523 2 $254,480 APPLICATIONS APPROVED, NOT ACCEPTED 16 $384,141 21 $389,142 0 $0 0 $0 APPLICATIONS DENIED 1 $674,700 4 $524,107 0 $0 0 $0 APPLICATIONS WITHDRAWN 6 $454,317 4 $445,558 0 $0 0 $0 FILES CLOSED FOR INCOMPLETENESS 1 $516,380 1 $322,330 0 $0 0 $0
Aggregated Statistics For Year 2005(Based on 3 full and 6 partial tracts) A) Conventional B) Refinancings C) Non-occupant Loans on D) Loans On Manufactured Number Average Value Number Average Value Number Average Value Number Average Value
LOANS ORIGINATED 86 $324,992 48 $382,372 21 $281,902 2 $187,485 APPLICATIONS APPROVED, NOT ACCEPTED 15 $337,561 14 $332,661 2 $387,460 0 $0 APPLICATIONS DENIED 3 $497,140 1 $502,630 0 $0 1 $277,980 APPLICATIONS WITHDRAWN 8 $380,319 5 $350,038 3 $231,030 0 $0 FILES CLOSED FOR INCOMPLETENESS 0 $0 0 $0 0 $0 0 $0
Aggregated Statistics For Year 2004(Based on 3 full and 6 partial tracts) A) Conventional B) Refinancings C) Non-occupant Loans on D) Loans On Manufactured Number Average Value Number Average Value Number Average Value Number Average Value
LOANS ORIGINATED 101 $302,884 66 $288,592 21 $287,837 3 $253,977 APPLICATIONS APPROVED, NOT ACCEPTED 62 $290,525 42 $268,071 5 $290,538 1 $252,810 APPLICATIONS DENIED 3 $311,973 5 $294,420 0 $0 0 $0 APPLICATIONS WITHDRAWN 11 $302,675 6 $299,048 1 $388,680 0 $0 FILES CLOSED FOR INCOMPLETENESS 2 $305,290 1 $300,300 0 $0 0 $0
Aggregated Statistics For Year 2003(Based on 3 full and 6 partial tracts) A) Conventional B) Refinancings C) Non-occupant Loans on Number Average Value Number Average Value Number Average Value
LOANS ORIGINATED 399 $251,834 188 $237,247 37 $221,960 APPLICATIONS APPROVED, NOT ACCEPTED 77 $256,445 74 $226,076 7 $228,024 APPLICATIONS DENIED 11 $262,994 4 $217,080 3 $208,660 APPLICATIONS WITHDRAWN 19 $243,132 15 $255,151 4 $266,920 FILES CLOSED FOR INCOMPLETENESS 1 $264,380 0 $0 0 $0
Aggregated Statistics For Year 1999(Based on 3 partial tracts) A) Conventional B) Refinancings C) Non-occupant Loans on Number Average Value Number Average Value Number Average Value
LOANS ORIGINATED 119 $172,802 65 $155,832 4 $122,155 APPLICATIONS APPROVED, NOT ACCEPTED 11 $154,405 19 $160,558 1 $125,930 APPLICATIONS DENIED 6 $175,008 5 $177,768 1 $101,970 APPLICATIONS WITHDRAWN 3 $137,610 3 $141,800 0 $0 FILES CLOSED FOR INCOMPLETENESS 2 $204,110 1 $123,840 0 $0
Fire-safe hotels and motels in Murrieta, California:
Residence Inn by Marriott, 25407 Madison Ave, Murrieta, California 92562 Phone: (951) 698-6300, Fax: (951) 698-6330
Hampton Inn & Suites Murrieta, 25140 Hancock Ave, Murrieta, California 92562 Phone: (951) 691-8820
Courtyard by Marriott Temecula Murrieta, 25419 Madison Ave, Murrieta, California 92562 Phone: (888) 236-2476
All 3 fire-safe hotels and motels in Murrieta, California
Most common first names in Murrieta, CA among deceased individuals Name Count Lived (average)
Robert 126 75.1 years William 117 76.8 years John 102 77.4 years James 88 76.9 years Mary 87 80.3 years Richard 60 74.6 years Helen 60 83.1 years Donald 55 74.6 years Charles 55 78.7 years George 54 76.3 years
Most common last names in Murrieta, CA among deceased individuals Last name Count Lived (average)
Smith 46 78.3 years Miller 34 80.2 years Johnson 29 77.9 years Brown 21 79.0 years Williams 19 72.3 years Anderson 18 81.1 years Taylor 15 76.4 years Jones 14 76.4 years Martin 14 77.2 years Nelson 13 81.0 years
Murrieta compared to California state average:
Unemployed percentage significantly below state average. Black race population percentage above state average. Hispanic race population percentage above state average. Length of stay since moving in significantly below state average. Number of rooms per house above state average. House age significantly below state average. Number of college students above state average. Murrieta, CA compared to other similar cities:
#6 on the list of "Top 101 cities with the largest differences between daily high and daily low temperatures (population 50,000+)"
#9 on the list of "Top 101 cities with the lowest number of police officers per 1000 residents (population 50,000+)"
#16 on the list of "Top 101 cities with the lowest number of arson incidents per 100,000 residents (population 50,000+)"
#17 on the list of "Top 101 cities with largest percentage of females in occupations: food preparation and serving related occupations (population 50,000+)"
#22 on the list of "Top 101 cities with largest percentage of males in occupations: personal care and service occupations (population 50,000+)"
#23 on the list of "Top 100 fastest growing cities from 2000 to 2014 (pop. 50,000+)"
#28 on the list of "Top 101 cities with the highest percentage of family households, population 100,000+"
#28 on the list of "Top 100 cities with newest houses (pop. 50,000+)"
#38 on the list of "Top 101 cities with largest percentage of males in industries: other services, except public administration (population 50,000+)"
#39 on the list of "Top 101 cities with the highest daily high temperatures (population 50,000+)"
#41 on the list of "Top 101 cities with largest percentage of males in industries: arts, entertainment, and recreation (population 50,000+)"
#41 on the list of "Top 101 cities with the smallest percentage of high school students in private schools (3,000+ students)"
#43 on the list of "Top 100 cities with highest median household income and median resident age less than 35 (pop. 50,000+)"
#52 on the list of "Top 101 cities with the highest percentage of workers working at home, population 50,000+"
#55 on the list of "Top 101 cities with largest percentage of males in occupations: management occupations (population 50,000+)"
#61 on the list of "Top 100 cities with biggest houses (pop. 50,000+)"
#63 on the list of "Top 101 cities with the least people below 50% of the poverty level (population 50,000+)"
#65 on the list of "Top 101 cities with largest percentage of males in occupations: installation, maintenance, and repair occupations (population 50,000+)"
#65 on the list of "Top 101 cities with the lowest number of assaults per 100,000 residents (population 50,000+)"
#68 on the list of "Top 101 cities with largest percentage of females in occupations: sales and related occupations (population 50,000+)"
#3 on the list of "Top 101 counties with the highest lead air pollution readings in 2012 (µg/m3 )"
#4 on the list of "Top 101 counties with the highest ground withdrawal of fresh water for public supply"
#11 on the list of "Top 101 counties with the most Catholic adherents"
#11 on the list of "Top 101 counties with the highest total withdrawal of fresh water for public supply"
#12 on the list of "Top 101 counties with the highest carbon monoxide air pollution readings in 2012 (ppm)"
Top Patent Applicants
Stephen Boyd (30)
Alexander J. Asconeguy (22)
Matthew J. Gillick (17)
Darrin J. Kent (15)
John F. Boylan (13)
Ronald Warren Mcguire (12)
Richard Frentzel (11)
Bryan D. Glenn (10)
Mark C. Johnson (10)
Steve Rogers (10)
Total of 707 patent applications in 2008-2024.

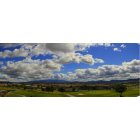
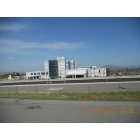

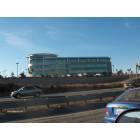
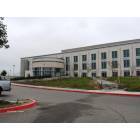
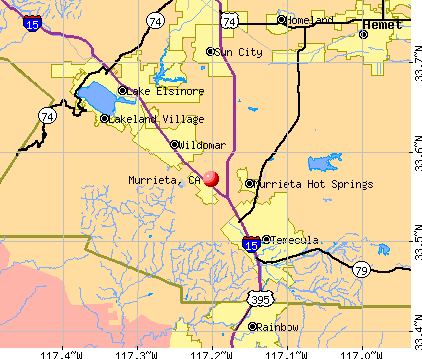


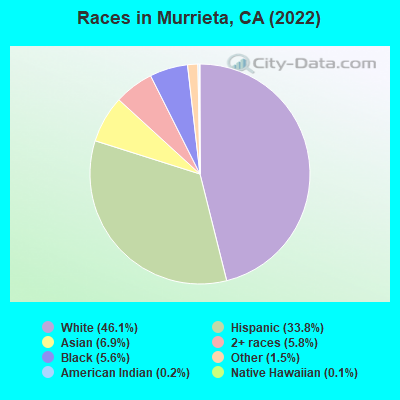
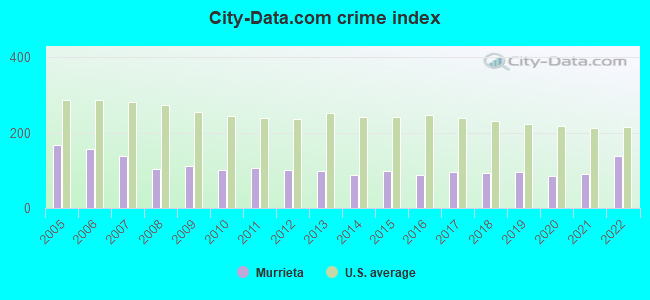
 Recent articles from our blog. Our writers, many of them Ph.D. graduates or candidates, create easy-to-read articles on a wide variety of topics.

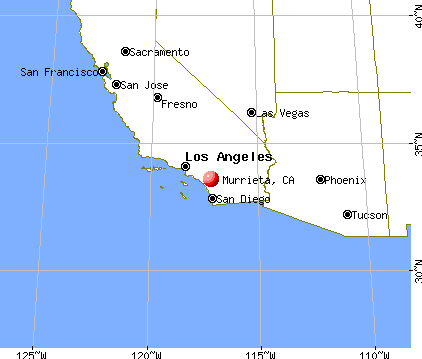
 (6.5 miles
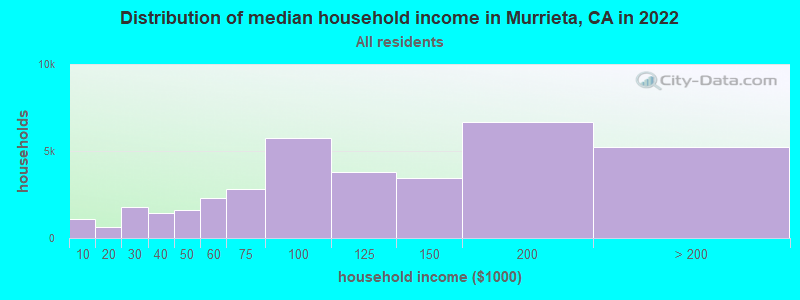
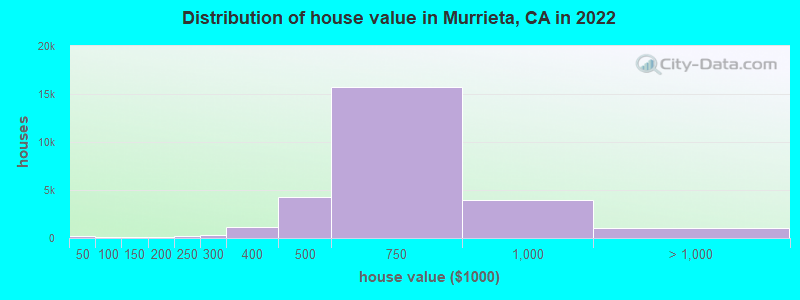
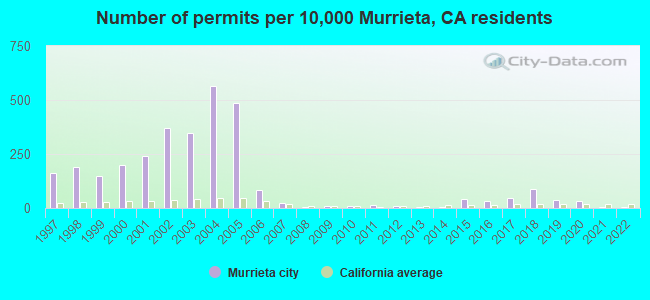
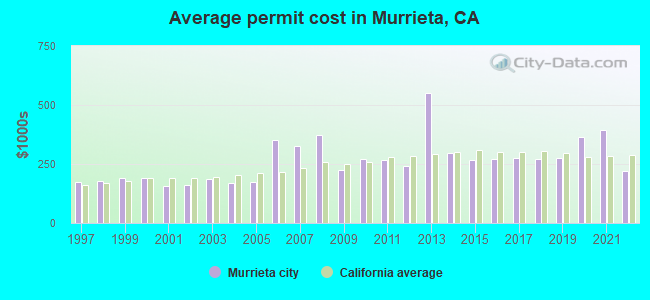
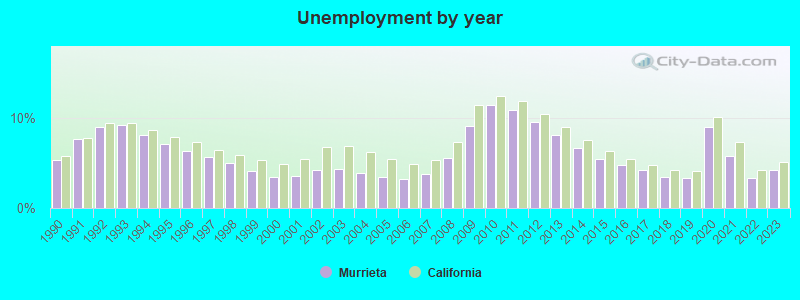
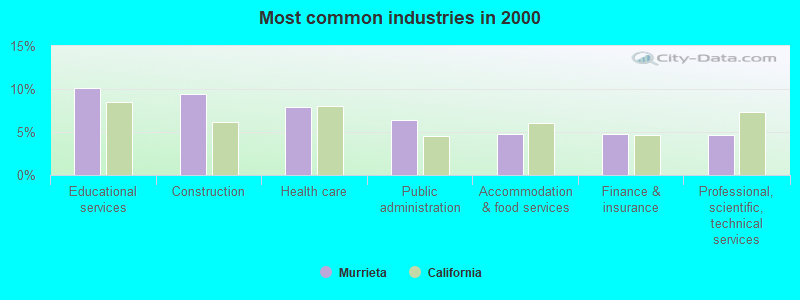
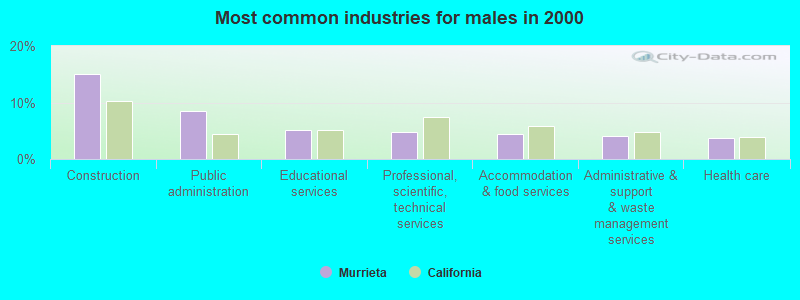
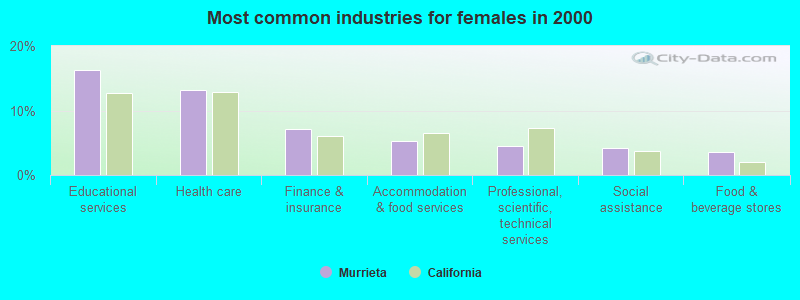
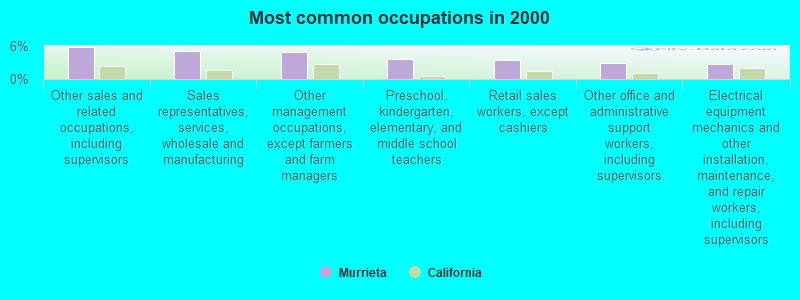
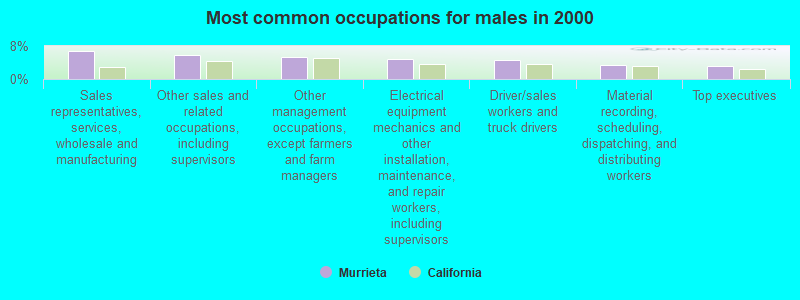
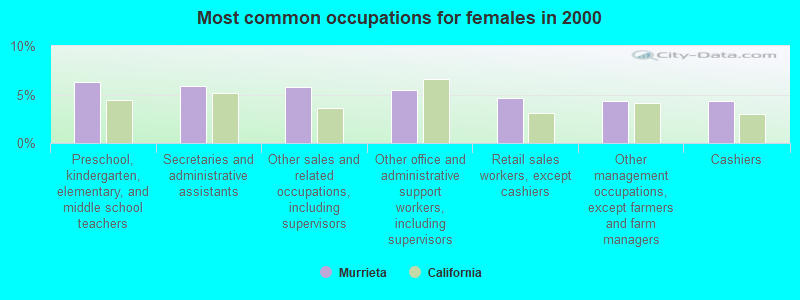
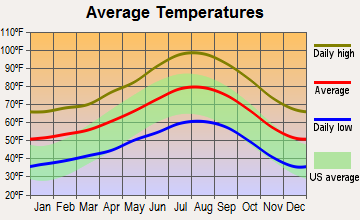
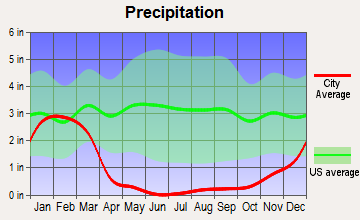
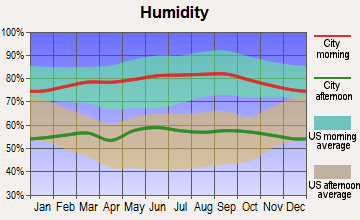
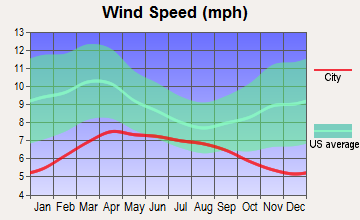
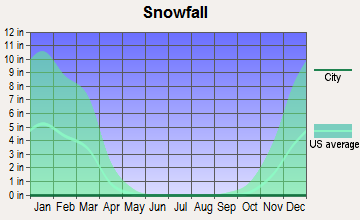
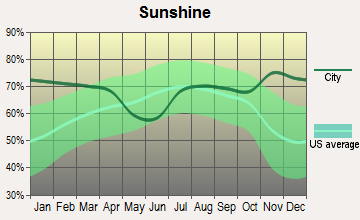
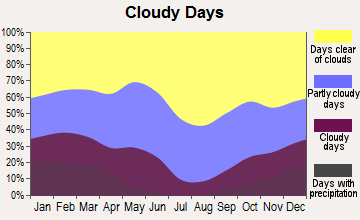
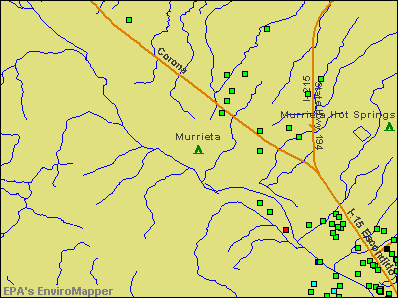

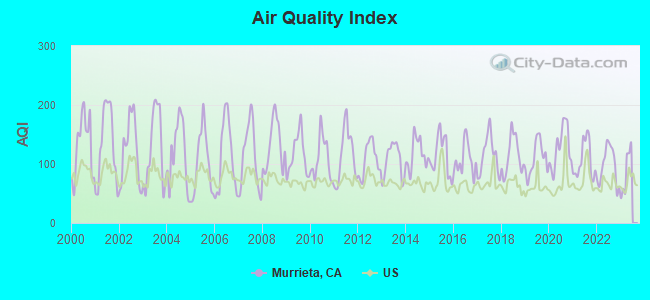
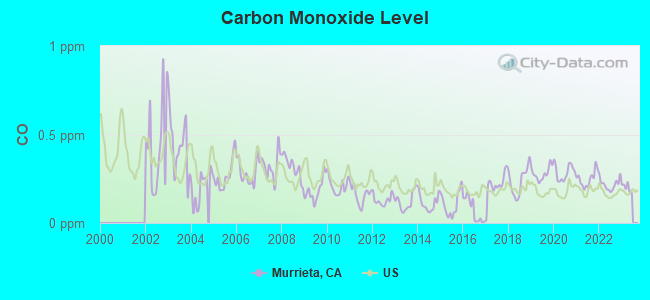
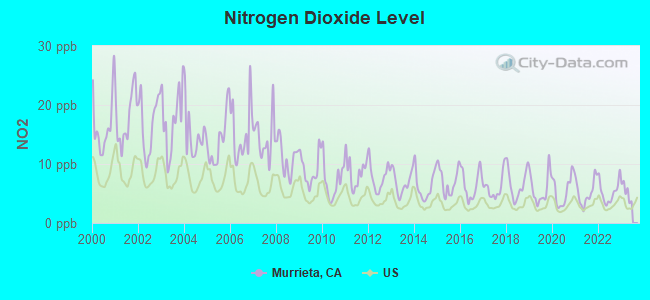
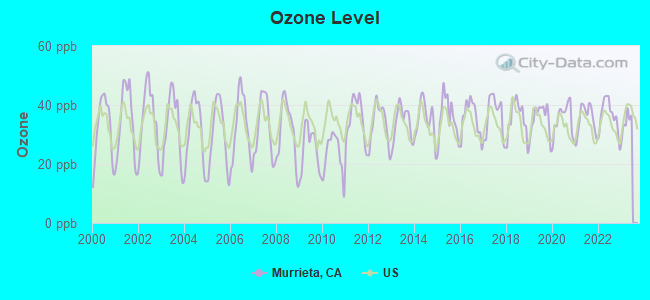
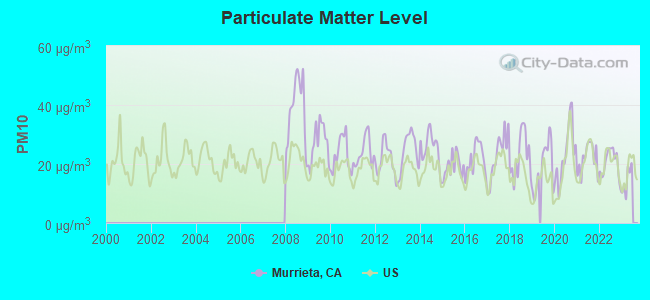
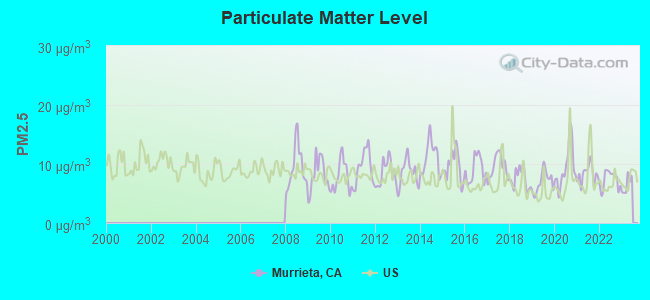
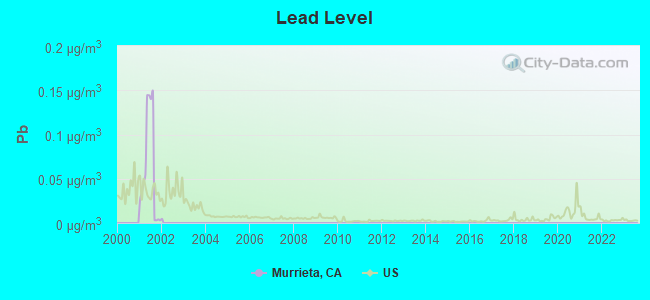

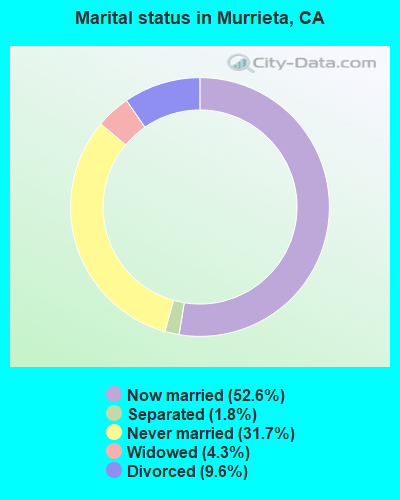
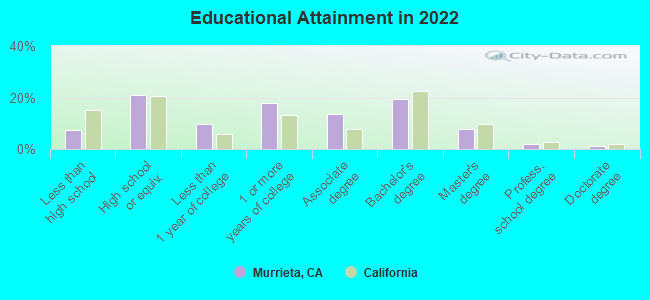
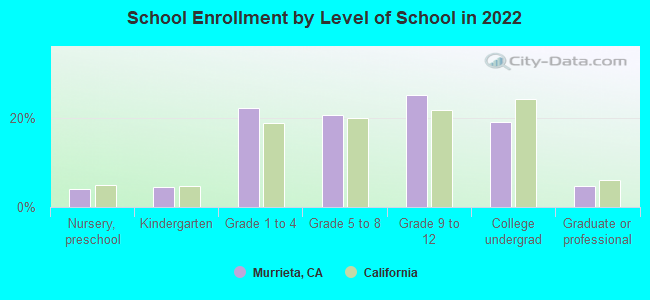
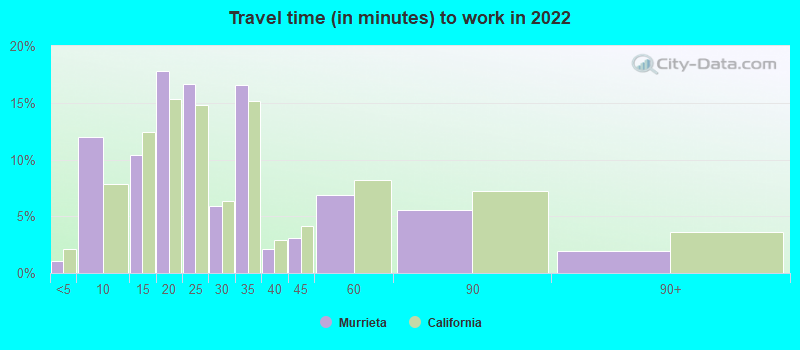
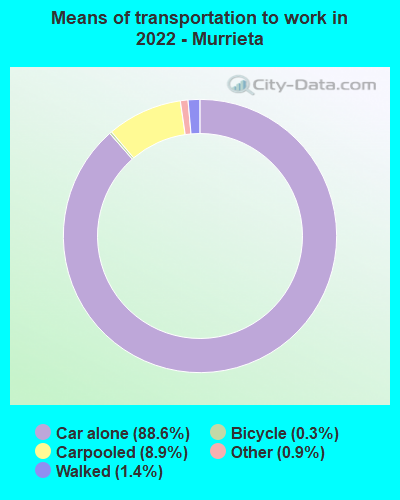


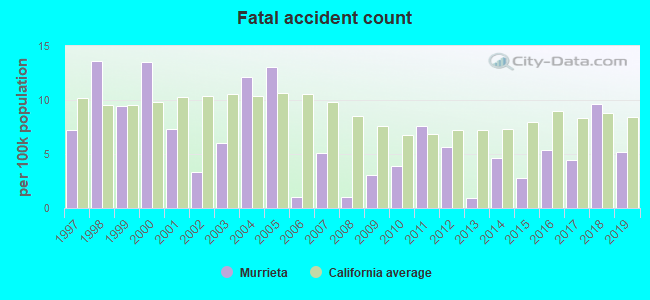
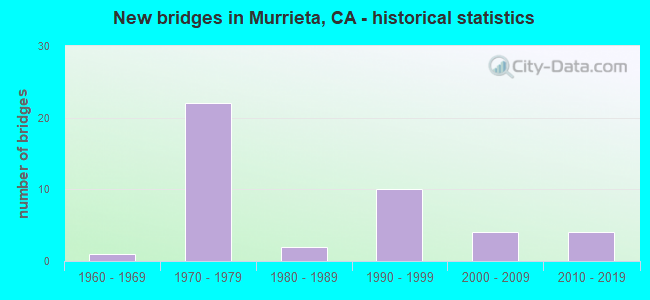
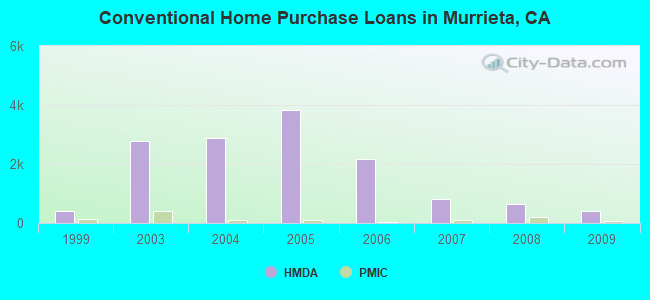
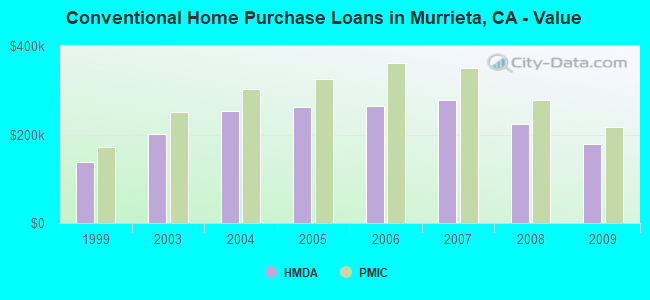
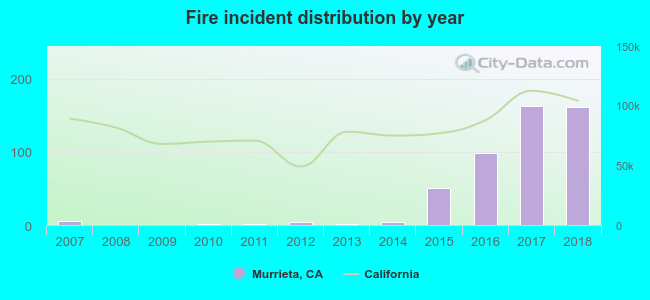 According to the data from the years 2007 - 2018 the average number of fires per year is 41. The highest number of reported fire incidents - 163 took place in 2017, and the least - 0 in 2008. The data has a rising trend.
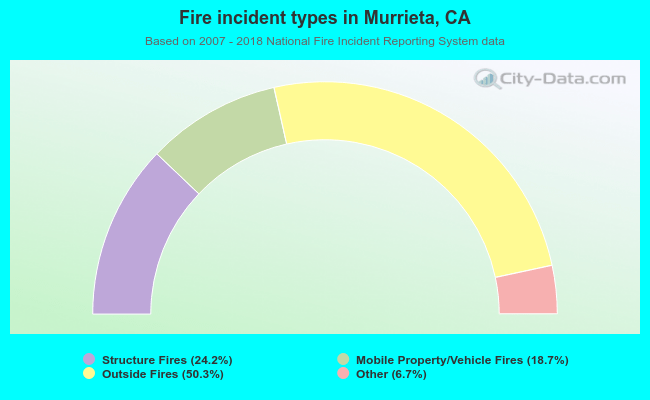 When looking into fire subcategories, the most incidents belonged to: Outside Fires (50.3%), and Structure Fires (24.2%).