North Chicago, Illinois Submit your own pictures of this city and show them to the world
OSM Map
General Map
Google Map
MSN Map
OSM Map
General Map
Google Map
MSN Map
OSM Map
General Map
Google Map
MSN Map
OSM Map
General Map
Google Map
MSN Map
Please wait while loading the map...
Population in 2022: 30,490 (100% urban, 0% rural). Population change since 2000: -15.1%Males: 18,407 Females: 12,083
March 2022 cost of living index in North Chicago: 96.1 (near average, U.S. average is 100) Percentage of residents living in poverty in 2022: 21.9%for White Non-Hispanic residents , 36.9% for Black residents , 14.0% for Hispanic or Latino residents , 2.3% for American Indian residents , 11.1% for other race residents , 14.9% for two or more races residents )
Profiles of local businesses
Business Search - 14 Million verified businesses
Data:
Median household income ($)
Median household income (% change since 2000)
Household income diversity
Ratio of average income to average house value (%)
Ratio of average income to average rent
Median household income ($) - White
Median household income ($) - Black or African American
Median household income ($) - Asian
Median household income ($) - Hispanic or Latino
Median household income ($) - American Indian and Alaska Native
Median household income ($) - Multirace
Median household income ($) - Other Race
Median household income for houses/condos with a mortgage ($)
Median household income for apartments without a mortgage ($)
Races - White alone (%)
Races - White alone (% change since 2000)
Races - Black alone (%)
Races - Black alone (% change since 2000)
Races - American Indian alone (%)
Races - American Indian alone (% change since 2000)
Races - Asian alone (%)
Races - Asian alone (% change since 2000)
Races - Hispanic (%)
Races - Hispanic (% change since 2000)
Races - Native Hawaiian and Other Pacific Islander alone (%)
Races - Native Hawaiian and Other Pacific Islander alone (% change since 2000)
Races - Two or more races (%)
Races - Two or more races (% change since 2000)
Races - Other race alone (%)
Races - Other race alone (% change since 2000)
Racial diversity
Unemployment (%)
Unemployment (% change since 2000)
Unemployment (%) - White
Unemployment (%) - Black or African American
Unemployment (%) - Asian
Unemployment (%) - Hispanic or Latino
Unemployment (%) - American Indian and Alaska Native
Unemployment (%) - Multirace
Unemployment (%) - Other Race
Population density (people per square mile)
Population - Males (%)
Population - Females (%)
Population - Males (%) - White
Population - Males (%) - Black or African American
Population - Males (%) - Asian
Population - Males (%) - Hispanic or Latino
Population - Males (%) - American Indian and Alaska Native
Population - Males (%) - Multirace
Population - Males (%) - Other Race
Population - Females (%) - White
Population - Females (%) - Black or African American
Population - Females (%) - Asian
Population - Females (%) - Hispanic or Latino
Population - Females (%) - American Indian and Alaska Native
Population - Females (%) - Multirace
Population - Females (%) - Other Race
Coronavirus confirmed cases (Apr 24, 2024)
Deaths caused by coronavirus (Apr 24, 2024)
Coronavirus confirmed cases (per 100k population) (Apr 24, 2024)
Deaths caused by coronavirus (per 100k population) (Apr 24, 2024)
Daily increase in number of cases (Apr 24, 2024)
Weekly increase in number of cases (Apr 24, 2024)
Cases doubled (in days) (Apr 24, 2024)
Hospitalized patients (Apr 18, 2022)
Negative test results (Apr 18, 2022)
Total test results (Apr 18, 2022)
COVID Vaccine doses distributed (per 100k population) (Sep 19, 2023)
COVID Vaccine doses administered (per 100k population) (Sep 19, 2023)
COVID Vaccine doses distributed (Sep 19, 2023)
COVID Vaccine doses administered (Sep 19, 2023)
Likely homosexual households (%)
Likely homosexual households (% change since 2000)
Likely homosexual households - Lesbian couples (%)
Likely homosexual households - Lesbian couples (% change since 2000)
Likely homosexual households - Gay men (%)
Likely homosexual households - Gay men (% change since 2000)
Cost of living index
Median gross rent ($)
Median contract rent ($)
Median monthly housing costs ($)
Median house or condo value ($)
Median house or condo value ($ change since 2000)
Mean house or condo value by units in structure - 1, detached ($)
Mean house or condo value by units in structure - 1, attached ($)
Mean house or condo value by units in structure - 2 ($)
Mean house or condo value by units in structure by units in structure - 3 or 4 ($)
Mean house or condo value by units in structure - 5 or more ($)
Mean house or condo value by units in structure - Boat, RV, van, etc. ($)
Mean house or condo value by units in structure - Mobile home ($)
Median house or condo value ($) - White
Median house or condo value ($) - Black or African American
Median house or condo value ($) - Asian
Median house or condo value ($) - Hispanic or Latino
Median house or condo value ($) - American Indian and Alaska Native
Median house or condo value ($) - Multirace
Median house or condo value ($) - Other Race
Median resident age
Resident age diversity
Median resident age - Males
Median resident age - Females
Median resident age - White
Median resident age - Black or African American
Median resident age - Asian
Median resident age - Hispanic or Latino
Median resident age - American Indian and Alaska Native
Median resident age - Multirace
Median resident age - Other Race
Median resident age - Males - White
Median resident age - Males - Black or African American
Median resident age - Males - Asian
Median resident age - Males - Hispanic or Latino
Median resident age - Males - American Indian and Alaska Native
Median resident age - Males - Multirace
Median resident age - Males - Other Race
Median resident age - Females - White
Median resident age - Females - Black or African American
Median resident age - Females - Asian
Median resident age - Females - Hispanic or Latino
Median resident age - Females - American Indian and Alaska Native
Median resident age - Females - Multirace
Median resident age - Females - Other Race
Commute - mean travel time to work (minutes)
Travel time to work - Less than 5 minutes (%)
Travel time to work - Less than 5 minutes (% change since 2000)
Travel time to work - 5 to 9 minutes (%)
Travel time to work - 5 to 9 minutes (% change since 2000)
Travel time to work - 10 to 19 minutes (%)
Travel time to work - 10 to 19 minutes (% change since 2000)
Travel time to work - 20 to 29 minutes (%)
Travel time to work - 20 to 29 minutes (% change since 2000)
Travel time to work - 30 to 39 minutes (%)
Travel time to work - 30 to 39 minutes (% change since 2000)
Travel time to work - 40 to 59 minutes (%)
Travel time to work - 40 to 59 minutes (% change since 2000)
Travel time to work - 60 to 89 minutes (%)
Travel time to work - 60 to 89 minutes (% change since 2000)
Travel time to work - 90 or more minutes (%)
Travel time to work - 90 or more minutes (% change since 2000)
Marital status - Never married (%)
Marital status - Now married (%)
Marital status - Separated (%)
Marital status - Widowed (%)
Marital status - Divorced (%)
Median family income ($)
Median family income (% change since 2000)
Median non-family income ($)
Median non-family income (% change since 2000)
Median per capita income ($)
Median per capita income (% change since 2000)
Median family income ($) - White
Median family income ($) - Black or African American
Median family income ($) - Asian
Median family income ($) - Hispanic or Latino
Median family income ($) - American Indian and Alaska Native
Median family income ($) - Multirace
Median family income ($) - Other Race
Median year house/condo built
Median year apartment built
Year house built - Built 2005 or later (%)
Year house built - Built 2000 to 2004 (%)
Year house built - Built 1990 to 1999 (%)
Year house built - Built 1980 to 1989 (%)
Year house built - Built 1970 to 1979 (%)
Year house built - Built 1960 to 1969 (%)
Year house built - Built 1950 to 1959 (%)
Year house built - Built 1940 to 1949 (%)
Year house built - Built 1939 or earlier (%)
Average household size
Household density (households per square mile)
Average household size - White
Average household size - Black or African American
Average household size - Asian
Average household size - Hispanic or Latino
Average household size - American Indian and Alaska Native
Average household size - Multirace
Average household size - Other Race
Occupied housing units (%)
Vacant housing units (%)
Owner occupied housing units (%)
Renter occupied housing units (%)
Vacancy status - For rent (%)
Vacancy status - For sale only (%)
Vacancy status - Rented or sold, not occupied (%)
Vacancy status - For seasonal, recreational, or occasional use (%)
Vacancy status - For migrant workers (%)
Vacancy status - Other vacant (%)
Residents with income below the poverty level (%)
Residents with income below 50% of the poverty level (%)
Children below poverty level (%)
Poor families by family type - Married-couple family (%)
Poor families by family type - Male, no wife present (%)
Poor families by family type - Female, no husband present (%)
Poverty status for native-born residents (%)
Poverty status for foreign-born residents (%)
Poverty among high school graduates not in families (%)
Poverty among people who did not graduate high school not in families (%)
Residents with income below the poverty level (%) - White
Residents with income below the poverty level (%) - Black or African American
Residents with income below the poverty level (%) - Asian
Residents with income below the poverty level (%) - Hispanic or Latino
Residents with income below the poverty level (%) - American Indian and Alaska Native
Residents with income below the poverty level (%) - Multirace
Residents with income below the poverty level (%) - Other Race
Air pollution - Air Quality Index (AQI)
Air pollution - CO
Air pollution - NO2
Air pollution - SO2
Air pollution - Ozone
Air pollution - PM10
Air pollution - PM25
Air pollution - Pb
Crime - Murders per 100,000 population
Crime - Rapes per 100,000 population
Crime - Robberies per 100,000 population
Crime - Assaults per 100,000 population
Crime - Burglaries per 100,000 population
Crime - Thefts per 100,000 population
Crime - Auto thefts per 100,000 population
Crime - Arson per 100,000 population
Crime - City-data.com crime index
Crime - Violent crime index
Crime - Property crime index
Crime - Murders per 100,000 population (5 year average)
Crime - Rapes per 100,000 population (5 year average)
Crime - Robberies per 100,000 population (5 year average)
Crime - Assaults per 100,000 population (5 year average)
Crime - Burglaries per 100,000 population (5 year average)
Crime - Thefts per 100,000 population (5 year average)
Crime - Auto thefts per 100,000 population (5 year average)
Crime - Arson per 100,000 population (5 year average)
Crime - City-data.com crime index (5 year average)
Crime - Violent crime index (5 year average)
Crime - Property crime index (5 year average)
1996 Presidential Elections Results (%) - Democratic Party (Clinton)
1996 Presidential Elections Results (%) - Republican Party (Dole)
1996 Presidential Elections Results (%) - Other
2000 Presidential Elections Results (%) - Democratic Party (Gore)
2000 Presidential Elections Results (%) - Republican Party (Bush)
2000 Presidential Elections Results (%) - Other
2004 Presidential Elections Results (%) - Democratic Party (Kerry)
2004 Presidential Elections Results (%) - Republican Party (Bush)
2004 Presidential Elections Results (%) - Other
2008 Presidential Elections Results (%) - Democratic Party (Obama)
2008 Presidential Elections Results (%) - Republican Party (McCain)
2008 Presidential Elections Results (%) - Other
2012 Presidential Elections Results (%) - Democratic Party (Obama)
2012 Presidential Elections Results (%) - Republican Party (Romney)
2012 Presidential Elections Results (%) - Other
2016 Presidential Elections Results (%) - Democratic Party (Clinton)
2016 Presidential Elections Results (%) - Republican Party (Trump)
2016 Presidential Elections Results (%) - Other
2020 Presidential Elections Results (%) - Democratic Party (Biden)
2020 Presidential Elections Results (%) - Republican Party (Trump)
2020 Presidential Elections Results (%) - Other
Ancestries Reported - Arab (%)
Ancestries Reported - Czech (%)
Ancestries Reported - Danish (%)
Ancestries Reported - Dutch (%)
Ancestries Reported - English (%)
Ancestries Reported - French (%)
Ancestries Reported - French Canadian (%)
Ancestries Reported - German (%)
Ancestries Reported - Greek (%)
Ancestries Reported - Hungarian (%)
Ancestries Reported - Irish (%)
Ancestries Reported - Italian (%)
Ancestries Reported - Lithuanian (%)
Ancestries Reported - Norwegian (%)
Ancestries Reported - Polish (%)
Ancestries Reported - Portuguese (%)
Ancestries Reported - Russian (%)
Ancestries Reported - Scotch-Irish (%)
Ancestries Reported - Scottish (%)
Ancestries Reported - Slovak (%)
Ancestries Reported - Subsaharan African (%)
Ancestries Reported - Swedish (%)
Ancestries Reported - Swiss (%)
Ancestries Reported - Ukrainian (%)
Ancestries Reported - United States (%)
Ancestries Reported - Welsh (%)
Ancestries Reported - West Indian (%)
Ancestries Reported - Other (%)
Educational Attainment - No schooling completed (%)
Educational Attainment - Less than high school (%)
Educational Attainment - High school or equivalent (%)
Educational Attainment - Less than 1 year of college (%)
Educational Attainment - 1 or more years of college (%)
Educational Attainment - Associate degree (%)
Educational Attainment - Bachelor's degree (%)
Educational Attainment - Master's degree (%)
Educational Attainment - Professional school degree (%)
Educational Attainment - Doctorate degree (%)
School Enrollment - Nursery, preschool (%)
School Enrollment - Kindergarten (%)
School Enrollment - Grade 1 to 4 (%)
School Enrollment - Grade 5 to 8 (%)
School Enrollment - Grade 9 to 12 (%)
School Enrollment - College undergrad (%)
School Enrollment - Graduate or professional (%)
School Enrollment - Not enrolled in school (%)
School enrollment - Public schools (%)
School enrollment - Private schools (%)
School enrollment - Not enrolled (%)
Median number of rooms in houses and condos
Median number of rooms in apartments
Housing units lacking complete plumbing facilities (%)
Housing units lacking complete kitchen facilities (%)
Density of houses
Urban houses (%)
Rural houses (%)
Households with people 60 years and over (%)
Households with people 65 years and over (%)
Households with people 75 years and over (%)
Households with one or more nonrelatives (%)
Households with no nonrelatives (%)
Population in households (%)
Family households (%)
Nonfamily households (%)
Population in families (%)
Family households with own children (%)
Median number of bedrooms in owner occupied houses
Mean number of bedrooms in owner occupied houses
Median number of bedrooms in renter occupied houses
Mean number of bedrooms in renter occupied houses
Median number of vehichles in owner occupied houses
Mean number of vehichles in owner occupied houses
Median number of vehichles in renter occupied houses
Mean number of vehichles in renter occupied houses
Mortgage status - with mortgage (%)
Mortgage status - with second mortgage (%)
Mortgage status - with home equity loan (%)
Mortgage status - with both second mortgage and home equity loan (%)
Mortgage status - without a mortgage (%)
Average family size
Average family size - White
Average family size - Black or African American
Average family size - Asian
Average family size - Hispanic or Latino
Average family size - American Indian and Alaska Native
Average family size - Multirace
Average family size - Other Race
Geographical mobility - Same house 1 year ago (%)
Geographical mobility - Moved within same county (%)
Geographical mobility - Moved from different county within same state (%)
Geographical mobility - Moved from different state (%)
Geographical mobility - Moved from abroad (%)
Place of birth - Born in state of residence (%)
Place of birth - Born in other state (%)
Place of birth - Native, outside of US (%)
Place of birth - Foreign born (%)
Housing units in structures - 1, detached (%)
Housing units in structures - 1, attached (%)
Housing units in structures - 2 (%)
Housing units in structures - 3 or 4 (%)
Housing units in structures - 5 to 9 (%)
Housing units in structures - 10 to 19 (%)
Housing units in structures - 20 to 49 (%)
Housing units in structures - 50 or more (%)
Housing units in structures - Mobile home (%)
Housing units in structures - Boat, RV, van, etc. (%)
House/condo owner moved in on average (years ago)
Renter moved in on average (years ago)
Year householder moved into unit - Moved in 1999 to March 2000 (%)
Year householder moved into unit - Moved in 1995 to 1998 (%)
Year householder moved into unit - Moved in 1990 to 1994 (%)
Year householder moved into unit - Moved in 1980 to 1989 (%)
Year householder moved into unit - Moved in 1970 to 1979 (%)
Year householder moved into unit - Moved in 1969 or earlier (%)
Means of transportation to work - Drove car alone (%)
Means of transportation to work - Carpooled (%)
Means of transportation to work - Public transportation (%)
Means of transportation to work - Bus or trolley bus (%)
Means of transportation to work - Streetcar or trolley car (%)
Means of transportation to work - Subway or elevated (%)
Means of transportation to work - Railroad (%)
Means of transportation to work - Ferryboat (%)
Means of transportation to work - Taxicab (%)
Means of transportation to work - Motorcycle (%)
Means of transportation to work - Bicycle (%)
Means of transportation to work - Walked (%)
Means of transportation to work - Other means (%)
Working at home (%)
Industry diversity
Most Common Industries - Agriculture, forestry, fishing and hunting, and mining (%)
Most Common Industries - Agriculture, forestry, fishing and hunting (%)
Most Common Industries - Mining, quarrying, and oil and gas extraction (%)
Most Common Industries - Construction (%)
Most Common Industries - Manufacturing (%)
Most Common Industries - Wholesale trade (%)
Most Common Industries - Retail trade (%)
Most Common Industries - Transportation and warehousing, and utilities (%)
Most Common Industries - Transportation and warehousing (%)
Most Common Industries - Utilities (%)
Most Common Industries - Information (%)
Most Common Industries - Finance and insurance, and real estate and rental and leasing (%)
Most Common Industries - Finance and insurance (%)
Most Common Industries - Real estate and rental and leasing (%)
Most Common Industries - Professional, scientific, and management, and administrative and waste management services (%)
Most Common Industries - Professional, scientific, and technical services (%)
Most Common Industries - Management of companies and enterprises (%)
Most Common Industries - Administrative and support and waste management services (%)
Most Common Industries - Educational services, and health care and social assistance (%)
Most Common Industries - Educational services (%)
Most Common Industries - Health care and social assistance (%)
Most Common Industries - Arts, entertainment, and recreation, and accommodation and food services (%)
Most Common Industries - Arts, entertainment, and recreation (%)
Most Common Industries - Accommodation and food services (%)
Most Common Industries - Other services, except public administration (%)
Most Common Industries - Public administration (%)
Occupation diversity
Most Common Occupations - Management, business, science, and arts occupations (%)
Most Common Occupations - Management, business, and financial occupations (%)
Most Common Occupations - Management occupations (%)
Most Common Occupations - Business and financial operations occupations (%)
Most Common Occupations - Computer, engineering, and science occupations (%)
Most Common Occupations - Computer and mathematical occupations (%)
Most Common Occupations - Architecture and engineering occupations (%)
Most Common Occupations - Life, physical, and social science occupations (%)
Most Common Occupations - Education, legal, community service, arts, and media occupations (%)
Most Common Occupations - Community and social service occupations (%)
Most Common Occupations - Legal occupations (%)
Most Common Occupations - Education, training, and library occupations (%)
Most Common Occupations - Arts, design, entertainment, sports, and media occupations (%)
Most Common Occupations - Healthcare practitioners and technical occupations (%)
Most Common Occupations - Health diagnosing and treating practitioners and other technical occupations (%)
Most Common Occupations - Health technologists and technicians (%)
Most Common Occupations - Service occupations (%)
Most Common Occupations - Healthcare support occupations (%)
Most Common Occupations - Protective service occupations (%)
Most Common Occupations - Fire fighting and prevention, and other protective service workers including supervisors (%)
Most Common Occupations - Law enforcement workers including supervisors (%)
Most Common Occupations - Food preparation and serving related occupations (%)
Most Common Occupations - Building and grounds cleaning and maintenance occupations (%)
Most Common Occupations - Personal care and service occupations (%)
Most Common Occupations - Sales and office occupations (%)
Most Common Occupations - Sales and related occupations (%)
Most Common Occupations - Office and administrative support occupations (%)
Most Common Occupations - Natural resources, construction, and maintenance occupations (%)
Most Common Occupations - Farming, fishing, and forestry occupations (%)
Most Common Occupations - Construction and extraction occupations (%)
Most Common Occupations - Installation, maintenance, and repair occupations (%)
Most Common Occupations - Production, transportation, and material moving occupations (%)
Most Common Occupations - Production occupations (%)
Most Common Occupations - Transportation occupations (%)
Most Common Occupations - Material moving occupations (%)
People in Group quarters - Institutionalized population (%)
People in Group quarters - Correctional institutions (%)
People in Group quarters - Federal prisons and detention centers (%)
People in Group quarters - Halfway houses (%)
People in Group quarters - Local jails and other confinement facilities (including police lockups) (%)
People in Group quarters - Military disciplinary barracks (%)
People in Group quarters - State prisons (%)
People in Group quarters - Other types of correctional institutions (%)
People in Group quarters - Nursing homes (%)
People in Group quarters - Hospitals/wards, hospices, and schools for the handicapped (%)
People in Group quarters - Hospitals/wards and hospices for chronically ill (%)
People in Group quarters - Hospices or homes for chronically ill (%)
People in Group quarters - Military hospitals or wards for chronically ill (%)
People in Group quarters - Other hospitals or wards for chronically ill (%)
People in Group quarters - Hospitals or wards for drug/alcohol abuse (%)
People in Group quarters - Mental (Psychiatric) hospitals or wards (%)
People in Group quarters - Schools, hospitals, or wards for the mentally retarded (%)
People in Group quarters - Schools, hospitals, or wards for the physically handicapped (%)
People in Group quarters - Institutions for the deaf (%)
People in Group quarters - Institutions for the blind (%)
People in Group quarters - Orthopedic wards and institutions for the physically handicapped (%)
People in Group quarters - Wards in general hospitals for patients who have no usual home elsewhere (%)
People in Group quarters - Wards in military hospitals for patients who have no usual home elsewhere (%)
People in Group quarters - Juvenile institutions (%)
People in Group quarters - Long-term care (%)
People in Group quarters - Homes for abused, dependent, and neglected children (%)
People in Group quarters - Residential treatment centers for emotionally disturbed children (%)
People in Group quarters - Training schools for juvenile delinquents (%)
People in Group quarters - Short-term care, detention or diagnostic centers for delinquent children (%)
People in Group quarters - Type of juvenile institution unknown (%)
People in Group quarters - Noninstitutionalized population (%)
People in Group quarters - College dormitories (includes college quarters off campus) (%)
People in Group quarters - Military quarters (%)
People in Group quarters - On base (%)
People in Group quarters - Barracks, unaccompanied personnel housing (UPH), (Enlisted/Officer), ;and similar group living quarters for military personnel (%)
People in Group quarters - Transient quarters for temporary residents (%)
People in Group quarters - Military ships (%)
People in Group quarters - Group homes (%)
People in Group quarters - Homes or halfway houses for drug/alcohol abuse (%)
People in Group quarters - Homes for the mentally ill (%)
People in Group quarters - Homes for the mentally retarded (%)
People in Group quarters - Homes for the physically handicapped (%)
People in Group quarters - Other group homes (%)
People in Group quarters - Religious group quarters (%)
People in Group quarters - Dormitories (%)
People in Group quarters - Agriculture workers' dormitories on farms (%)
People in Group quarters - Job Corps and vocational training facilities (%)
People in Group quarters - Other workers' dormitories (%)
People in Group quarters - Crews of maritime vessels (%)
People in Group quarters - Other nonhousehold living situations (%)
People in Group quarters - Other noninstitutional group quarters (%)
Residents speaking English at home (%)
Residents speaking English at home - Born in the United States (%)
Residents speaking English at home - Native, born elsewhere (%)
Residents speaking English at home - Foreign born (%)
Residents speaking Spanish at home (%)
Residents speaking Spanish at home - Born in the United States (%)
Residents speaking Spanish at home - Native, born elsewhere (%)
Residents speaking Spanish at home - Foreign born (%)
Residents speaking other language at home (%)
Residents speaking other language at home - Born in the United States (%)
Residents speaking other language at home - Native, born elsewhere (%)
Residents speaking other language at home - Foreign born (%)
Class of Workers - Employee of private company (%)
Class of Workers - Self-employed in own incorporated business (%)
Class of Workers - Private not-for-profit wage and salary workers (%)
Class of Workers - Local government workers (%)
Class of Workers - State government workers (%)
Class of Workers - Federal government workers (%)
Class of Workers - Self-employed workers in own not incorporated business and Unpaid family workers (%)
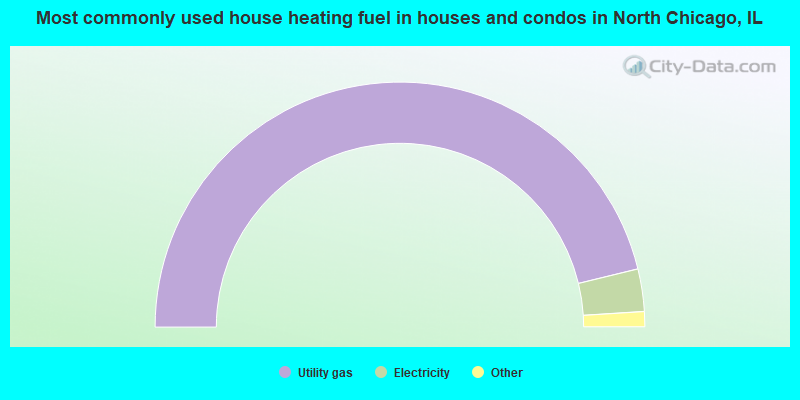
House heating fuel used in houses and condos - Utility gas (%)
House heating fuel used in houses and condos - Bottled, tank, or LP gas (%)
House heating fuel used in houses and condos - Electricity (%)
House heating fuel used in houses and condos - Fuel oil, kerosene, etc. (%)
House heating fuel used in houses and condos - Coal or coke (%)
House heating fuel used in houses and condos - Wood (%)
House heating fuel used in houses and condos - Solar energy (%)
House heating fuel used in houses and condos - Other fuel (%)
House heating fuel used in houses and condos - No fuel used (%)
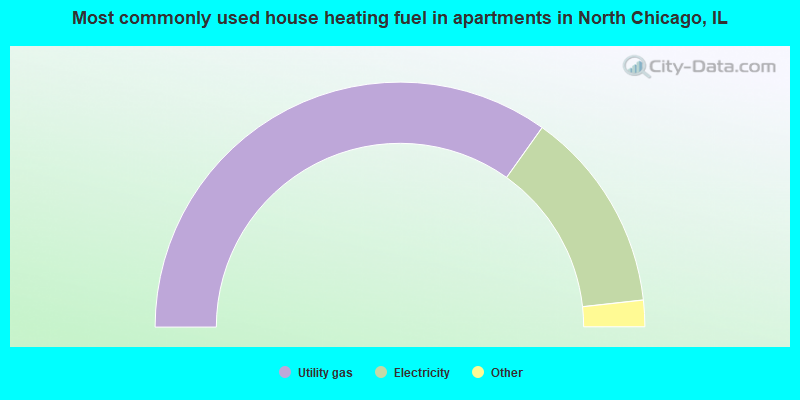
House heating fuel used in apartments - Utility gas (%)
House heating fuel used in apartments - Bottled, tank, or LP gas (%)
House heating fuel used in apartments - Electricity (%)
House heating fuel used in apartments - Fuel oil, kerosene, etc. (%)
House heating fuel used in apartments - Coal or coke (%)
House heating fuel used in apartments - Wood (%)
House heating fuel used in apartments - Solar energy (%)
House heating fuel used in apartments - Other fuel (%)
House heating fuel used in apartments - No fuel used (%)
Armed forces status - In Armed Forces (%)
Armed forces status - Civilian (%)
Armed forces status - Civilian - Veteran (%)
Armed forces status - Civilian - Nonveteran (%)
Fatal accidents locations in years 2005-2021
Fatal accidents locations in 2005
Fatal accidents locations in 2006
Fatal accidents locations in 2007
Fatal accidents locations in 2008
Fatal accidents locations in 2009
Fatal accidents locations in 2010
Fatal accidents locations in 2011
Fatal accidents locations in 2012
Fatal accidents locations in 2013
Fatal accidents locations in 2014
Fatal accidents locations in 2015
Fatal accidents locations in 2016
Fatal accidents locations in 2017
Fatal accidents locations in 2018
Fatal accidents locations in 2019
Fatal accidents locations in 2020
Fatal accidents locations in 2021
Alcohol use - People drinking some alcohol every month (%)
Alcohol use - People not drinking at all (%)
Alcohol use - Average days/month drinking alcohol
Alcohol use - Average drinks/week
Alcohol use - Average days/year people drink much
Audiometry - Average condition of hearing (%)
Audiometry - People that can hear a whisper from across a quiet room (%)
Audiometry - People that can hear normal voice from across a quiet room (%)
Audiometry - Ears ringing, roaring, buzzing (%)
Audiometry - Had a job exposure to loud noise (%)
Audiometry - Had off-work exposure to loud noise (%)
Blood Pressure & Cholesterol - Has high blood pressure (%)
Blood Pressure & Cholesterol - Checking blood pressure at home (%)
Blood Pressure & Cholesterol - Frequently checking blood cholesterol (%)
Blood Pressure & Cholesterol - Has high cholesterol level (%)
Consumer Behavior - Money monthly spent on food at supermarket/grocery store
Consumer Behavior - Money monthly spent on food at other stores
Consumer Behavior - Money monthly spent on eating out
Consumer Behavior - Money monthly spent on carryout/delivered foods
Consumer Behavior - Income spent on food at supermarket/grocery store (%)
Consumer Behavior - Income spent on food at other stores (%)
Consumer Behavior - Income spent on eating out (%)
Consumer Behavior - Income spent on carryout/delivered foods (%)
Current Health Status - General health condition (%)
Current Health Status - Blood donors (%)
Current Health Status - Has blood ever tested for HIV virus (%)
Current Health Status - Left-handed people (%)
Dermatology - People using sunscreen (%)
Diabetes - Diabetics (%)
Diabetes - Had a blood test for high blood sugar (%)
Diabetes - People taking insulin (%)
Diet Behavior & Nutrition - Diet health (%)
Diet Behavior & Nutrition - Milk product consumption (# of products/month)
Diet Behavior & Nutrition - Meals not home prepared (#/week)
Diet Behavior & Nutrition - Meals from fast food or pizza place (#/week)
Diet Behavior & Nutrition - Ready-to-eat foods (#/month)
Diet Behavior & Nutrition - Frozen meals/pizza (#/month)
Drug Use - People that ever used marijuana or hashish (%)
Drug Use - Ever used hard drugs (%)
Drug Use - Ever used any form of cocaine (%)
Drug Use - Ever used heroin (%)
Drug Use - Ever used methamphetamine (%)
Health Insurance - People covered by health insurance (%)
Kidney Conditions-Urology - Avg. # of times urinating at night
Medical Conditions - People with asthma (%)
Medical Conditions - People with anemia (%)
Medical Conditions - People with psoriasis (%)
Medical Conditions - People with overweight (%)
Medical Conditions - Elderly people having difficulties in thinking or remembering (%)
Medical Conditions - People who ever received blood transfusion (%)
Medical Conditions - People having trouble seeing even with glass/contacts (%)
Medical Conditions - People with arthritis (%)
Medical Conditions - People with gout (%)
Medical Conditions - People with congestive heart failure (%)
Medical Conditions - People with coronary heart disease (%)
Medical Conditions - People with angina pectoris (%)
Medical Conditions - People who ever had heart attack (%)
Medical Conditions - People who ever had stroke (%)
Medical Conditions - People with emphysema (%)
Medical Conditions - People with thyroid problem (%)
Medical Conditions - People with chronic bronchitis (%)
Medical Conditions - People with any liver condition (%)
Medical Conditions - People who ever had cancer or malignancy (%)
Mental Health - People who have little interest in doing things (%)
Mental Health - People feeling down, depressed, or hopeless (%)
Mental Health - People who have trouble sleeping or sleeping too much (%)
Mental Health - People feeling tired or having little energy (%)
Mental Health - People with poor appetite or overeating (%)
Mental Health - People feeling bad about themself (%)
Mental Health - People who have trouble concentrating on things (%)
Mental Health - People moving or speaking slowly or too fast (%)
Mental Health - People having thoughts they would be better off dead (%)
Oral Health - Average years since last visit a dentist
Oral Health - People embarrassed because of mouth (%)
Oral Health - People with gum disease (%)
Oral Health - General health of teeth and gums (%)
Oral Health - Average days a week using dental floss/device
Oral Health - Average days a week using mouthwash for dental problem
Oral Health - Average number of teeth
Pesticide Use - Households using pesticides to control insects (%)
Pesticide Use - Households using pesticides to kill weeds (%)
Physical Activity - People doing vigorous-intensity work activities (%)
Physical Activity - People doing moderate-intensity work activities (%)
Physical Activity - People walking or bicycling (%)
Physical Activity - People doing vigorous-intensity recreational activities (%)
Physical Activity - People doing moderate-intensity recreational activities (%)
Physical Activity - Average hours a day doing sedentary activities
Physical Activity - Average hours a day watching TV or videos
Physical Activity - Average hours a day using computer
Physical Functioning - People having limitations keeping them from working (%)
Physical Functioning - People limited in amount of work they can do (%)
Physical Functioning - People that need special equipment to walk (%)
Physical Functioning - People experiencing confusion/memory problems (%)
Physical Functioning - People requiring special healthcare equipment (%)
Prescription Medications - Average number of prescription medicines taking
Preventive Aspirin Use - Adults 40+ taking low-dose aspirin (%)
Reproductive Health - Vaginal deliveries (%)
Reproductive Health - Cesarean deliveries (%)
Reproductive Health - Deliveries resulted in a live birth (%)
Reproductive Health - Pregnancies resulted in a delivery (%)
Reproductive Health - Women breastfeeding newborns (%)
Reproductive Health - Women that had a hysterectomy (%)
Reproductive Health - Women that had both ovaries removed (%)
Reproductive Health - Women that have ever taken birth control pills (%)
Reproductive Health - Women taking birth control pills (%)
Reproductive Health - Women that have ever used Depo-Provera or injectables (%)
Reproductive Health - Women that have ever used female hormones (%)
Sexual Behavior - People 18+ that ever had sex (vaginal, anal, or oral) (%)
Sexual Behavior - Males 18+ that ever had vaginal sex with a woman (%)
Sexual Behavior - Males 18+ that ever performed oral sex on a woman (%)
Sexual Behavior - Males 18+ that ever had anal sex with a woman (%)
Sexual Behavior - Males 18+ that ever had any sex with a man (%)
Sexual Behavior - Females 18+ that ever had vaginal sex with a man (%)
Sexual Behavior - Females 18+ that ever performed oral sex on a man (%)
Sexual Behavior - Females 18+ that ever had anal sex with a man (%)
Sexual Behavior - Females 18+ that ever had any kind of sex with a woman (%)
Sexual Behavior - Average age people first had sex
Sexual Behavior - Average number of female sex partners in lifetime (males 18+)
Sexual Behavior - Average number of female vaginal sex partners in lifetime (males 18+)
Sexual Behavior - Average age people first performed oral sex on a woman (18+)
Sexual Behavior - Average number of woman performed oral sex on in lifetime (18+)
Sexual Behavior - Average number of male sex partners in lifetime (males 18+)
Sexual Behavior - Average number of male anal sex partners in lifetime (males 18+)
Sexual Behavior - Average age people first performed oral sex on a man (18+)
Sexual Behavior - Average number of male oral sex partners in lifetime (18+)
Sexual Behavior - People using protection when performing oral sex (%)
Sexual Behavior - Average number of times people have vaginal or anal sex a year
Sexual Behavior - People having sex without condom (%)
Sexual Behavior - Average number of male sex partners in lifetime (females 18+)
Sexual Behavior - Average number of male vaginal sex partners in lifetime (females 18+)
Sexual Behavior - Average number of female sex partners in lifetime (females 18+)
Sexual Behavior - Circumcised males 18+ (%)
Sleep Disorders - Average hours sleeping at night
Sleep Disorders - People that has trouble sleeping (%)
Smoking-Cigarette Use - People smoking cigarettes (%)
Taste & Smell - People 40+ having problems with smell (%)
Taste & Smell - People 40+ having problems with taste (%)
Taste & Smell - People 40+ that ever had wisdom teeth removed (%)
Taste & Smell - People 40+ that ever had tonsils teeth removed (%)
Taste & Smell - People 40+ that ever had a loss of consciousness because of a head injury (%)
Taste & Smell - People 40+ that ever had a broken nose or other serious injury to face or skull (%)
Taste & Smell - People 40+ that ever had two or more sinus infections (%)
Weight - Average height (inches)
Weight - Average weight (pounds)
Weight - Average BMI
Weight - People that are obese (%)
Weight - People that ever were obese (%)
Weight - People trying to lose weight (%)
Officers per 1,000 residents here:
1.75Illinois average:
2.78
Latest news from North Chicago, IL collected exclusively by city-data.com from local newspapers, TV, and radio stations
Ancestries: American (7.1%), German (3.8%), Irish (1.5%), Italian (1.5%), Polish (1.3%), Scottish (1.1%).
Current Local Time:
Incorporated on 06/24/1895
Land area: 7.83 square miles.
Population density: 3,893 people per square mile (average).
5,440 residents are foreign born (13.1% Latin America , 2.8% Asia ).
This city:
17.7%Illinois:
14.1%
Median real estate property taxes paid for housing units with mortgages in 2022: $3,739 (2.4%)Median real estate property taxes paid for housing units with no mortgage in 2022: $2,925 (2.5%)
Nearest city with pop. 50,000+: Waukegan, IL
Nearest city with pop. 200,000+: Chicago, IL
Nearest cities:
Latitude: 42.32 N, Longitude: 87.85 W
Daytime population change due to commuting: +7,048 (+22.9%)Workers who live and work in this city: 12,113 (68.4%)
Property values in North Chicago, IL
Single-family new house construction building permits:
2022: 5 buildings , average cost: $66,9002021: 4 buildings , average cost: $120,0002020: 6 buildings , average cost: $278,4002019: 7 buildings , average cost: $192,8002017: 4 buildings , average cost: $102,2002009: 1 building , cost: $140,0002008: 2 buildings , average cost: $125,0002007: 4 buildings , average cost: $112,7002006: 13 buildings , average cost: $106,3002005: 18 buildings , average cost: $115,1002004: 32 buildings , average cost: $71,6002003: 34 buildings , average cost: $71,8002002: 33 buildings , average cost: $71,0002001: 24 buildings , average cost: $75,6002000: 39 buildings , average cost: $81,6001999: 30 buildings , average cost: $111,0001998: 27 buildings , average cost: $90,1001997: 27 buildings , average cost: $85,000Unemployment in December 2023:
Most common occupations in North Chicago, IL (%)
Both Males Females
Building and grounds cleaning and maintenance occupations (7.2%)
Other production occupations, including supervisors (5.6%)
Other office and administrative support workers, including supervisors (4.6%)
Material recording, scheduling, dispatching, and distributing workers (4.5%)
Other management occupations, except farmers and farm managers (4.2%)
Laborers and material movers, hand (3.4%)
Customer service representatives (3.2%)
Building and grounds cleaning and maintenance occupations (10.2%)
Material recording, scheduling, dispatching, and distributing workers (5.9%)
Other production occupations, including supervisors (5.4%)
Other management occupations, except farmers and farm managers (5.0%)
Laborers and material movers, hand (4.6%)
Metal workers and plastic workers (4.4%)
Other office and administrative support workers, including supervisors (3.4%)
Other office and administrative support workers, including supervisors (5.9%)
Secretaries and administrative assistants (5.9%)
Other production occupations, including supervisors (5.8%)
Child care workers (5.0%)
Customer service representatives (4.8%)
Nursing, psychiatric, and home health aides (4.3%)
Building and grounds cleaning and maintenance occupations (4.1%)
Tornado activity:
North Chicago-area historical tornado activity is slightly below Illinois state average. It is 26% greater than the overall U.S. average.
On 9/28/1972, a category F4 (max. wind speeds 207-260 mph) tornado 3.0 miles away from the North Chicago city center injured 20 people and caused between $500,000 and $5,000,000 in damages.
On 4/21/1967, a category F4 tornado 14.4 miles away from the city center killed one person and injured 100 people and caused between $500,000 and $5,000,000 in damages.
Earthquake activity:
North Chicago-area historical earthquake activity is significantly above Illinois state average. It is 27% greater than the overall U.S. average. On 4/18/2008 at 09:36:59, a magnitude 5.4 (5.1 MB, 4.8 MS, 5.4 MW, 5.2 MW, Class: Moderate, Intensity: VI - VII) earthquake occurred 267.7 miles away from North Chicago center On 6/10/1987 at 23:48:54, a magnitude 5.1 (4.9 MB, 4.4 MS, 4.6 MS, 5.1 LG) earthquake occurred 242.2 miles away from North Chicago center On 4/18/2008 at 09:36:59, a magnitude 5.2 (5.2 MW, Depth: 8.9 mi) earthquake occurred 267.7 miles away from the city center On 6/28/2004 at 06:10:52, a magnitude 4.2 (4.2 MW, Depth: 6.2 mi, Class: Light, Intensity: IV - V) earthquake occurred 80.3 miles away from the city center On 2/10/2010 at 09:59:35, a magnitude 3.8 (3.8 MW, Depth: 6.2 mi, Class: Light, Intensity: II - III) earthquake occurred 41.1 miles away from North Chicago center On 5/2/2015 at 16:23:07, a magnitude 4.2 (4.2 MW, Depth: 2.8 mi) earthquake occurred 124.3 miles away from the city center Magnitude types: regional Lg-wave magnitude (LG), body-wave magnitude (MB), surface-wave magnitude (MS), moment magnitude (MW) Natural disasters: The number of natural disasters in Lake County (16) is near the US average (15).Major Disasters (Presidential) Declared: 10Emergencies Declared: 5Storms: 9, Floods: 7, Tornadoes: 3, Snows: 2, Snowstorms: 2, Winter Storms: 2, Blizzard: 1, Hurricane: 1, Wind: 1, Other: 1 (Note: some incidents may be assigned to more than one category). Main business address for: FANSTEEL INC MISCELLANEOUS FABRICATED METAL PRODUCTS ).
Hospitals and medical centers in North Chicago: LEWIS TERRACE (1916 16TH STREET) NORTH CHICAGO VA MEDICAL CENTER (Government Federal, 3001 GREENBAY ROAD) SEYMOUR TERRACE (1504 16TH STREET) Amtrak station near North Chicago: 18 miles: GLENVIEW (1116 DEPOT ST.) Services: ticket office, fully wheelchair accessible, enclosed waiting area, public restrooms, public payphones, free short-term parking, free long-term parking, call for car rental service, taxi stand, public transit connection.
College/University in North Chicago: Rosalind Franklin University of Medicine and Science Full-time enrollment: 678; Location: 3333 Green Bay Road; Private, not-for-profit; Website: www.rosalindfranklin.edu/; Offers Doctor's degree )
Colleges/universities with over 2000 students nearest to North Chicago:
College of Lake County (about 9 miles; Grayslake, IL ; Full-time enrollment: 11,041)
Oakton Community College (about 19 miles; Des Plaines, IL ; FT enrollment: 7,271)
Gateway Technical College (about 20 miles; Kenosha, WI ; FT enrollment: 5,089)
Harper College (about 20 miles; Palatine, IL ; FT enrollment: 10,800)
Computer Systems Institute (about 20 miles; Skokie, IL ; FT enrollment: 2,311)
Northwestern University (about 21 miles; Evanston, IL ; FT enrollment: 17,473)
Carthage College (about 21 miles; Kenosha, WI ; FT enrollment: 3,130)
Public high school in North Chicago:
Private high school in North Chicago: DAISYS RESOURCE OPTIONAL SCHOOL Students: 56, Location: 1919 SHERMAN AVE, Grades: 10-12)
Public elementary/middle schools in North Chicago: NEAL MATH SCIENCE ACADEMY Students: 575, Location: 1905 ARGONNE DR, Grades: 6-8)A J KATZENMAIER ELEM SCHOOL Students: 376, Location: 1829 KENNEDY DR, Grades: 3-5)GREENBAY ELEM SCHOOL Students: 371, Location: 2100 GREEN BAY RD, Grades: KG-5)HOWARD A YEAGER ELEM SCH Students: 248, Location: 1811 MORROW AVE, Grades: 3-5)NORTH ELEMENTARY SCHOOL Location: 1210 ADAMS ST, Grades: PK-2)
SOUTH ELEMENTARY SCHOOL Location: 1812 MORROW AVE, Grades: KG-5)
See full list of schools located in North Chicago Library in North Chicago: NORTH CHICAGO PUBLIC LIBRARY Operating income: $625,543; Location: 2100 ARGONNE DRIVE; 50,633 books ; 160 e-books ; 2,154 audio materials ; 3,105 video materials ; 5 local licensed databases ; 18 state licensed databases ; 117 print serial subscriptions )
Notable locations in North Chicago: (A) , Abbott Laboratories Fire Department Station 2 (B) , Great Lakes Naval Station Fire Department Station 3 (C) , Great Lakes Naval Station Fire Department Station 1 (D) , North Chicago Fire Department Station 2 (E) , Recruit Training Center Fire Fighting Trainer (F) , Great Lakes Naval Station Fire Department Station 2 (G) , North Chicago Fire Department (H) , North Chicago Public Library (I) . Display/hide their locations on the map
Main business address in North Chicago: (A) . Display/hide its location on the map
Churches in North Chicago include: (A) , Emmanuel Faith Bible Christian Church (B) , Eternal Flame African Methodist Episcopal Church (C) , First Baptist Church (D) , First Corinthian Baptist Church (E) , Greater Saint James Temple Church (F) , Hillcrest Baptist Church (G) , Living Water Apostolic Church (H) , Mount Sinai Baptist Church (I) . Display/hide their locations on the map
Cemetery: (1) . Display/hide its location on the map
Creek: (A) . Display/hide its location on the map
Parks in North Chicago include: (1) , Constitution Park (2) , Boak Park (3) , Foss Park (4) , Coles Park (5) . Display/hide their locations on the map
Hotels:
Birthplace of: Quincy Miller - Basketball player, Michael Turner - 2005 NFL player (San Diego Chargers, born : Feb 13, 1982).
Lake County has a predicted average indoor radon screening level between 2 and 4 pCi/L (pico curies per liter) - Moderate Potential Average household size: This city:
3.0 peopleIllinois:
2.6 people
Percentage of family households: This city:
66.2%Whole state:
65.8%
Percentage of households with unmarried partners: This city:
6.2%Whole state:
6.3%
Likely homosexual households (counted as self-reported same-sex unmarried-partner households)
Lesbian couples: 0.4% of all households Gay men: 0.2% of all households
People in group quarters in North Chicago in 2010:
12,155 people in military barracks and dormitories (nondisciplinary)
251 people in college/university student housing
130 people in mental (psychiatric) hospitals and psychiatric units in other hospitals
88 people in emergency and transitional shelters (with sleeping facilities) for people experiencing homelessness
63 people in hospitals with patients who have no usual home elsewhere
30 people in residential treatment centers for adults
21 people in group homes intended for adults
3 people in military disciplinary barracks and jails
People in group quarters in North Chicago in 2000:
10,431 people in military barracks, etc.
950 people in wards in military hospitals for patients who have no usual home elsewhere
195 people in military disciplinary barracks
192 people in mental (psychiatric) hospitals or wards
159 people in hospitals or wards for drug/alcohol abuse
154 people in wards in general hospitals for patients who have no usual home elsewhere
104 people in other noninstitutional group quarters
32 people in homes for the mentally retarded
27 people in hospitals/wards and hospices for chronically ill
27 people in other hospitals or wards for chronically ill
24 people in homes or halfway houses for drug/alcohol abuse
14 people in homes for abused, dependent, and neglected children
Banks with branches in North Chicago (2011 data):
First Midwest Bank: North Chicago Branch at 1011 14th Street, branch established on 1912/01/01. Info updated 2011/12/22: Bank assets: $7,848.0 mil, Deposits: $6,529.2 mil, headquarters in Itasca, IL, positive income , Commercial Lending Specialization, 100 total offices , Holding Company: First Midwest Bancorp, Inc.
Lake Forest Bank and Trust Company: North Chicago Community Bank Branch at 1801 Sheridan Rd, branch established on 2007/03/01. Info updated 2006/11/03: Bank assets: $2,592.5 mil, Deposits: $1,581.5 mil, headquarters in Lake Forest, IL, positive income , Commercial Lending Specialization, 8 total offices , Holding Company: Wintrust Financial Corporation
For population 15 years and over in North Chicago:
Never married: 60.6%Now married: 29.2%Separated: 1.7%Widowed: 2.7%Divorced: 5.8% For population 25 years and over in North Chicago:
High school or higher: 80.6%Bachelor's degree or higher: 21.2%Graduate or professional degree: 7.5%Unemployed: 8.3%Mean travel time to work (commute): 12.7 minutes
Education Gini index (Inequality in education) Here:
15.1Illinois average:
12.5
Religion statistics for North Chicago, IL (based on Lake County data)
Religion Adherents Congregations Catholic 211,380 29 Evangelical Protestant 84,501 211 Mainline Protestant 36,967 76 Other 33,822 62 Black Protestant 7,824 16 Orthodox 4,610 8 None 324,358 -
Source: Clifford Grammich, Kirk Hadaway, Richard Houseal, Dale E.Jones, Alexei Krindatch, Richie Stanley and Richard H.Taylor. 2012. 2010 U.S.Religion Census: Religious Congregations & Membership Study. Association of Statisticians of American Religious Bodies. Jones, Dale E., et al. 2002. Congregations and Membership in the United States 2000. Nashville, TN: Glenmary Research Center. Graphs represent county-level data
Food Environment Statistics: Number of grocery stores : 121Lake County :
1.71 / 10,000 pop.Illinois :
2.24 / 10,000 pop.
Number of supercenters and club stores : 4Lake County :
0.06 / 10,000 pop.State :
0.08 / 10,000 pop.
Number of convenience stores (no gas) : 38Lake County :
0.54 / 10,000 pop.State :
0.75 / 10,000 pop.
Number of convenience stores (with gas) : 174Lake County :
2.46 / 10,000 pop.Illinois :
2.61 / 10,000 pop.
Number of full-service restaurants : 457Here :
6.47 / 10,000 pop.State :
6.86 / 10,000 pop.
Adult diabetes rate : This county :
7.3%State :
8.3%
Adult obesity rate : This county :
24.2%State :
25.2%
Low-income preschool obesity rate : This county :
16.3%Illinois :
14.5%
Health and Nutrition: Healthy diet rate : This city:
46.3%State:
49.5%
Average overall health of teeth and gums : This city:
45.5%State:
47.2%
Average BMI : North Chicago:
28.3Illinois:
28.6
People feeling badly about themselves : People not drinking alcohol at all : North Chicago:
10.8%Illinois:
10.8%
Average hours sleeping at night : North Chicago:
6.7Illinois:
6.8
General health condition : This city:
56.9%Illinois:
56.4%
Average condition of hearing : This city:
83.6%Illinois:
79.9%
More about Health and Nutrition of North Chicago, IL Residents
Local government employment and payroll (March 2022)
Function
Full-time employees
Monthly full-time payroll
Average yearly full-time wage
Part-time employees
Monthly part-time payroll
Police Protection - Officers
45 $427,366 $113,964 0 $0 Firefighters
29 $228,638 $94,609 0 $0 Streets and Highways
13 $65,488 $60,450 0 $0 Other Government Administration
11 $30,699 $33,490 0 $0 Local Libraries
9 $29,815 $39,753 8 $8,983 Housing and Community Development (Local)
8 $53,708 $80,562 0 $0 Water Supply
6 $50,125 $100,250 1 $620 Financial Administration
4 $21,141 $63,423 0 $0 Police - Other
3 $16,578 $66,312 13 $6,382 Other and Unallocable
2 $14,391 $86,346 0 $0 Sewerage
1 $9,163 $109,956 0 $0 Fire - Other
1 $5,948 $71,376 0 $0
Totals for Government
132 $953,060 $86,642 22 $15,985
North Chicago government finances - Expenditure in 2018 (per resident):
Construction - Central Staff Services: $60,000 ($1.97)
General Public Buildings: $2,000 ($0.07)Current Operations - Police Protection: $9,520,000 ($312.23)
Local Fire Protection: $4,628,000 ($151.79)General - Other: $4,469,000 ($146.57)General Public Buildings: $4,031,000 ($132.21)Water Utilities: $3,400,000 ($111.51)Financial Administration: $2,371,000 ($77.76)Regular Highways: $2,039,000 ($66.87)Libraries: $593,000 ($19.45)General - Interest on Debt: $4,850,000 ($159.07)
Other Capital Outlay - Central Staff Services: $844,000 ($27.68)
Water Utilities: $805,000 ($26.40)Libraries: $59,000 ($1.94)Total Salaries and Wages: $13,422,000 ($440.21)
North Chicago government finances - Revenue in 2018 (per resident):
Charges - Sewerage: $1,255,000 ($41.16)
Solid Waste Management: $766,000 ($25.12)Federal Intergovernmental - Housing and Community Development: $441,000 ($14.46)
Public Welfare: $83,000 ($2.72)Miscellaneous - Fines and Forfeits: $2,415,000 ($79.21)
General Revenue - Other: $705,000 ($23.12)Interest Earnings: $95,000 ($3.12)Revenue - Water Utilities: $5,476,000 ($179.60)
State Intergovernmental - General Local Government Support: $6,841,000 ($224.37)
Highways: $832,000 ($27.29)Other: $107,000 ($3.51)Housing and Community Development: $1,000 ($0.03)Tax - Property: $10,821,000 ($354.90)
Other Selective Sales: $2,864,000 ($93.93)Public Utilities Sales: $2,276,000 ($74.65)Other License: $605,000 ($19.84)
North Chicago government finances - Debt in 2018 (per resident):
Long Term Debt - Beginning Outstanding - Unspecified Public Purpose: $121,257,000 ($3976.94)
Outstanding Unspecified Public Purpose: $118,982,000 ($3902.33)Retired Unspecified Public Purpose: $14,945,000 ($490.16)Issue, Unspecified Public Purpose: $12,670,000 ($415.55)
North Chicago government finances - Cash and Securities in 2018 (per resident):
Other Funds - Cash and Securities: $24,474,000 ($802.69)
6.06% of this county's 2021 resident taxpayers lived in other counties in 2020 ($110,528 average adjusted gross income )
Here:
6.06%Illinois average:
5.09%
0.03% of residents moved from foreign countries ($301 average AGI )Lake County:
0.03%Illinois average:
0.01%
Top counties from which taxpayers relocated into this county between 2020 and 2021:
6.71% of this county's 2020 resident taxpayers moved to other counties in 2021 ($163,220 average adjusted gross income )
Here:
6.71%Illinois average:
6.10%
0.04% of residents moved to foreign countries ($308 average AGI )Lake County:
0.04%Illinois average:
0.01%
Top counties to which taxpayers relocated from this county between 2020 and 2021:
Businesses in North Chicago, IL
Name Count Name Count
Advance Auto Parts 1 Dunkin Donuts 1 Arby's 1 FedEx 1 Baskin-Robbins 1 KFC 1 Burger King 1 McDonald's 1 Cricket Wireless 1 Subway 3 Domino's Pizza 1 Taco Bell 1
Strongest AM radio stations in North Chicago:
WKRS (1220 AM; 1 kW; WAUKEGAN, IL; Owner: NM LICENSING, LLC)
WGN (720 AM; 50 kW; CHICAGO, IL; Owner: WGN CONTINENTAL BROADCASTING CO.)
WBBM (780 AM; 50 kW; CHICAGO, IL; Owner: INFINITY BROADCASTING OPERATIONS, INC.)
WTMJ (620 AM; 50 kW; MILWAUKEE, WI; Owner: JOURNAL BROADCAST CORPORATION)
WSCR (670 AM; 50 kW; CHICAGO, IL; Owner: INFINITY BROADCASTING OPERATIONS, INC.)
WISN (1130 AM; 50 kW; MILWAUKEE, WI; Owner: CAPSTAR TX LIMITED PARTNERSHIP)
WMVP (1000 AM; 50 kW; CHICAGO, IL; Owner: ABC, INC.)
WKTA (1330 AM; 5 kW; EVANSTON, IL; Owner: POLNET COMMUNICATIONS, LTD.)
WLS (890 AM; 50 kW; CHICAGO, IL; Owner: WLS, INC.)
WYLL (1160 AM; 50 kW; CHICAGO, IL; Owner: SCA LICENSE CORPORATION)
WCSN (820 AM; 5 kW; CHICAGO, IL; Owner: WYPA, INC.)
WVIV (1200 AM; 20 kW; CHICAGO, IL; Owner: WLXX-AM LICENSE CORP.)
WNVR (1030 AM; 5 kW; VERNON HILLS, IL; Owner: POLNET COMMUNICATIONS, LTD.)
Strongest FM radio stations in North Chicago:
WXLC (102.3 FM; WAUKEGAN, IL; Owner: NM LICENSING, LLC)
WWDV (96.9 FM; ZION, IL; Owner: BONNEVILLE HOLDING COMPANY)
WCKG (105.9 FM; ELMWOOD PARK, IL; Owner: INFINITY HOLDINGS CORPORATION OF ORLANDO)
WLIT-FM (93.9 FM; CHICAGO, IL; Owner: AMFM RADIO LICENSES, L.L.C.)
WJMK (104.3 FM; CHICAGO, IL; Owner: INFINITY BROADCASTING CORP. OF ILLINOIS)
WNUA (95.5 FM; CHICAGO, IL; Owner: AMFM RADIO LICENSES, L.L.C.)
WGCI-FM (107.5 FM; CHICAGO, IL; Owner: AMFM RADIO LICENSES, L.L.C.)
WTMX (101.9 FM; SKOKIE, IL; Owner: BONNEVILLE HOLDING COMPANY)
WBBM-FM (96.3 FM; CHICAGO, IL; Owner: INFINITY BROADCASTING OPERATIONS, INC.)
WKSC-FM (103.5 FM; CHICAGO, IL; Owner: AMFM RADIO LICENSES, L.L.C.)
WFMT (98.7 FM; CHICAGO, IL; Owner: WINDOW TO THE WORLD COMMUNICATIONS)
WZZN (94.7 FM; CHICAGO, IL; Owner: ABC CHICAGO FM RADIO,INC.)
WBEZ (91.5 FM; CHICAGO, IL; Owner: THE WBEZ ALLIANCE, INC.)
WKQX (101.1 FM; CHICAGO, IL; Owner: EMMIS RADIO LICENSE CORPORATION)
WLUP-FM (97.9 FM; CHICAGO, IL; Owner: BONNEVILLE HOLDING COMPANY)
WNND (100.3 FM; CHICAGO, IL; Owner: BONNEVILLE HOLDING COMPANY)
WOJO (105.1 FM; EVANSTON, IL; Owner: TICHENOR LICENSE CORPORATION ("TLC"))
WUSN (99.5 FM; CHICAGO, IL; Owner: INFINITY BROADCASTING CORPORATION OF CHICAGO)
WVAZ (102.7 FM; OAK PARK, IL; Owner: AMFM RADIO LICENSES, L.L.C.)
WXRT-FM (93.1 FM; CHICAGO, IL; Owner: INFINITY BROADCASTING OPERATIONS, INC.)
TV broadcast stations around North Chicago:
W64CQ (Channel 64; ARLINGTON HEIGHTS, IL; Owner: TRINITY BROADCASTING NETWORK)
W34CK (Channel 34; ARLINGTON HEIGHTS, IL; Owner: FIRST UNITED, INC.)
WLS-TV (Channel 7; CHICAGO, IL; Owner: WLS TELEVISION, INC.)
WMAQ-TV (Channel 5; CHICAGO, IL; Owner: NBC SUBSIDIARY (WMAQ-TV), INC.)
WTTW (Channel 11; CHICAGO, IL; Owner: WINDOW TO THE WORLD COMMUNICATIONS, INC.)
WGBO-TV (Channel 66; JOLIET, IL; Owner: WGBO LICENSE PARTNERSHIP, G.P.)
WGN-TV (Channel 9; CHICAGO, IL; Owner: WGN CONTINENTAL BROADCASTING COMPANY)
WBBM-TV (Channel 2; CHICAGO, IL; Owner: CBS BROADCASTING INC.)
WPWR-TV (Channel 50; GARY, IN; Owner: FOX TELEVISION STATIONS, INC.)
WXFT (Channel 60; AURORA, IL; Owner: TELEFUTURA CHICAGO LLC)
WCIU-TV (Channel 26; CHICAGO, IL; Owner: WCIU-TV LIMITED PARTNERSHIP)
WCPX (Channel 38; CHICAGO, IL; Owner: PAXSON CHICAGO LICENSE, INC.)
WSNS-TV (Channel 44; CHICAGO, IL; Owner: TELEMUNDO OF CHICAGO, INC.)
WFLD (Channel 32; CHICAGO, IL; Owner: FOX TELEVISION STATIONS, INC.)
W68DO (Channel 68; PALATINE, IL; Owner: TRINITY BROADCASTING NETWORK)
WFBT-CA (Channel 23; CHICAGO, IL; Owner: CHANNEL 23 LIMITED PARTNERSHIP)
WJYS (Channel 62; HAMMOND, IN; Owner: JOVON BROADCASTING CORPORATION)
WOCH-LP (Channel 28; CHICAGO, IL; Owner: KM LPTV OF CHICAGO-28, L.L.C.)
WYCC (Channel 20; CHICAGO, IL; Owner: COLLEGE DIST. #508, COUNTY OF COOK)
WOCK-CA (Channel 13; CHICAGO, IL; Owner: KM LPTV OF CHICAGO-13, L.L.C.)
WJJA (Channel 49; RACINE, WI; Owner: TV-49, INC.)
W57DN (Channel 57; ELGIN, IL; Owner: TRINITY BROADCASTING NETWORK)
National Bridge Inventory (NBI) Statistics 15 Number of bridges164ft / 49.8m Total length $198,000 Total costs106,530 Total average daily traffic4,033 Total average daily truck traffic
New bridges - historical statistics
1 1900-1909 1 1920-1929 1 1930-1939 1 1940-1949 1 1950-1959 1 1970-1979 7 1980-1989 2 2000-2009
See full National Bridge Inventory statistics for North Chicago, IL
Home Mortgage Disclosure Act Aggregated Statistics For Year 2009(Based on 4 full and 2 partial tracts) A) FHA, FSA/RHS & VA B) Conventional C) Refinancings D) Home Improvement Loans E) Loans on Dwellings For 5+ Families F) Non-occupant Loans on G) Loans On Manufactured Number Average Value Number Average Value Number Average Value Number Average Value Number Average Value Number Average Value Number Average Value
LOANS ORIGINATED 25 $99,658 18 $118,317 123 $188,504 4 $24,685 1 $565,000 26 $79,836 0 $0 APPLICATIONS APPROVED, NOT ACCEPTED 5 $115,866 4 $100,475 20 $159,388 1 $4,000 0 $0 1 $32,000 0 $0 APPLICATIONS DENIED 4 $87,480 6 $91,913 92 $137,089 11 $18,185 0 $0 9 $121,953 1 $140,000 APPLICATIONS WITHDRAWN 7 $104,273 2 $116,615 37 $162,709 3 $42,330 0 $0 1 $71,000 0 $0 FILES CLOSED FOR INCOMPLETENESS 3 $71,087 1 $157,020 14 $144,981 0 $0 0 $0 0 $0 0 $0
Aggregated Statistics For Year 2008(Based on 5 full and 3 partial tracts) A) FHA, FSA/RHS & VA B) Conventional C) Refinancings D) Home Improvement Loans E) Loans on Dwellings For 5+ Families F) Non-occupant Loans on G) Loans On Manufactured Number Average Value Number Average Value Number Average Value Number Average Value Number Average Value Number Average Value Number Average Value
LOANS ORIGINATED 16 $129,574 35 $141,774 143 $160,645 11 $48,075 3 $399,333 39 $92,761 0 $0 APPLICATIONS APPROVED, NOT ACCEPTED 5 $184,976 7 $156,221 24 $152,440 4 $55,285 1 $210,000 4 $91,145 0 $0 APPLICATIONS DENIED 5 $141,650 32 $106,338 172 $142,455 26 $61,595 2 $285,000 18 $88,992 1 $28,940 APPLICATIONS WITHDRAWN 7 $144,557 15 $125,411 33 $169,498 4 $75,358 0 $0 9 $87,000 0 $0 FILES CLOSED FOR INCOMPLETENESS 1 $99,000 6 $110,487 16 $172,093 1 $160,000 0 $0 2 $51,690 0 $0
Aggregated Statistics For Year 2007(Based on 5 full and 2 partial tracts) A) FHA, FSA/RHS & VA B) Conventional C) Refinancings D) Home Improvement Loans E) Loans on Dwellings For 5+ Families F) Non-occupant Loans on Number Average Value Number Average Value Number Average Value Number Average Value Number Average Value Number Average Value
LOANS ORIGINATED 6 $138,578 98 $149,813 237 $148,371 23 $66,967 6 $308,157 61 $136,285 APPLICATIONS APPROVED, NOT ACCEPTED 0 $0 13 $121,491 53 $131,418 9 $85,777 1 $327,000 11 $122,345 APPLICATIONS DENIED 4 $155,215 59 $128,563 256 $141,125 67 $62,845 1 $240,000 35 $134,877 APPLICATIONS WITHDRAWN 2 $214,475 20 $114,506 70 $151,004 7 $68,677 0 $0 13 $110,124 FILES CLOSED FOR INCOMPLETENESS 0 $0 13 $136,313 38 $147,773 1 $97,010 0 $0 3 $137,030
Aggregated Statistics For Year 2006(Based on 5 full and 3 partial tracts) A) FHA, FSA/RHS & VA B) Conventional C) Refinancings D) Home Improvement Loans E) Loans on Dwellings For 5+ Families F) Non-occupant Loans on Number Average Value Number Average Value Number Average Value Number Average Value Number Average Value Number Average Value
LOANS ORIGINATED 21 $139,411 266 $110,220 285 $137,027 31 $61,230 6 $3,523,923 88 $106,638 APPLICATIONS APPROVED, NOT ACCEPTED 2 $211,775 67 $105,812 65 $118,690 17 $65,879 2 $80,000 21 $84,594 APPLICATIONS DENIED 4 $123,558 159 $102,872 301 $125,899 35 $45,863 1 $647,510 44 $127,687 APPLICATIONS WITHDRAWN 3 $140,170 66 $100,617 139 $138,142 9 $49,109 0 $0 19 $123,328 FILES CLOSED FOR INCOMPLETENESS 0 $0 21 $101,527 65 $145,273 3 $84,343 0 $0 7 $95,340
Aggregated Statistics For Year 2005(Based on 5 full and 3 partial tracts) A) FHA, FSA/RHS & VA B) Conventional C) Refinancings D) Home Improvement Loans E) Loans on Dwellings For 5+ Families F) Non-occupant Loans on G) Loans On Manufactured Number Average Value Number Average Value Number Average Value Number Average Value Number Average Value Number Average Value Number Average Value
LOANS ORIGINATED 33 $135,169 288 $101,672 354 $133,381 26 $58,505 9 $417,634 117 $95,554 0 $0 APPLICATIONS APPROVED, NOT ACCEPTED 3 $101,273 72 $105,589 106 $112,392 13 $56,605 0 $0 27 $92,157 0 $0 APPLICATIONS DENIED 4 $131,482 171 $98,758 391 $125,070 58 $44,526 1 $184,000 62 $121,865 4 $113,780 APPLICATIONS WITHDRAWN 8 $155,189 91 $107,327 208 $131,667 26 $171,382 2 $265,335 27 $109,946 0 $0 FILES CLOSED FOR INCOMPLETENESS 2 $166,890 23 $95,751 46 $125,374 1 $23,020 0 $0 4 $127,828 0 $0
Aggregated Statistics For Year 2004(Based on 5 full and 3 partial tracts) A) FHA, FSA/RHS & VA B) Conventional C) Refinancings D) Home Improvement Loans E) Loans on Dwellings For 5+ Families F) Non-occupant Loans on G) Loans On Manufactured Number Average Value Number Average Value Number Average Value Number Average Value Number Average Value Number Average Value Number Average Value
LOANS ORIGINATED 41 $125,912 203 $119,746 392 $126,128 36 $79,379 4 $522,915 86 $103,585 2 $13,855 APPLICATIONS APPROVED, NOT ACCEPTED 4 $144,888 50 $103,945 87 $122,948 7 $53,994 0 $0 14 $73,741 0 $0 APPLICATIONS DENIED 8 $120,229 84 $103,088 398 $112,054 78 $49,900 0 $0 55 $87,892 1 $15,670 APPLICATIONS WITHDRAWN 6 $127,778 51 $102,279 179 $118,393 11 $72,598 0 $0 31 $101,002 0 $0 FILES CLOSED FOR INCOMPLETENESS 3 $105,230 13 $122,435 99 $119,938 2 $57,200 0 $0 7 $124,339 0 $0
Aggregated Statistics For Year 2003(Based on 5 full and 3 partial tracts) A) FHA, FSA/RHS & VA B) Conventional C) Refinancings D) Home Improvement Loans E) Loans on Dwellings For 5+ Families F) Non-occupant Loans on Number Average Value Number Average Value Number Average Value Number Average Value Number Average Value Number Average Value
LOANS ORIGINATED 77 $120,027 131 $121,859 526 $130,250 18 $15,234 7 $343,917 91 $98,636 APPLICATIONS APPROVED, NOT ACCEPTED 9 $153,790 39 $128,079 81 $114,822 5 $28,848 0 $0 15 $104,423 APPLICATIONS DENIED 18 $142,534 64 $108,883 317 $103,671 33 $17,740 0 $0 37 $96,535 APPLICATIONS WITHDRAWN 11 $141,747 24 $128,806 287 $113,927 10 $13,513 0 $0 14 $122,550 FILES CLOSED FOR INCOMPLETENESS 6 $107,000 3 $136,227 29 $108,238 0 $0 0 $0 0 $0
Aggregated Statistics For Year 2002(Based on 2 full and 2 partial tracts) A) FHA, FSA/RHS & VA B) Conventional C) Refinancings D) Home Improvement Loans E) Loans on Dwellings For 5+ Families F) Non-occupant Loans on Number Average Value Number Average Value Number Average Value Number Average Value Number Average Value Number Average Value
LOANS ORIGINATED 47 $119,730 39 $155,194 249 $151,001 15 $44,965 1 $342,310 21 $86,869 APPLICATIONS APPROVED, NOT ACCEPTED 5 $103,130 9 $65,962 46 $123,713 2 $17,685 0 $0 7 $68,167 APPLICATIONS DENIED 5 $102,134 20 $83,530 89 $104,265 18 $24,953 0 $0 15 $82,630 APPLICATIONS WITHDRAWN 0 $0 8 $227,414 86 $107,675 1 $38,380 0 $0 7 $133,216 FILES CLOSED FOR INCOMPLETENESS 1 $123,000 5 $95,008 45 $101,528 0 $0 0 $0 4 $80,635
Aggregated Statistics For Year 2001(Based on 2 full and 2 partial tracts) A) FHA, FSA/RHS & VA B) Conventional C) Refinancings D) Home Improvement Loans F) Non-occupant Loans on Number Average Value Number Average Value Number Average Value Number Average Value Number Average Value
LOANS ORIGINATED 68 $123,006 50 $154,289 168 $140,886 19 $34,136 20 $86,689 APPLICATIONS APPROVED, NOT ACCEPTED 6 $114,913 4 $82,188 30 $108,853 5 $29,196 3 $99,310 APPLICATIONS DENIED 5 $122,368 12 $93,050 129 $85,027 33 $20,211 6 $75,303 APPLICATIONS WITHDRAWN 8 $127,418 5 $115,552 76 $96,736 6 $28,155 4 $56,680 FILES CLOSED FOR INCOMPLETENESS 1 $73,680 0 $0 14 $110,338 0 $0 0 $0
Aggregated Statistics For Year 2000(Based on 2 full and 2 partial tracts) A) FHA, FSA/RHS & VA B) Conventional C) Refinancings D) Home Improvement Loans F) Non-occupant Loans on Number Average Value Number Average Value Number Average Value Number Average Value Number Average Value
LOANS ORIGINATED 73 $99,241 65 $139,358 71 $107,692 24 $21,319 18 $75,136 APPLICATIONS APPROVED, NOT ACCEPTED 5 $102,876 7 $117,773 29 $87,496 13 $19,298 4 $72,572 APPLICATIONS DENIED 8 $113,632 18 $74,800 84 $81,704 37 $20,855 14 $64,099 APPLICATIONS WITHDRAWN 3 $74,470 8 $80,628 36 $103,079 5 $19,194 3 $177,763 FILES CLOSED FOR INCOMPLETENESS 1 $89,030 3 $83,703 9 $91,037 1 $38,040 1 $10,740
Aggregated Statistics For Year 1999(Based on 4 full and 3 partial tracts) A) FHA, FSA/RHS & VA B) Conventional C) Refinancings D) Home Improvement Loans E) Loans on Dwellings For 5+ Families F) Non-occupant Loans on Number Average Value Number Average Value Number Average Value Number Average Value Number Average Value Number Average Value
LOANS ORIGINATED 104 $99,143 121 $101,023 206 $96,935 59 $16,101 1 $412,710 53 $68,148 APPLICATIONS APPROVED, NOT ACCEPTED 5 $81,700 26 $72,793 55 $80,859 11 $17,402 0 $0 10 $79,782 APPLICATIONS DENIED 18 $95,552 66 $50,926 178 $80,061 80 $23,132 1 $142,000 17 $67,281 APPLICATIONS WITHDRAWN 13 $98,779 20 $57,500 119 $79,244 10 $25,394 0 $0 5 $60,030 FILES CLOSED FOR INCOMPLETENESS 0 $0 5 $111,604 33 $96,570 1 $11,700 0 $0 1 $63,980
Detailed HMDA statistics for the following Tracts:
8628.00
, 8629.01 , 8629.02 , 8630.01 , 8630.02 , 8631.00 , 8632.01 , 8632.02
Private Mortgage Insurance Companies Aggregated Statistics For Year 2009(Based on 3 full and 2 partial tracts) A) Conventional B) Refinancings C) Non-occupant Loans on Number Average Value Number Average Value Number Average Value
LOANS ORIGINATED 0 $0 2 $149,895 0 $0 APPLICATIONS APPROVED, NOT ACCEPTED 2 $126,625 4 $150,372 1 $161,150 APPLICATIONS DENIED 0 $0 0 $0 0 $0 APPLICATIONS WITHDRAWN 0 $0 1 $199,650 0 $0 FILES CLOSED FOR INCOMPLETENESS 0 $0 0 $0 0 $0
Aggregated Statistics For Year 2008(Based on 4 full and 2 partial tracts) A) Conventional B) Refinancings C) Non-occupant Loans on Number Average Value Number Average Value Number Average Value
LOANS ORIGINATED 15 $122,408 17 $158,354 4 $94,985 APPLICATIONS APPROVED, NOT ACCEPTED 10 $146,883 12 $161,321 3 $131,170 APPLICATIONS DENIED 3 $125,637 5 $150,900 2 $126,000 APPLICATIONS WITHDRAWN 1 $146,000 0 $0 0 $0 FILES CLOSED FOR INCOMPLETENESS 2 $83,660 1 $157,000 3 $108,107
Aggregated Statistics For Year 2007(Based on 4 full and 2 partial tracts) A) Conventional B) Refinancings C) Non-occupant Loans on Number Average Value Number Average Value Number Average Value
LOANS ORIGINATED 45 $141,554 39 $153,943 6 $130,137 APPLICATIONS APPROVED, NOT ACCEPTED 5 $126,668 6 $169,673 0 $0 APPLICATIONS DENIED 5 $121,458 1 $135,030 0 $0 APPLICATIONS WITHDRAWN 1 $195,790 3 $132,533 0 $0 FILES CLOSED FOR INCOMPLETENESS 0 $0 0 $0 0 $0
Aggregated Statistics For Year 2006(Based on 4 full and 2 partial tracts) A) Conventional B) Refinancings C) Non-occupant Loans on Number Average Value Number Average Value Number Average Value
LOANS ORIGINATED 37 $126,044 18 $156,065 2 $85,060 APPLICATIONS APPROVED, NOT ACCEPTED 3 $155,117 4 $141,325 0 $0 APPLICATIONS DENIED 0 $0 2 $186,885 0 $0 APPLICATIONS WITHDRAWN 1 $84,740 1 $114,360 0 $0 FILES CLOSED FOR INCOMPLETENESS 0 $0 1 $133,000 0 $0
Aggregated Statistics For Year 2005(Based on 4 full and 2 partial tracts) A) Conventional B) Refinancings C) Non-occupant Loans on Number Average Value Number Average Value Number Average Value
LOANS ORIGINATED 31 $130,002 21 $154,688 6 $106,137 APPLICATIONS APPROVED, NOT ACCEPTED 4 $131,162 10 $156,798 0 $0 APPLICATIONS DENIED 3 $151,000 2 $136,000 2 $136,000 APPLICATIONS WITHDRAWN 2 $165,765 3 $143,207 0 $0 FILES CLOSED FOR INCOMPLETENESS 1 $120,000 0 $0 0 $0
Aggregated Statistics For Year 2004(Based on 4 full and 2 partial tracts) A) Conventional B) Refinancings C) Non-occupant Loans on Number Average Value Number Average Value Number Average Value
LOANS ORIGINATED 59 $123,615 40 $128,336 10 $105,820 APPLICATIONS APPROVED, NOT ACCEPTED 10 $125,130 10 $140,520 5 $90,624 APPLICATIONS DENIED 0 $0 0 $0 0 $0 APPLICATIONS WITHDRAWN 6 $106,183 8 $138,736 1 $160,470 FILES CLOSED FOR INCOMPLETENESS 0 $0 1 $115,130 0 $0
Aggregated Statistics For Year 2003(Based on 4 full and 2 partial tracts) A) Conventional B) Refinancings C) Non-occupant Loans on Number Average Value Number Average Value Number Average Value
LOANS ORIGINATED 48 $121,848 45 $120,376 10 $104,441 APPLICATIONS APPROVED, NOT ACCEPTED 9 $118,892 13 $133,642 3 $105,133 APPLICATIONS DENIED 2 $80,900 0 $0 1 $72,000 APPLICATIONS WITHDRAWN 5 $123,600 6 $163,267 2 $83,500 FILES CLOSED FOR INCOMPLETENESS 0 $0 0 $0 0 $0
Aggregated Statistics For Year 2002(Based on 2 full and 2 partial tracts) A) Conventional B) Refinancings C) Non-occupant Loans on Number Average Value Number Average Value Number Average Value
LOANS ORIGINATED 14 $122,632 29 $131,050 2 $55,400 APPLICATIONS APPROVED, NOT ACCEPTED 1 $165,830 5 $130,682 0 $0 APPLICATIONS DENIED 1 $52,490 6 $119,730 0 $0 APPLICATIONS WITHDRAWN 1 $103,610 2 $166,165 0 $0 FILES CLOSED FOR INCOMPLETENESS 0 $0 0 $0 0 $0
Aggregated Statistics For Year 2001(Based on 2 full and 2 partial tracts) A) Conventional B) Refinancings C) Non-occupant Loans on Number Average Value Number Average Value Number Average Value
LOANS ORIGINATED 20 $117,688 14 $133,214 3 $83,710 APPLICATIONS APPROVED, NOT ACCEPTED 6 $87,168 5 $146,514 1 $52,960 APPLICATIONS DENIED 0 $0 3 $125,820 0 $0 APPLICATIONS WITHDRAWN 1 $120,500 2 $78,095 0 $0 FILES CLOSED FOR INCOMPLETENESS 0 $0 1 $104,000 0 $0
Aggregated Statistics For Year 2000(Based on 2 full and 2 partial tracts) A) Conventional B) Refinancings C) Non-occupant Loans on Number Average Value Number Average Value Number Average Value
LOANS ORIGINATED 20 $109,481 8 $104,365 5 $58,420 APPLICATIONS APPROVED, NOT ACCEPTED 2 $171,930 3 $158,207 0 $0 APPLICATIONS DENIED 1 $150,320 0 $0 1 $60,000 APPLICATIONS WITHDRAWN 1 $143,020 1 $164,630 0 $0 FILES CLOSED FOR INCOMPLETENESS 0 $0 0 $0 0 $0
Aggregated Statistics For Year 1999(Based on 3 full and 2 partial tracts) A) Conventional B) Refinancings C) Non-occupant Loans on Number Average Value Number Average Value Number Average Value
LOANS ORIGINATED 29 $113,913 18 $105,233 8 $100,919 APPLICATIONS APPROVED, NOT ACCEPTED 1 $187,770 5 $139,510 0 $0 APPLICATIONS DENIED 3 $55,780 5 $123,210 4 $41,742 APPLICATIONS WITHDRAWN 3 $116,987 2 $103,985 1 $113,000 FILES CLOSED FOR INCOMPLETENESS 0 $0 0 $0 0 $0
Detailed PMIC statistics for the following Tracts:
8628.00
, 8629.01 , 8629.02 , 8631.00 , 8632.01 , 8632.02
Most common first names in North Chicago, IL among deceased individuals Name Count Lived (average)
John 264 71.9 years Mary 216 79.6 years William 192 69.7 years Joseph 180 72.0 years Frank 168 75.9 years James 166 66.9 years Robert 154 65.2 years Edward 116 69.9 years George 110 69.6 years Charles 100 65.8 years
Most common last names in North Chicago, IL among deceased individuals Last name Count Lived (average)
Johnson 98 69.7 years Jones 76 72.3 years Williams 74 69.4 years Brown 64 64.9 years Smith 56 67.7 years Thompson 50 68.2 years Miller 46 72.1 years Davis 44 65.6 years Harris 40 66.8 years Jackson 40 67.4 years
North Chicago compared to Illinois state average:
Median household income below state average. Median house value below state average. Unemployed percentage below state average. Hispanic race population percentage above state average. Median age significantly below state average. Renting percentage above state average. Length of stay since moving in significantly above state average. North Chicago on our top lists :
#5 on the list of "Top 101 cities with the largest percentage of people in wards in military hospitals for patients who have no usual home elsewhere (population 1,000+)"
#10 on the list of "Top 101 cities with the largest percentage of people in military disciplinary barracks (population 1,000+)"
#18 on the list of "Top 101 cities where the highest percentage of males (15+ years) which never married (with at least 10,000 males in this group)"
#21 on the list of "Top 101 cities with the largest city-data.com crime index decrease from 2011 to 2012 (population 5,000+)"
#21 on the list of "Top 101 cities with the largest city-data.com crime index decrease from 2002 to 2012 (population 5,000+)"
#30 on the list of "Top 101 cities with the largest percentage of people in military barracks, etc. (population 1,000+)"
#43 on the list of "Top 101 cities with the most people walking to work (population 5,000+)"
#50 on the list of "Top 101 cities with the largest percentage of people in hospitals or wards for drug/alcohol abuse (population 1,000+)"
#69 on the list of "Top 101 cities with the lowest number of thefts per 100,000 residents (population 5,000+)"
#69 on the list of "Top 101 cities with the largest percentage population decrease from 2000 (population 5,000+)"
#71 on the list of "Top 100 cities with youngest residents (pop. 5,000+)"
#81 on the list of "Top 100 cities with the largest percentage of males (pop. 5,000+)"
#97 on the list of "Top 101 cities with the largest percentage of people in wards in general hospitals for patients who have no usual home elsewhere (population 1,000+)"
#99 on the list of "Top 101 cities with the least people living the same house as 1 year ago (population 5,000+))"
#101 on the list of "Top 101 cities where the highest percentage of males (15+ years) which never married (with at least 1,000 males in this group)"
#36 (60064) on the list of "Top 101 zip codes with the largest percentage of Greek first ancestries (pop 5,000+)"
#42 (60064) on the list of "Top 101 zip codes with the largest percentage of Lithuanian first ancestries (pop 5,000+)"
#4 on the list of "Top 101 counties with the highest average weight of females"
#22 on the list of "Top 101 counties with the largest decrease in the number of births per 1000 residents 2000-2006 to 2007-2013 (pop 50,000+)"
#24 on the list of "Top 101 counties with the largest increase in the number of infant deaths per 1000 residents 2000-2006 to 2007-2013 (pop. 50,000+)"
#29 on the list of "Top 101 counties with the highest percentage of residents that exercised in the past month"
#31 on the list of "Top 101 counties with the largest number of people moving out compared to moving in (pop. 50,000+)"
Top Patent Applicants
Abbvie Inc. (28)
Yanbin Lao (9)
Jürgen Dinges (8)
Clarissa Jakob (7)
Mary E. Bellizzi (4)
Michelle L. Hastings (4)
Lawrence Black (3)
Marjoleen Nijsen (3)
Steven Hannick (2)
Anthony West (2)
Total of 88 patent applications in 2008-2024.

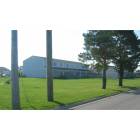
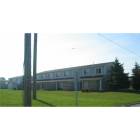
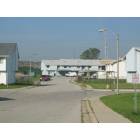

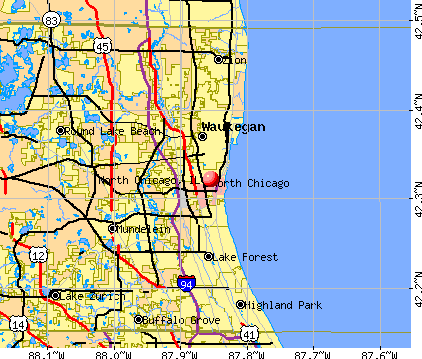


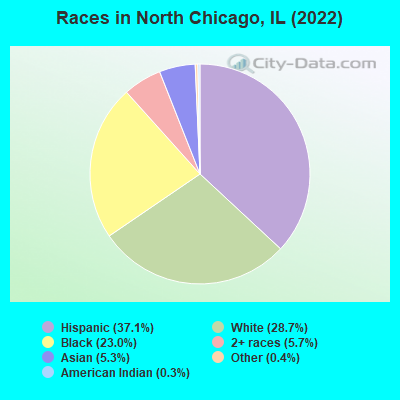
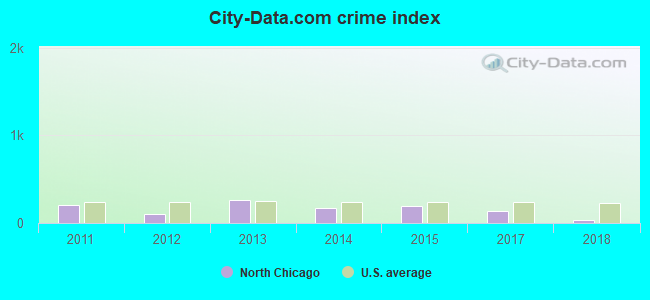
 Recent articles from our blog. Our writers, many of them Ph.D. graduates or candidates, create easy-to-read articles on a wide variety of topics.

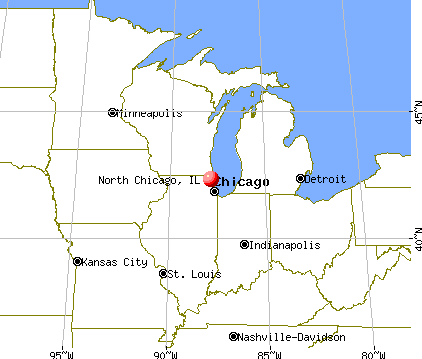
 (3.5 miles
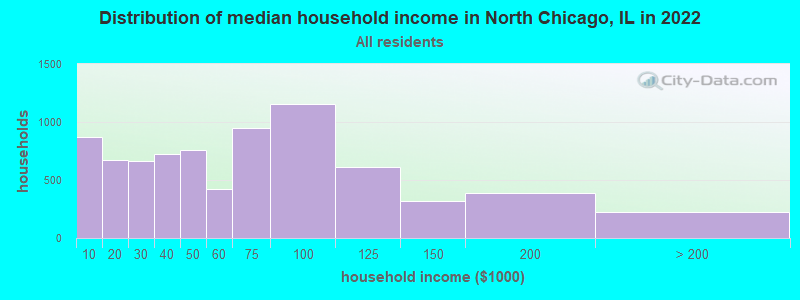
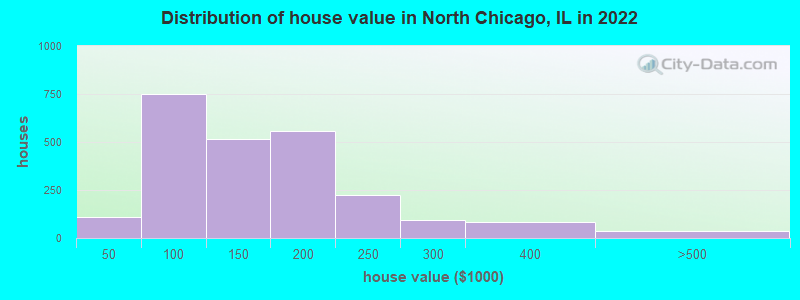
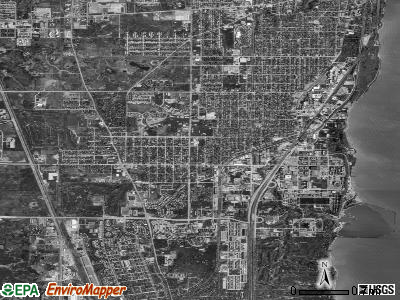
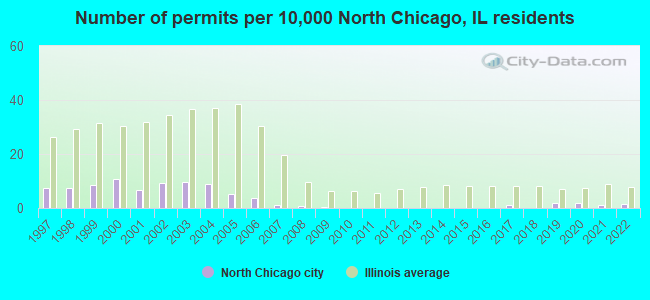
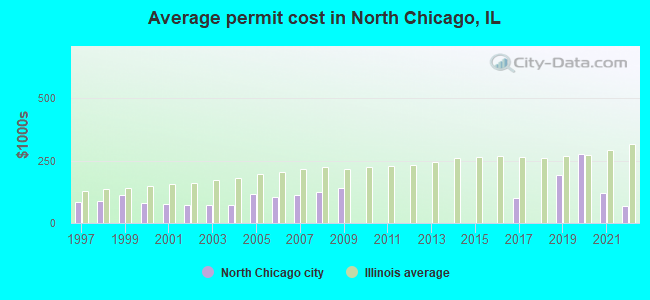
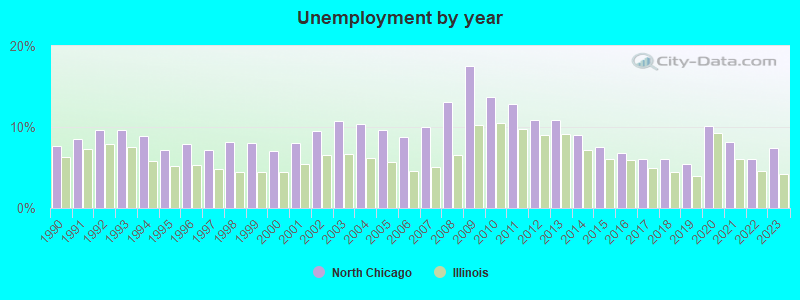
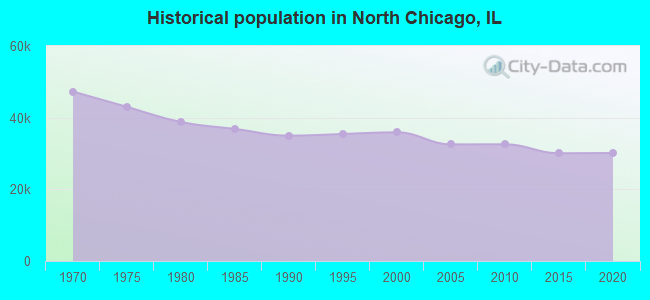
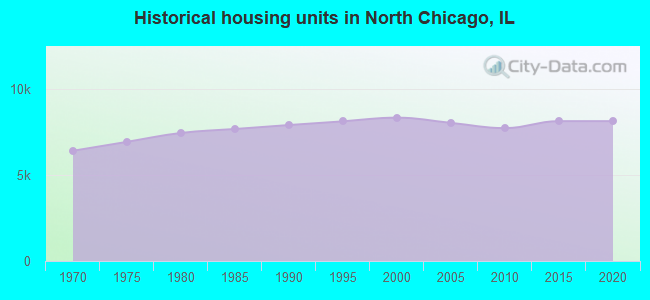
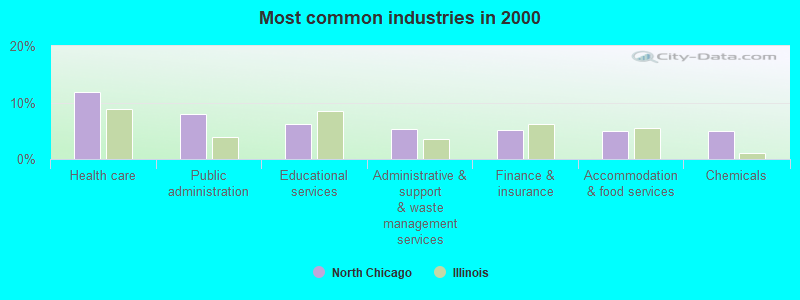
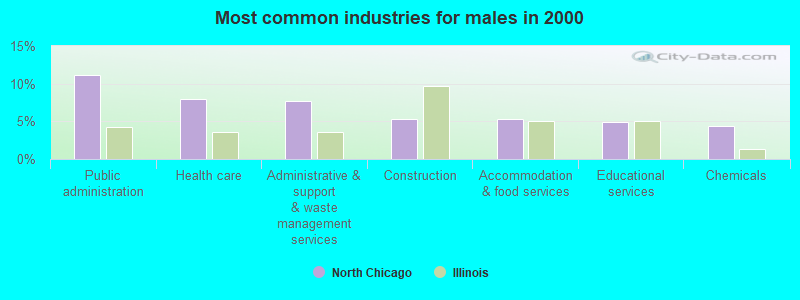
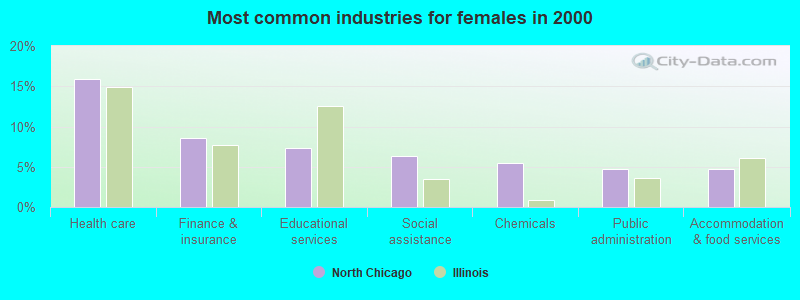
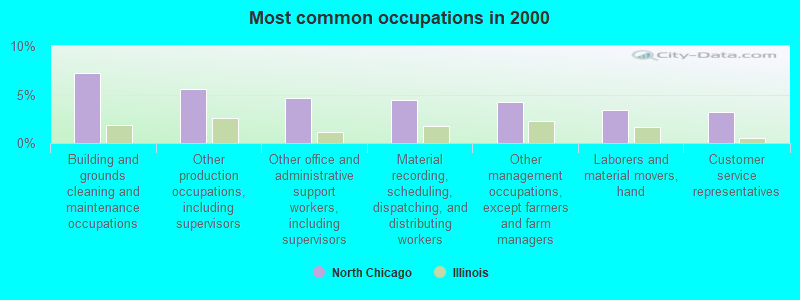
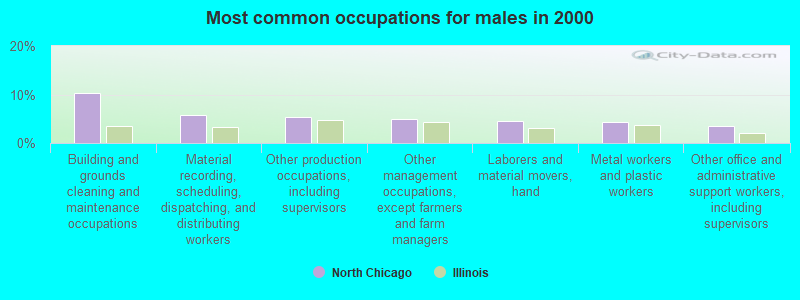
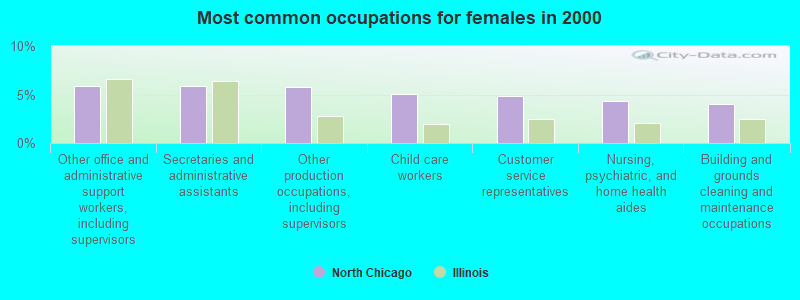
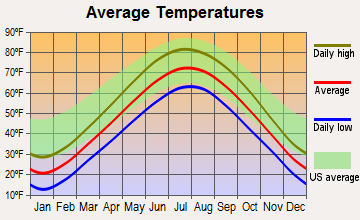
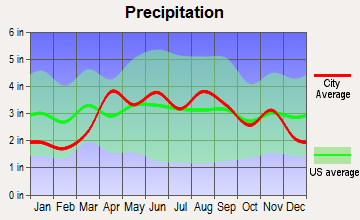
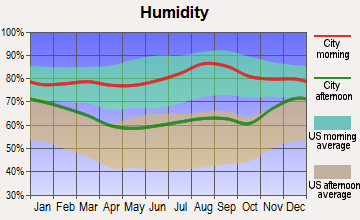
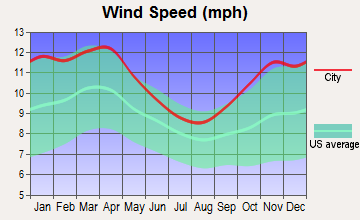
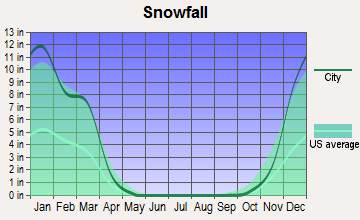
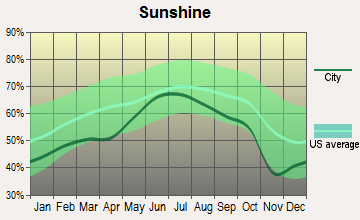
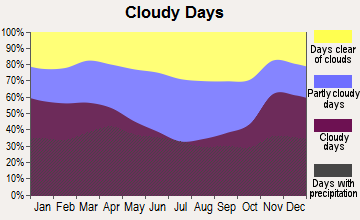


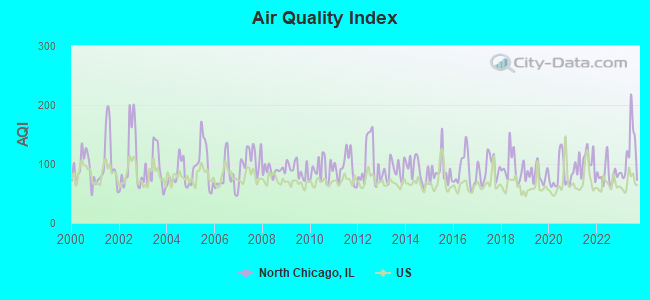
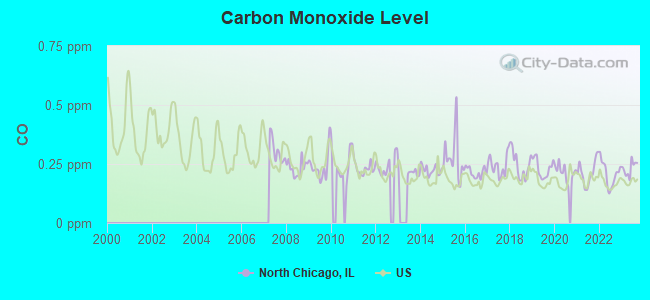
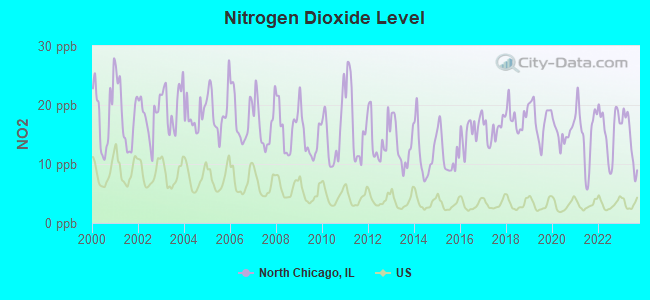
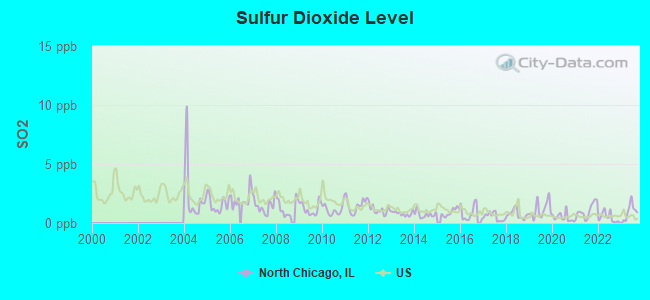
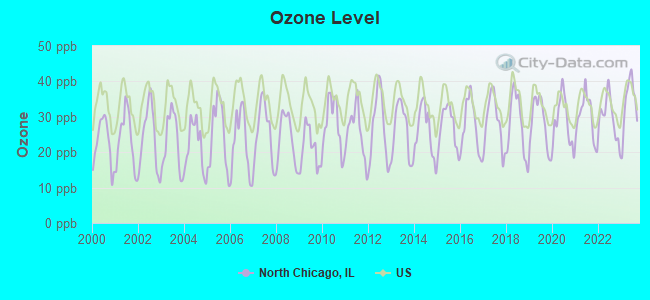
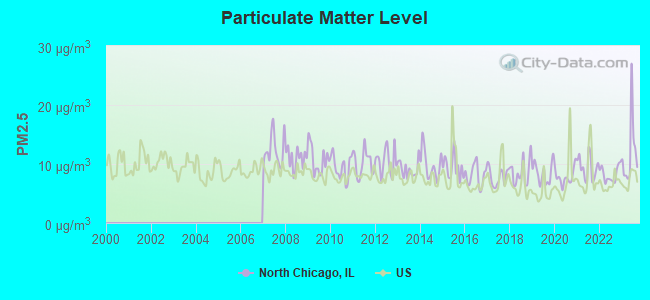
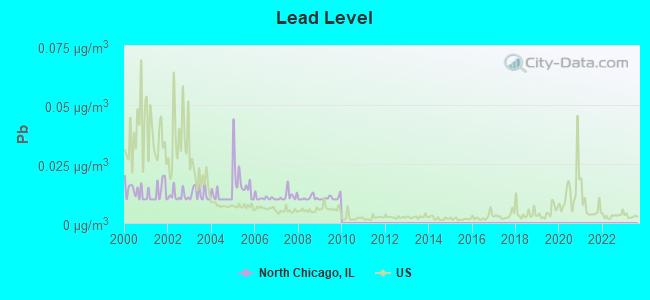
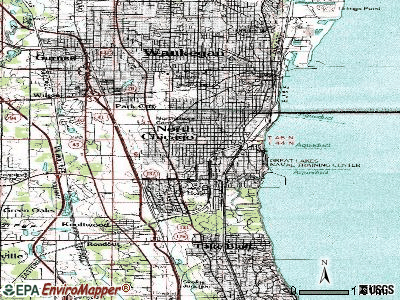
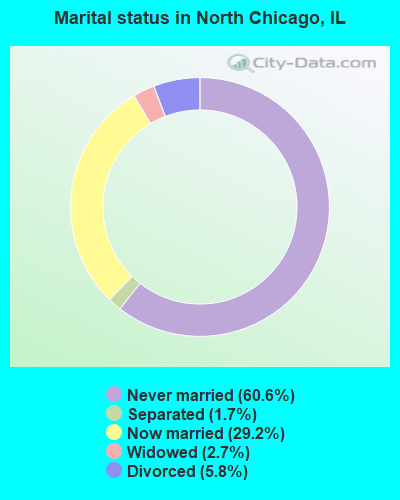
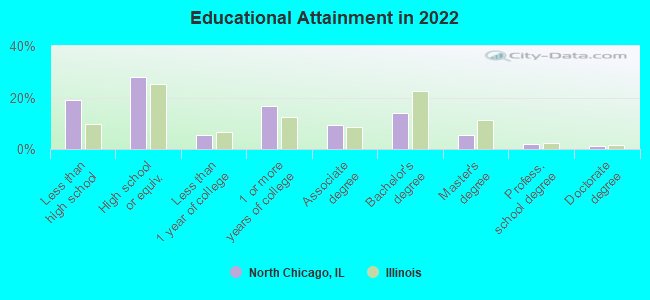
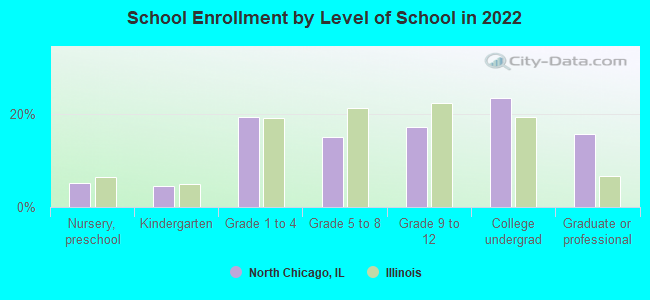
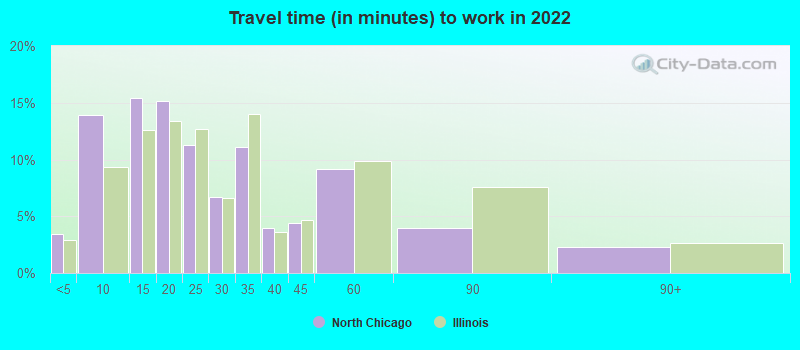
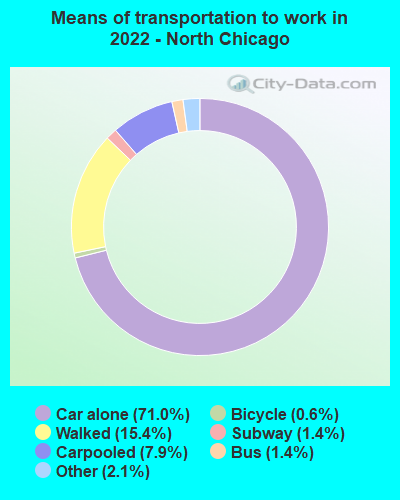
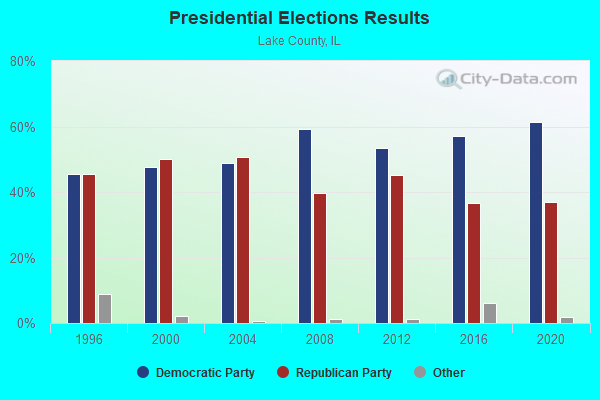
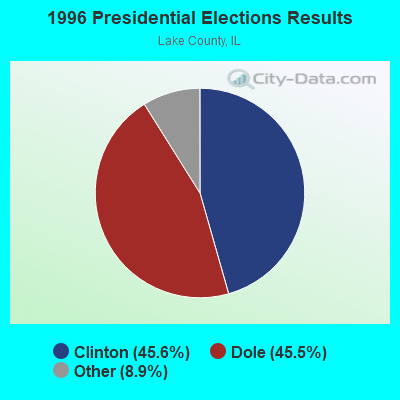
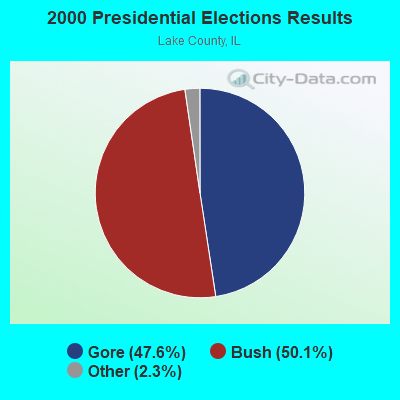
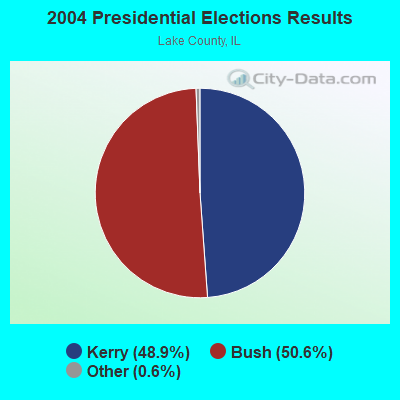
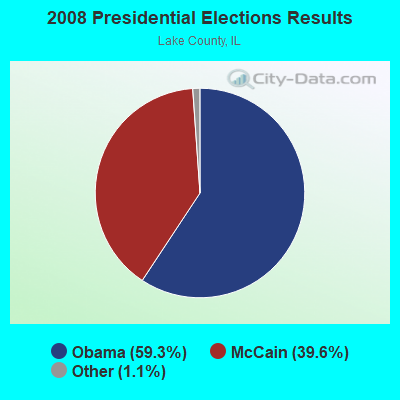
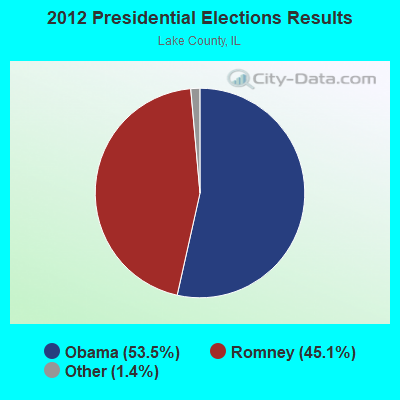
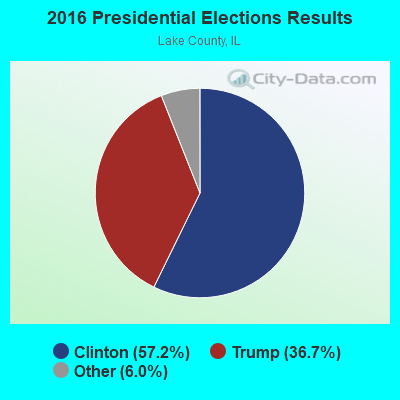
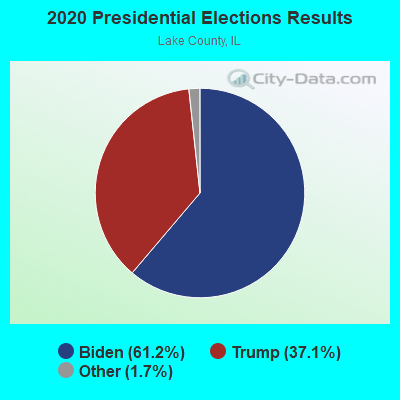

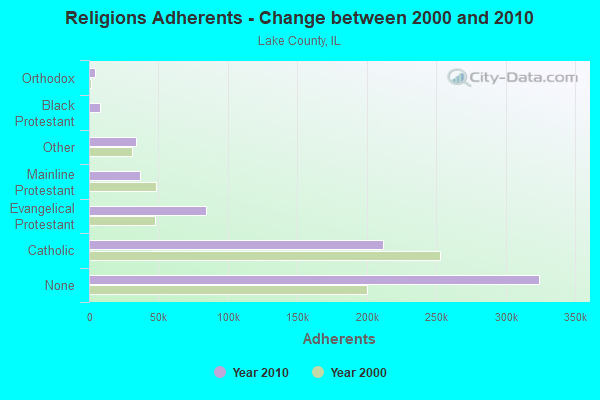
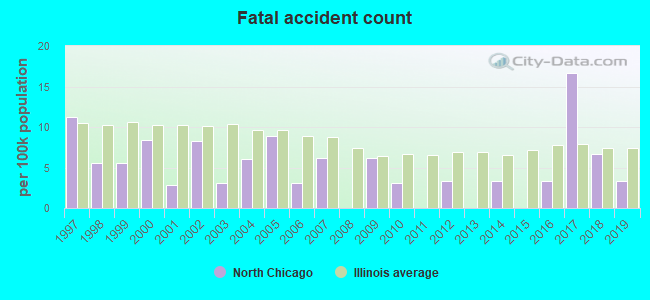
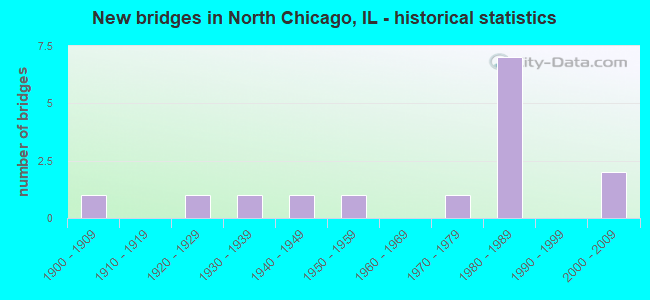
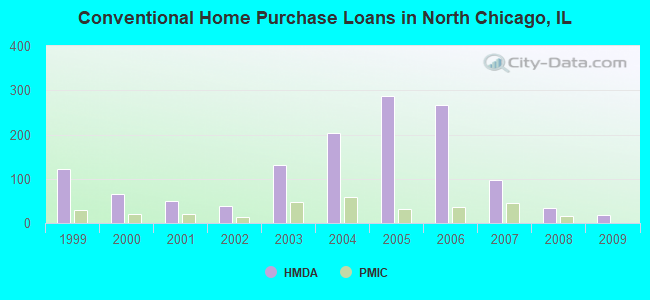
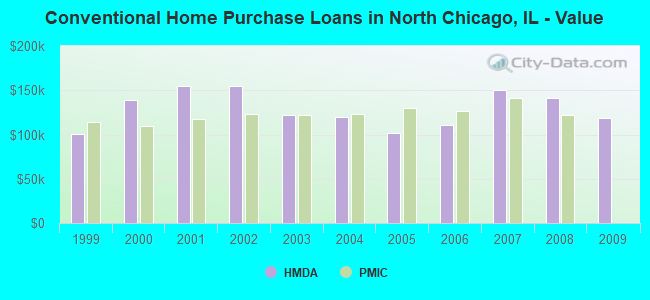
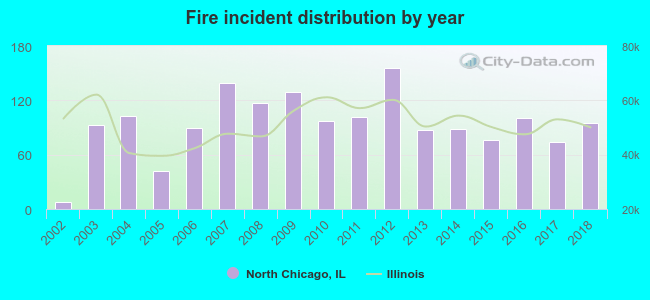 According to the data from the years 2002 - 2018 the average number of fire incidents per year is 94. The highest number of fire incidents - 156 took place in 2012, and the least - 8 in 2002. The data has a rising trend.
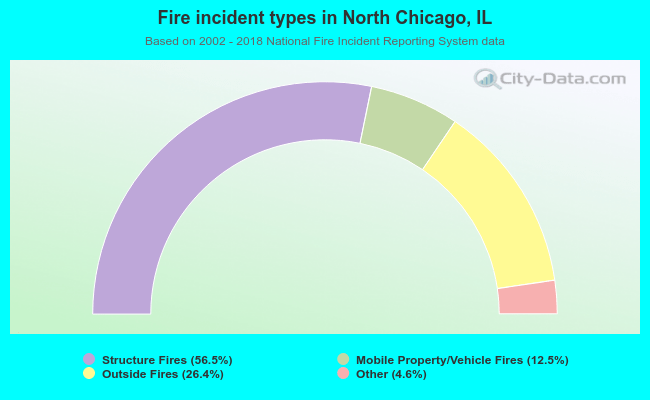 When looking into fire subcategories, the most incidents belonged to: Structure Fires (56.5%), and Outside Fires (26.4%).