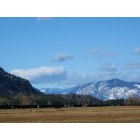
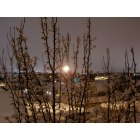
North Ogden, Utah Submit your own pictures of this city and show them to the world
OSM Map
General Map
Google Map
MSN Map
OSM Map
General Map
Google Map
MSN Map
OSM Map
General Map
Google Map
MSN Map
OSM Map
General Map
Google Map
MSN Map
Please wait while loading the map...
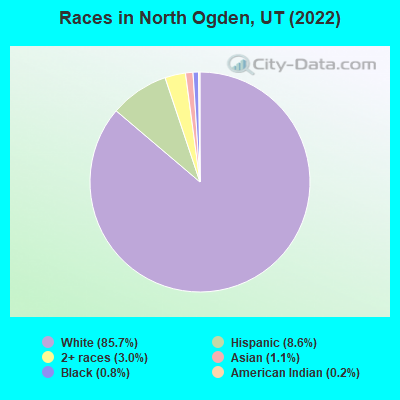
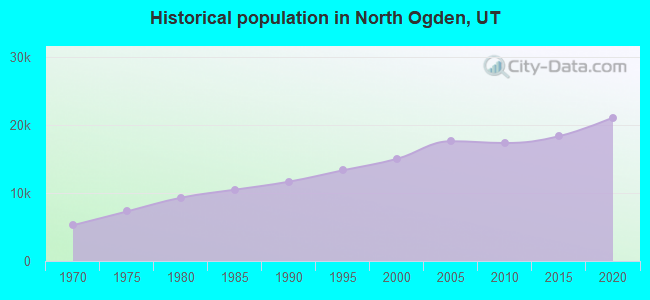
Population in 2022: 21,855 (100% urban, 0% rural). Population change since 2000: +45.4%Males: 10,556 Females: 11,299
March 2022 cost of living index in North Ogden: 88.3 (less than average, U.S. average is 100) Percentage of residents living in poverty in 2022: 6.2%for White Non-Hispanic residents , 11.0% for Black residents , 14.8% for Hispanic or Latino residents , 30.2% for American Indian residents , 100.0% for Native Hawaiian and other Pacific Islander residents , 4.6% for other race residents , 21.4% for two or more races residents )
Profiles of local businesses
Business Search - 14 Million verified businesses
Data:
Median household income ($)
Median household income (% change since 2000)
Household income diversity
Ratio of average income to average house value (%)
Ratio of average income to average rent
Median household income ($) - White
Median household income ($) - Black or African American
Median household income ($) - Asian
Median household income ($) - Hispanic or Latino
Median household income ($) - American Indian and Alaska Native
Median household income ($) - Multirace
Median household income ($) - Other Race
Median household income for houses/condos with a mortgage ($)
Median household income for apartments without a mortgage ($)
Races - White alone (%)
Races - White alone (% change since 2000)
Races - Black alone (%)
Races - Black alone (% change since 2000)
Races - American Indian alone (%)
Races - American Indian alone (% change since 2000)
Races - Asian alone (%)
Races - Asian alone (% change since 2000)
Races - Hispanic (%)
Races - Hispanic (% change since 2000)
Races - Native Hawaiian and Other Pacific Islander alone (%)
Races - Native Hawaiian and Other Pacific Islander alone (% change since 2000)
Races - Two or more races (%)
Races - Two or more races (% change since 2000)
Races - Other race alone (%)
Races - Other race alone (% change since 2000)
Racial diversity
Unemployment (%)
Unemployment (% change since 2000)
Unemployment (%) - White
Unemployment (%) - Black or African American
Unemployment (%) - Asian
Unemployment (%) - Hispanic or Latino
Unemployment (%) - American Indian and Alaska Native
Unemployment (%) - Multirace
Unemployment (%) - Other Race
Population density (people per square mile)
Population - Males (%)
Population - Females (%)
Population - Males (%) - White
Population - Males (%) - Black or African American
Population - Males (%) - Asian
Population - Males (%) - Hispanic or Latino
Population - Males (%) - American Indian and Alaska Native
Population - Males (%) - Multirace
Population - Males (%) - Other Race
Population - Females (%) - White
Population - Females (%) - Black or African American
Population - Females (%) - Asian
Population - Females (%) - Hispanic or Latino
Population - Females (%) - American Indian and Alaska Native
Population - Females (%) - Multirace
Population - Females (%) - Other Race
Coronavirus confirmed cases (Apr 25, 2024)
Deaths caused by coronavirus (Apr 25, 2024)
Coronavirus confirmed cases (per 100k population) (Apr 25, 2024)
Deaths caused by coronavirus (per 100k population) (Apr 25, 2024)
Daily increase in number of cases (Apr 25, 2024)
Weekly increase in number of cases (Apr 25, 2024)
Cases doubled (in days) (Apr 25, 2024)
Hospitalized patients (Apr 18, 2022)
Negative test results (Apr 18, 2022)
Total test results (Apr 18, 2022)
COVID Vaccine doses distributed (per 100k population) (Sep 19, 2023)
COVID Vaccine doses administered (per 100k population) (Sep 19, 2023)
COVID Vaccine doses distributed (Sep 19, 2023)
COVID Vaccine doses administered (Sep 19, 2023)
Likely homosexual households (%)
Likely homosexual households (% change since 2000)
Likely homosexual households - Lesbian couples (%)
Likely homosexual households - Lesbian couples (% change since 2000)
Likely homosexual households - Gay men (%)
Likely homosexual households - Gay men (% change since 2000)
Cost of living index
Median gross rent ($)
Median contract rent ($)
Median monthly housing costs ($)
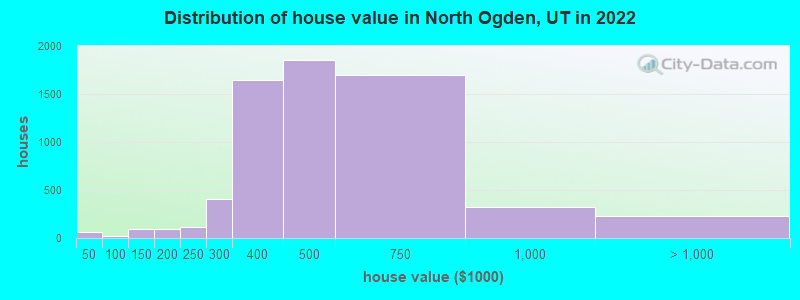
Median house or condo value ($)
Median house or condo value ($ change since 2000)
Mean house or condo value by units in structure - 1, detached ($)
Mean house or condo value by units in structure - 1, attached ($)
Mean house or condo value by units in structure - 2 ($)
Mean house or condo value by units in structure by units in structure - 3 or 4 ($)
Mean house or condo value by units in structure - 5 or more ($)
Mean house or condo value by units in structure - Boat, RV, van, etc. ($)
Mean house or condo value by units in structure - Mobile home ($)
Median house or condo value ($) - White
Median house or condo value ($) - Black or African American
Median house or condo value ($) - Asian
Median house or condo value ($) - Hispanic or Latino
Median house or condo value ($) - American Indian and Alaska Native
Median house or condo value ($) - Multirace
Median house or condo value ($) - Other Race
Median resident age
Resident age diversity
Median resident age - Males
Median resident age - Females
Median resident age - White
Median resident age - Black or African American
Median resident age - Asian
Median resident age - Hispanic or Latino
Median resident age - American Indian and Alaska Native
Median resident age - Multirace
Median resident age - Other Race
Median resident age - Males - White
Median resident age - Males - Black or African American
Median resident age - Males - Asian
Median resident age - Males - Hispanic or Latino
Median resident age - Males - American Indian and Alaska Native
Median resident age - Males - Multirace
Median resident age - Males - Other Race
Median resident age - Females - White
Median resident age - Females - Black or African American
Median resident age - Females - Asian
Median resident age - Females - Hispanic or Latino
Median resident age - Females - American Indian and Alaska Native
Median resident age - Females - Multirace
Median resident age - Females - Other Race
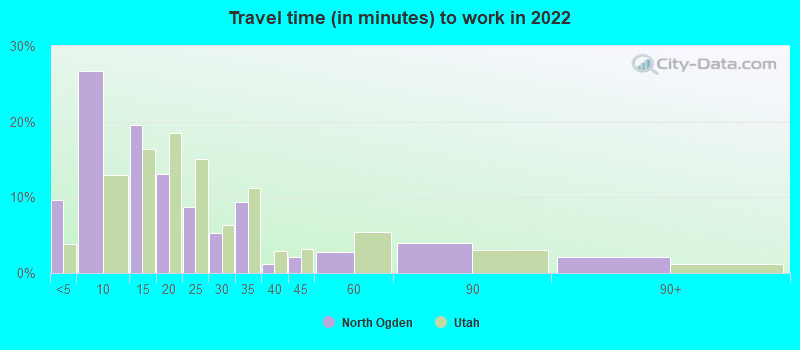
Commute - mean travel time to work (minutes)
Travel time to work - Less than 5 minutes (%)
Travel time to work - Less than 5 minutes (% change since 2000)
Travel time to work - 5 to 9 minutes (%)
Travel time to work - 5 to 9 minutes (% change since 2000)
Travel time to work - 10 to 19 minutes (%)
Travel time to work - 10 to 19 minutes (% change since 2000)
Travel time to work - 20 to 29 minutes (%)
Travel time to work - 20 to 29 minutes (% change since 2000)
Travel time to work - 30 to 39 minutes (%)
Travel time to work - 30 to 39 minutes (% change since 2000)
Travel time to work - 40 to 59 minutes (%)
Travel time to work - 40 to 59 minutes (% change since 2000)
Travel time to work - 60 to 89 minutes (%)
Travel time to work - 60 to 89 minutes (% change since 2000)
Travel time to work - 90 or more minutes (%)
Travel time to work - 90 or more minutes (% change since 2000)
Marital status - Never married (%)
Marital status - Now married (%)
Marital status - Separated (%)
Marital status - Widowed (%)
Marital status - Divorced (%)
Median family income ($)
Median family income (% change since 2000)
Median non-family income ($)
Median non-family income (% change since 2000)
Median per capita income ($)
Median per capita income (% change since 2000)
Median family income ($) - White
Median family income ($) - Black or African American
Median family income ($) - Asian
Median family income ($) - Hispanic or Latino
Median family income ($) - American Indian and Alaska Native
Median family income ($) - Multirace
Median family income ($) - Other Race
Median year house/condo built
Median year apartment built
Year house built - Built 2005 or later (%)
Year house built - Built 2000 to 2004 (%)
Year house built - Built 1990 to 1999 (%)
Year house built - Built 1980 to 1989 (%)
Year house built - Built 1970 to 1979 (%)
Year house built - Built 1960 to 1969 (%)
Year house built - Built 1950 to 1959 (%)
Year house built - Built 1940 to 1949 (%)
Year house built - Built 1939 or earlier (%)
Average household size
Household density (households per square mile)
Average household size - White
Average household size - Black or African American
Average household size - Asian
Average household size - Hispanic or Latino
Average household size - American Indian and Alaska Native
Average household size - Multirace
Average household size - Other Race
Occupied housing units (%)
Vacant housing units (%)
Owner occupied housing units (%)
Renter occupied housing units (%)
Vacancy status - For rent (%)
Vacancy status - For sale only (%)
Vacancy status - Rented or sold, not occupied (%)
Vacancy status - For seasonal, recreational, or occasional use (%)
Vacancy status - For migrant workers (%)
Vacancy status - Other vacant (%)
Residents with income below the poverty level (%)
Residents with income below 50% of the poverty level (%)
Children below poverty level (%)
Poor families by family type - Married-couple family (%)
Poor families by family type - Male, no wife present (%)
Poor families by family type - Female, no husband present (%)
Poverty status for native-born residents (%)
Poverty status for foreign-born residents (%)
Poverty among high school graduates not in families (%)
Poverty among people who did not graduate high school not in families (%)
Residents with income below the poverty level (%) - White
Residents with income below the poverty level (%) - Black or African American
Residents with income below the poverty level (%) - Asian
Residents with income below the poverty level (%) - Hispanic or Latino
Residents with income below the poverty level (%) - American Indian and Alaska Native
Residents with income below the poverty level (%) - Multirace
Residents with income below the poverty level (%) - Other Race
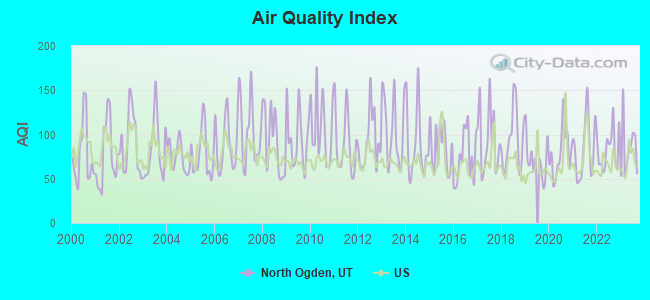
Air pollution - Air Quality Index (AQI)
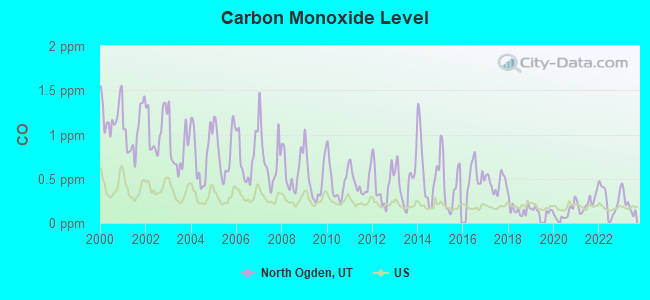
Air pollution - CO
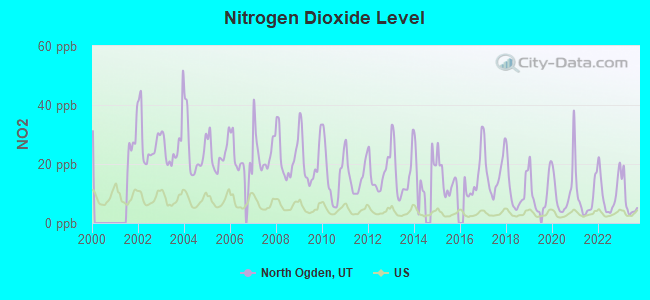
Air pollution - NO2
Air pollution - SO2
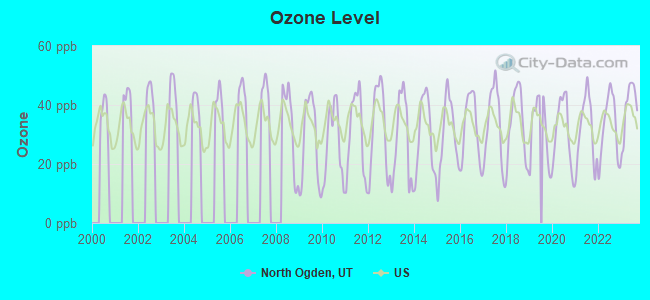
Air pollution - Ozone
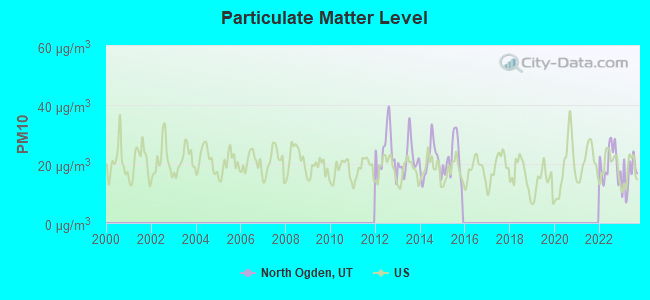
Air pollution - PM10
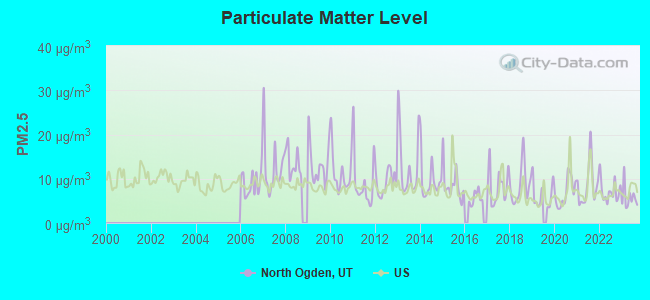
Air pollution - PM25
Air pollution - Pb
Crime - Murders per 100,000 population
Crime - Rapes per 100,000 population
Crime - Robberies per 100,000 population
Crime - Assaults per 100,000 population
Crime - Burglaries per 100,000 population
Crime - Thefts per 100,000 population
Crime - Auto thefts per 100,000 population
Crime - Arson per 100,000 population
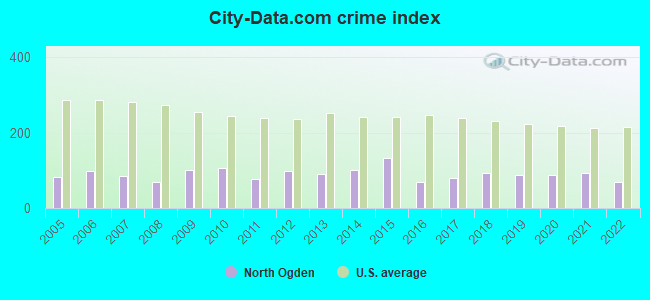
Crime - City-data.com crime index
Crime - Violent crime index
Crime - Property crime index
Crime - Murders per 100,000 population (5 year average)
Crime - Rapes per 100,000 population (5 year average)
Crime - Robberies per 100,000 population (5 year average)
Crime - Assaults per 100,000 population (5 year average)
Crime - Burglaries per 100,000 population (5 year average)
Crime - Thefts per 100,000 population (5 year average)
Crime - Auto thefts per 100,000 population (5 year average)
Crime - Arson per 100,000 population (5 year average)
Crime - City-data.com crime index (5 year average)
Crime - Violent crime index (5 year average)
Crime - Property crime index (5 year average)
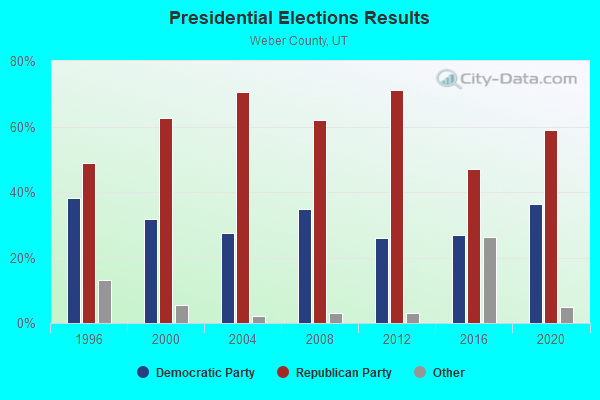
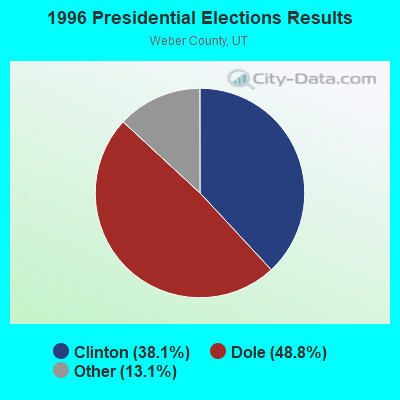
1996 Presidential Elections Results (%) - Democratic Party (Clinton)
1996 Presidential Elections Results (%) - Republican Party (Dole)
1996 Presidential Elections Results (%) - Other
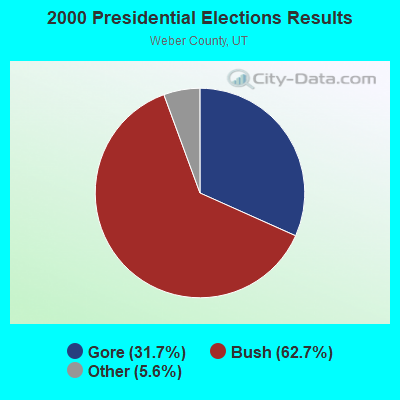
2000 Presidential Elections Results (%) - Democratic Party (Gore)
2000 Presidential Elections Results (%) - Republican Party (Bush)
2000 Presidential Elections Results (%) - Other
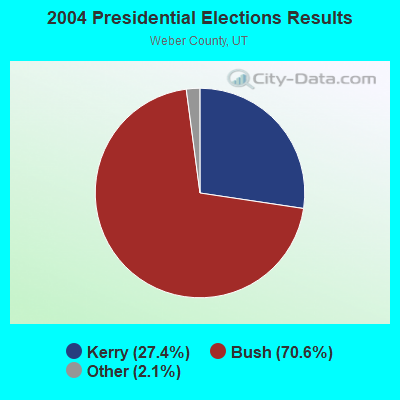
2004 Presidential Elections Results (%) - Democratic Party (Kerry)
2004 Presidential Elections Results (%) - Republican Party (Bush)
2004 Presidential Elections Results (%) - Other
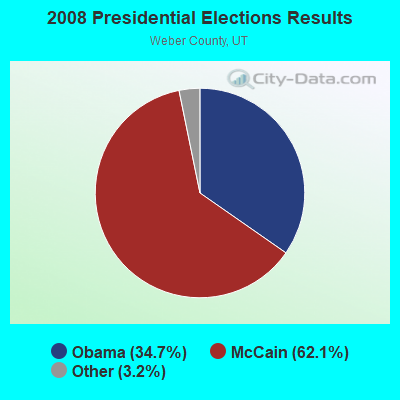
2008 Presidential Elections Results (%) - Democratic Party (Obama)
2008 Presidential Elections Results (%) - Republican Party (McCain)
2008 Presidential Elections Results (%) - Other
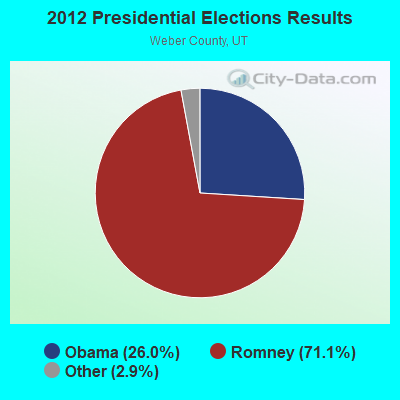
2012 Presidential Elections Results (%) - Democratic Party (Obama)
2012 Presidential Elections Results (%) - Republican Party (Romney)
2012 Presidential Elections Results (%) - Other
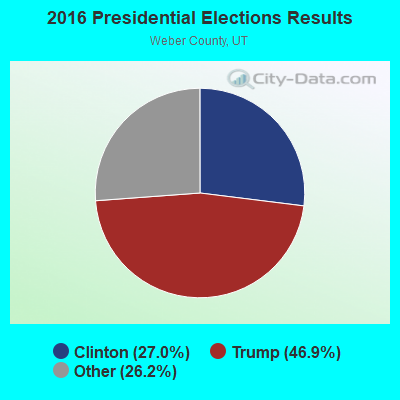
2016 Presidential Elections Results (%) - Democratic Party (Clinton)
2016 Presidential Elections Results (%) - Republican Party (Trump)
2016 Presidential Elections Results (%) - Other
2020 Presidential Elections Results (%) - Democratic Party (Biden)
2020 Presidential Elections Results (%) - Republican Party (Trump)
2020 Presidential Elections Results (%) - Other
Ancestries Reported - Arab (%)
Ancestries Reported - Czech (%)
Ancestries Reported - Danish (%)
Ancestries Reported - Dutch (%)
Ancestries Reported - English (%)
Ancestries Reported - French (%)
Ancestries Reported - French Canadian (%)
Ancestries Reported - German (%)
Ancestries Reported - Greek (%)
Ancestries Reported - Hungarian (%)
Ancestries Reported - Irish (%)
Ancestries Reported - Italian (%)
Ancestries Reported - Lithuanian (%)
Ancestries Reported - Norwegian (%)
Ancestries Reported - Polish (%)
Ancestries Reported - Portuguese (%)
Ancestries Reported - Russian (%)
Ancestries Reported - Scotch-Irish (%)
Ancestries Reported - Scottish (%)
Ancestries Reported - Slovak (%)
Ancestries Reported - Subsaharan African (%)
Ancestries Reported - Swedish (%)
Ancestries Reported - Swiss (%)
Ancestries Reported - Ukrainian (%)
Ancestries Reported - United States (%)
Ancestries Reported - Welsh (%)
Ancestries Reported - West Indian (%)
Ancestries Reported - Other (%)
Educational Attainment - No schooling completed (%)
Educational Attainment - Less than high school (%)
Educational Attainment - High school or equivalent (%)
Educational Attainment - Less than 1 year of college (%)
Educational Attainment - 1 or more years of college (%)
Educational Attainment - Associate degree (%)
Educational Attainment - Bachelor's degree (%)
Educational Attainment - Master's degree (%)
Educational Attainment - Professional school degree (%)
Educational Attainment - Doctorate degree (%)
School Enrollment - Nursery, preschool (%)
School Enrollment - Kindergarten (%)
School Enrollment - Grade 1 to 4 (%)
School Enrollment - Grade 5 to 8 (%)
School Enrollment - Grade 9 to 12 (%)
School Enrollment - College undergrad (%)
School Enrollment - Graduate or professional (%)
School Enrollment - Not enrolled in school (%)
School enrollment - Public schools (%)
School enrollment - Private schools (%)
School enrollment - Not enrolled (%)
Median number of rooms in houses and condos
Median number of rooms in apartments
Housing units lacking complete plumbing facilities (%)
Housing units lacking complete kitchen facilities (%)
Density of houses
Urban houses (%)
Rural houses (%)
Households with people 60 years and over (%)
Households with people 65 years and over (%)
Households with people 75 years and over (%)
Households with one or more nonrelatives (%)
Households with no nonrelatives (%)
Population in households (%)
Family households (%)
Nonfamily households (%)
Population in families (%)
Family households with own children (%)
Median number of bedrooms in owner occupied houses
Mean number of bedrooms in owner occupied houses
Median number of bedrooms in renter occupied houses
Mean number of bedrooms in renter occupied houses
Median number of vehichles in owner occupied houses
Mean number of vehichles in owner occupied houses
Median number of vehichles in renter occupied houses
Mean number of vehichles in renter occupied houses
Mortgage status - with mortgage (%)
Mortgage status - with second mortgage (%)
Mortgage status - with home equity loan (%)
Mortgage status - with both second mortgage and home equity loan (%)
Mortgage status - without a mortgage (%)
Average family size
Average family size - White
Average family size - Black or African American
Average family size - Asian
Average family size - Hispanic or Latino
Average family size - American Indian and Alaska Native
Average family size - Multirace
Average family size - Other Race
Geographical mobility - Same house 1 year ago (%)
Geographical mobility - Moved within same county (%)
Geographical mobility - Moved from different county within same state (%)
Geographical mobility - Moved from different state (%)
Geographical mobility - Moved from abroad (%)
Place of birth - Born in state of residence (%)
Place of birth - Born in other state (%)
Place of birth - Native, outside of US (%)
Place of birth - Foreign born (%)
Housing units in structures - 1, detached (%)
Housing units in structures - 1, attached (%)
Housing units in structures - 2 (%)
Housing units in structures - 3 or 4 (%)
Housing units in structures - 5 to 9 (%)
Housing units in structures - 10 to 19 (%)
Housing units in structures - 20 to 49 (%)
Housing units in structures - 50 or more (%)
Housing units in structures - Mobile home (%)
Housing units in structures - Boat, RV, van, etc. (%)
House/condo owner moved in on average (years ago)
Renter moved in on average (years ago)
Year householder moved into unit - Moved in 1999 to March 2000 (%)
Year householder moved into unit - Moved in 1995 to 1998 (%)
Year householder moved into unit - Moved in 1990 to 1994 (%)
Year householder moved into unit - Moved in 1980 to 1989 (%)
Year householder moved into unit - Moved in 1970 to 1979 (%)
Year householder moved into unit - Moved in 1969 or earlier (%)
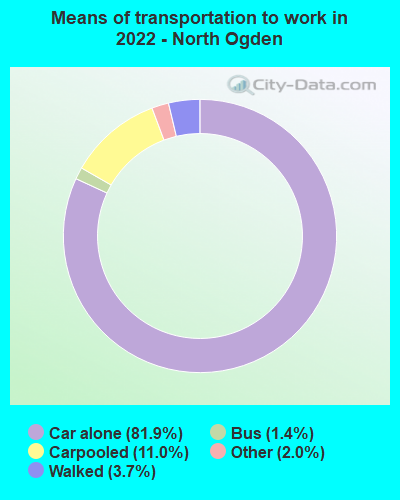
Means of transportation to work - Drove car alone (%)
Means of transportation to work - Carpooled (%)
Means of transportation to work - Public transportation (%)
Means of transportation to work - Bus or trolley bus (%)
Means of transportation to work - Streetcar or trolley car (%)
Means of transportation to work - Subway or elevated (%)
Means of transportation to work - Railroad (%)
Means of transportation to work - Ferryboat (%)
Means of transportation to work - Taxicab (%)
Means of transportation to work - Motorcycle (%)
Means of transportation to work - Bicycle (%)
Means of transportation to work - Walked (%)
Means of transportation to work - Other means (%)
Working at home (%)
Industry diversity
Most Common Industries - Agriculture, forestry, fishing and hunting, and mining (%)
Most Common Industries - Agriculture, forestry, fishing and hunting (%)
Most Common Industries - Mining, quarrying, and oil and gas extraction (%)
Most Common Industries - Construction (%)
Most Common Industries - Manufacturing (%)
Most Common Industries - Wholesale trade (%)
Most Common Industries - Retail trade (%)
Most Common Industries - Transportation and warehousing, and utilities (%)
Most Common Industries - Transportation and warehousing (%)
Most Common Industries - Utilities (%)
Most Common Industries - Information (%)
Most Common Industries - Finance and insurance, and real estate and rental and leasing (%)
Most Common Industries - Finance and insurance (%)
Most Common Industries - Real estate and rental and leasing (%)
Most Common Industries - Professional, scientific, and management, and administrative and waste management services (%)
Most Common Industries - Professional, scientific, and technical services (%)
Most Common Industries - Management of companies and enterprises (%)
Most Common Industries - Administrative and support and waste management services (%)
Most Common Industries - Educational services, and health care and social assistance (%)
Most Common Industries - Educational services (%)
Most Common Industries - Health care and social assistance (%)
Most Common Industries - Arts, entertainment, and recreation, and accommodation and food services (%)
Most Common Industries - Arts, entertainment, and recreation (%)
Most Common Industries - Accommodation and food services (%)
Most Common Industries - Other services, except public administration (%)
Most Common Industries - Public administration (%)
Occupation diversity
Most Common Occupations - Management, business, science, and arts occupations (%)
Most Common Occupations - Management, business, and financial occupations (%)
Most Common Occupations - Management occupations (%)
Most Common Occupations - Business and financial operations occupations (%)
Most Common Occupations - Computer, engineering, and science occupations (%)
Most Common Occupations - Computer and mathematical occupations (%)
Most Common Occupations - Architecture and engineering occupations (%)
Most Common Occupations - Life, physical, and social science occupations (%)
Most Common Occupations - Education, legal, community service, arts, and media occupations (%)
Most Common Occupations - Community and social service occupations (%)
Most Common Occupations - Legal occupations (%)
Most Common Occupations - Education, training, and library occupations (%)
Most Common Occupations - Arts, design, entertainment, sports, and media occupations (%)
Most Common Occupations - Healthcare practitioners and technical occupations (%)
Most Common Occupations - Health diagnosing and treating practitioners and other technical occupations (%)
Most Common Occupations - Health technologists and technicians (%)
Most Common Occupations - Service occupations (%)
Most Common Occupations - Healthcare support occupations (%)
Most Common Occupations - Protective service occupations (%)
Most Common Occupations - Fire fighting and prevention, and other protective service workers including supervisors (%)
Most Common Occupations - Law enforcement workers including supervisors (%)
Most Common Occupations - Food preparation and serving related occupations (%)
Most Common Occupations - Building and grounds cleaning and maintenance occupations (%)
Most Common Occupations - Personal care and service occupations (%)
Most Common Occupations - Sales and office occupations (%)
Most Common Occupations - Sales and related occupations (%)
Most Common Occupations - Office and administrative support occupations (%)
Most Common Occupations - Natural resources, construction, and maintenance occupations (%)
Most Common Occupations - Farming, fishing, and forestry occupations (%)
Most Common Occupations - Construction and extraction occupations (%)
Most Common Occupations - Installation, maintenance, and repair occupations (%)
Most Common Occupations - Production, transportation, and material moving occupations (%)
Most Common Occupations - Production occupations (%)
Most Common Occupations - Transportation occupations (%)
Most Common Occupations - Material moving occupations (%)
People in Group quarters - Institutionalized population (%)
People in Group quarters - Correctional institutions (%)
People in Group quarters - Federal prisons and detention centers (%)
People in Group quarters - Halfway houses (%)
People in Group quarters - Local jails and other confinement facilities (including police lockups) (%)
People in Group quarters - Military disciplinary barracks (%)
People in Group quarters - State prisons (%)
People in Group quarters - Other types of correctional institutions (%)
People in Group quarters - Nursing homes (%)
People in Group quarters - Hospitals/wards, hospices, and schools for the handicapped (%)
People in Group quarters - Hospitals/wards and hospices for chronically ill (%)
People in Group quarters - Hospices or homes for chronically ill (%)
People in Group quarters - Military hospitals or wards for chronically ill (%)
People in Group quarters - Other hospitals or wards for chronically ill (%)
People in Group quarters - Hospitals or wards for drug/alcohol abuse (%)
People in Group quarters - Mental (Psychiatric) hospitals or wards (%)
People in Group quarters - Schools, hospitals, or wards for the mentally retarded (%)
People in Group quarters - Schools, hospitals, or wards for the physically handicapped (%)
People in Group quarters - Institutions for the deaf (%)
People in Group quarters - Institutions for the blind (%)
People in Group quarters - Orthopedic wards and institutions for the physically handicapped (%)
People in Group quarters - Wards in general hospitals for patients who have no usual home elsewhere (%)
People in Group quarters - Wards in military hospitals for patients who have no usual home elsewhere (%)
People in Group quarters - Juvenile institutions (%)
People in Group quarters - Long-term care (%)
People in Group quarters - Homes for abused, dependent, and neglected children (%)
People in Group quarters - Residential treatment centers for emotionally disturbed children (%)
People in Group quarters - Training schools for juvenile delinquents (%)
People in Group quarters - Short-term care, detention or diagnostic centers for delinquent children (%)
People in Group quarters - Type of juvenile institution unknown (%)
People in Group quarters - Noninstitutionalized population (%)
People in Group quarters - College dormitories (includes college quarters off campus) (%)
People in Group quarters - Military quarters (%)
People in Group quarters - On base (%)
People in Group quarters - Barracks, unaccompanied personnel housing (UPH), (Enlisted/Officer), ;and similar group living quarters for military personnel (%)
People in Group quarters - Transient quarters for temporary residents (%)
People in Group quarters - Military ships (%)
People in Group quarters - Group homes (%)
People in Group quarters - Homes or halfway houses for drug/alcohol abuse (%)
People in Group quarters - Homes for the mentally ill (%)
People in Group quarters - Homes for the mentally retarded (%)
People in Group quarters - Homes for the physically handicapped (%)
People in Group quarters - Other group homes (%)
People in Group quarters - Religious group quarters (%)
People in Group quarters - Dormitories (%)
People in Group quarters - Agriculture workers' dormitories on farms (%)
People in Group quarters - Job Corps and vocational training facilities (%)
People in Group quarters - Other workers' dormitories (%)
People in Group quarters - Crews of maritime vessels (%)
People in Group quarters - Other nonhousehold living situations (%)
People in Group quarters - Other noninstitutional group quarters (%)
Residents speaking English at home (%)
Residents speaking English at home - Born in the United States (%)
Residents speaking English at home - Native, born elsewhere (%)
Residents speaking English at home - Foreign born (%)
Residents speaking Spanish at home (%)
Residents speaking Spanish at home - Born in the United States (%)
Residents speaking Spanish at home - Native, born elsewhere (%)
Residents speaking Spanish at home - Foreign born (%)
Residents speaking other language at home (%)
Residents speaking other language at home - Born in the United States (%)
Residents speaking other language at home - Native, born elsewhere (%)
Residents speaking other language at home - Foreign born (%)
Class of Workers - Employee of private company (%)
Class of Workers - Self-employed in own incorporated business (%)
Class of Workers - Private not-for-profit wage and salary workers (%)
Class of Workers - Local government workers (%)
Class of Workers - State government workers (%)
Class of Workers - Federal government workers (%)
Class of Workers - Self-employed workers in own not incorporated business and Unpaid family workers (%)
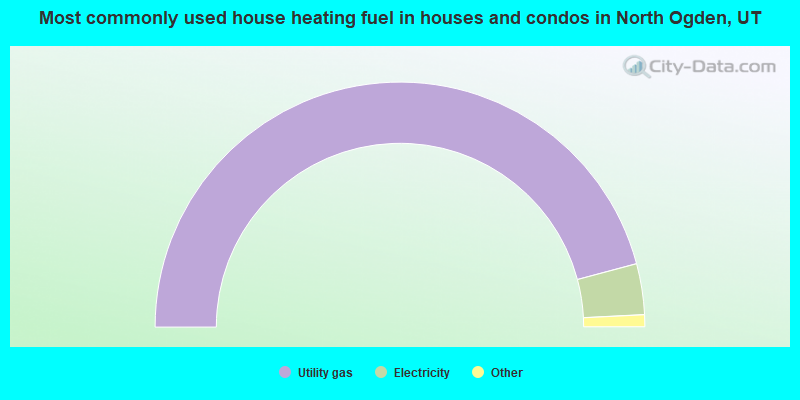
House heating fuel used in houses and condos - Utility gas (%)
House heating fuel used in houses and condos - Bottled, tank, or LP gas (%)
House heating fuel used in houses and condos - Electricity (%)
House heating fuel used in houses and condos - Fuel oil, kerosene, etc. (%)
House heating fuel used in houses and condos - Coal or coke (%)
House heating fuel used in houses and condos - Wood (%)
House heating fuel used in houses and condos - Solar energy (%)
House heating fuel used in houses and condos - Other fuel (%)
House heating fuel used in houses and condos - No fuel used (%)
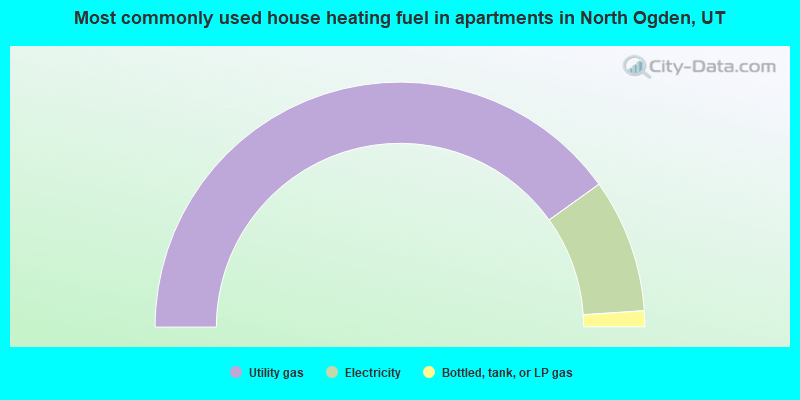
House heating fuel used in apartments - Utility gas (%)
House heating fuel used in apartments - Bottled, tank, or LP gas (%)
House heating fuel used in apartments - Electricity (%)
House heating fuel used in apartments - Fuel oil, kerosene, etc. (%)
House heating fuel used in apartments - Coal or coke (%)
House heating fuel used in apartments - Wood (%)
House heating fuel used in apartments - Solar energy (%)
House heating fuel used in apartments - Other fuel (%)
House heating fuel used in apartments - No fuel used (%)
Armed forces status - In Armed Forces (%)
Armed forces status - Civilian (%)
Armed forces status - Civilian - Veteran (%)
Armed forces status - Civilian - Nonveteran (%)
Fatal accidents locations in years 2005-2021
Fatal accidents locations in 2005
Fatal accidents locations in 2006
Fatal accidents locations in 2007
Fatal accidents locations in 2008
Fatal accidents locations in 2009
Fatal accidents locations in 2010
Fatal accidents locations in 2011
Fatal accidents locations in 2012
Fatal accidents locations in 2013
Fatal accidents locations in 2014
Fatal accidents locations in 2015
Fatal accidents locations in 2016
Fatal accidents locations in 2017
Fatal accidents locations in 2018
Fatal accidents locations in 2019
Fatal accidents locations in 2020
Fatal accidents locations in 2021
Alcohol use - People drinking some alcohol every month (%)
Alcohol use - People not drinking at all (%)
Alcohol use - Average days/month drinking alcohol
Alcohol use - Average drinks/week
Alcohol use - Average days/year people drink much
Audiometry - Average condition of hearing (%)
Audiometry - People that can hear a whisper from across a quiet room (%)
Audiometry - People that can hear normal voice from across a quiet room (%)
Audiometry - Ears ringing, roaring, buzzing (%)
Audiometry - Had a job exposure to loud noise (%)
Audiometry - Had off-work exposure to loud noise (%)
Blood Pressure & Cholesterol - Has high blood pressure (%)
Blood Pressure & Cholesterol - Checking blood pressure at home (%)
Blood Pressure & Cholesterol - Frequently checking blood cholesterol (%)
Blood Pressure & Cholesterol - Has high cholesterol level (%)
Consumer Behavior - Money monthly spent on food at supermarket/grocery store
Consumer Behavior - Money monthly spent on food at other stores
Consumer Behavior - Money monthly spent on eating out
Consumer Behavior - Money monthly spent on carryout/delivered foods
Consumer Behavior - Income spent on food at supermarket/grocery store (%)
Consumer Behavior - Income spent on food at other stores (%)
Consumer Behavior - Income spent on eating out (%)
Consumer Behavior - Income spent on carryout/delivered foods (%)
Current Health Status - General health condition (%)
Current Health Status - Blood donors (%)
Current Health Status - Has blood ever tested for HIV virus (%)
Current Health Status - Left-handed people (%)
Dermatology - People using sunscreen (%)
Diabetes - Diabetics (%)
Diabetes - Had a blood test for high blood sugar (%)
Diabetes - People taking insulin (%)
Diet Behavior & Nutrition - Diet health (%)
Diet Behavior & Nutrition - Milk product consumption (# of products/month)
Diet Behavior & Nutrition - Meals not home prepared (#/week)
Diet Behavior & Nutrition - Meals from fast food or pizza place (#/week)
Diet Behavior & Nutrition - Ready-to-eat foods (#/month)
Diet Behavior & Nutrition - Frozen meals/pizza (#/month)
Drug Use - People that ever used marijuana or hashish (%)
Drug Use - Ever used hard drugs (%)
Drug Use - Ever used any form of cocaine (%)
Drug Use - Ever used heroin (%)
Drug Use - Ever used methamphetamine (%)
Health Insurance - People covered by health insurance (%)
Kidney Conditions-Urology - Avg. # of times urinating at night
Medical Conditions - People with asthma (%)
Medical Conditions - People with anemia (%)
Medical Conditions - People with psoriasis (%)
Medical Conditions - People with overweight (%)
Medical Conditions - Elderly people having difficulties in thinking or remembering (%)
Medical Conditions - People who ever received blood transfusion (%)
Medical Conditions - People having trouble seeing even with glass/contacts (%)
Medical Conditions - People with arthritis (%)
Medical Conditions - People with gout (%)
Medical Conditions - People with congestive heart failure (%)
Medical Conditions - People with coronary heart disease (%)
Medical Conditions - People with angina pectoris (%)
Medical Conditions - People who ever had heart attack (%)
Medical Conditions - People who ever had stroke (%)
Medical Conditions - People with emphysema (%)
Medical Conditions - People with thyroid problem (%)
Medical Conditions - People with chronic bronchitis (%)
Medical Conditions - People with any liver condition (%)
Medical Conditions - People who ever had cancer or malignancy (%)
Mental Health - People who have little interest in doing things (%)
Mental Health - People feeling down, depressed, or hopeless (%)
Mental Health - People who have trouble sleeping or sleeping too much (%)
Mental Health - People feeling tired or having little energy (%)
Mental Health - People with poor appetite or overeating (%)
Mental Health - People feeling bad about themself (%)
Mental Health - People who have trouble concentrating on things (%)
Mental Health - People moving or speaking slowly or too fast (%)
Mental Health - People having thoughts they would be better off dead (%)
Oral Health - Average years since last visit a dentist
Oral Health - People embarrassed because of mouth (%)
Oral Health - People with gum disease (%)
Oral Health - General health of teeth and gums (%)
Oral Health - Average days a week using dental floss/device
Oral Health - Average days a week using mouthwash for dental problem
Oral Health - Average number of teeth
Pesticide Use - Households using pesticides to control insects (%)
Pesticide Use - Households using pesticides to kill weeds (%)
Physical Activity - People doing vigorous-intensity work activities (%)
Physical Activity - People doing moderate-intensity work activities (%)
Physical Activity - People walking or bicycling (%)
Physical Activity - People doing vigorous-intensity recreational activities (%)
Physical Activity - People doing moderate-intensity recreational activities (%)
Physical Activity - Average hours a day doing sedentary activities
Physical Activity - Average hours a day watching TV or videos
Physical Activity - Average hours a day using computer
Physical Functioning - People having limitations keeping them from working (%)
Physical Functioning - People limited in amount of work they can do (%)
Physical Functioning - People that need special equipment to walk (%)
Physical Functioning - People experiencing confusion/memory problems (%)
Physical Functioning - People requiring special healthcare equipment (%)
Prescription Medications - Average number of prescription medicines taking
Preventive Aspirin Use - Adults 40+ taking low-dose aspirin (%)
Reproductive Health - Vaginal deliveries (%)
Reproductive Health - Cesarean deliveries (%)
Reproductive Health - Deliveries resulted in a live birth (%)
Reproductive Health - Pregnancies resulted in a delivery (%)
Reproductive Health - Women breastfeeding newborns (%)
Reproductive Health - Women that had a hysterectomy (%)
Reproductive Health - Women that had both ovaries removed (%)
Reproductive Health - Women that have ever taken birth control pills (%)
Reproductive Health - Women taking birth control pills (%)
Reproductive Health - Women that have ever used Depo-Provera or injectables (%)
Reproductive Health - Women that have ever used female hormones (%)
Sexual Behavior - People 18+ that ever had sex (vaginal, anal, or oral) (%)
Sexual Behavior - Males 18+ that ever had vaginal sex with a woman (%)
Sexual Behavior - Males 18+ that ever performed oral sex on a woman (%)
Sexual Behavior - Males 18+ that ever had anal sex with a woman (%)
Sexual Behavior - Males 18+ that ever had any sex with a man (%)
Sexual Behavior - Females 18+ that ever had vaginal sex with a man (%)
Sexual Behavior - Females 18+ that ever performed oral sex on a man (%)
Sexual Behavior - Females 18+ that ever had anal sex with a man (%)
Sexual Behavior - Females 18+ that ever had any kind of sex with a woman (%)
Sexual Behavior - Average age people first had sex
Sexual Behavior - Average number of female sex partners in lifetime (males 18+)
Sexual Behavior - Average number of female vaginal sex partners in lifetime (males 18+)
Sexual Behavior - Average age people first performed oral sex on a woman (18+)
Sexual Behavior - Average number of woman performed oral sex on in lifetime (18+)
Sexual Behavior - Average number of male sex partners in lifetime (males 18+)
Sexual Behavior - Average number of male anal sex partners in lifetime (males 18+)
Sexual Behavior - Average age people first performed oral sex on a man (18+)
Sexual Behavior - Average number of male oral sex partners in lifetime (18+)
Sexual Behavior - People using protection when performing oral sex (%)
Sexual Behavior - Average number of times people have vaginal or anal sex a year
Sexual Behavior - People having sex without condom (%)
Sexual Behavior - Average number of male sex partners in lifetime (females 18+)
Sexual Behavior - Average number of male vaginal sex partners in lifetime (females 18+)
Sexual Behavior - Average number of female sex partners in lifetime (females 18+)
Sexual Behavior - Circumcised males 18+ (%)
Sleep Disorders - Average hours sleeping at night
Sleep Disorders - People that has trouble sleeping (%)
Smoking-Cigarette Use - People smoking cigarettes (%)
Taste & Smell - People 40+ having problems with smell (%)
Taste & Smell - People 40+ having problems with taste (%)
Taste & Smell - People 40+ that ever had wisdom teeth removed (%)
Taste & Smell - People 40+ that ever had tonsils teeth removed (%)
Taste & Smell - People 40+ that ever had a loss of consciousness because of a head injury (%)
Taste & Smell - People 40+ that ever had a broken nose or other serious injury to face or skull (%)
Taste & Smell - People 40+ that ever had two or more sinus infections (%)
Weight - Average height (inches)
Weight - Average weight (pounds)
Weight - Average BMI
Weight - People that are obese (%)
Weight - People that ever were obese (%)
Weight - People trying to lose weight (%)
According to our research of Utah and other state lists, there were 20 registered sex offenders living in North Ogden, Utah as of April 25, 2024 . The ratio of all residents to sex offenders in North Ogden is 938 to 1.The ratio of registered sex offenders to all residents in this city is much lower than the state average.
Officers per 1,000 residents here:
0.94Utah average:
1.67
Latest news from North Ogden, UT collected exclusively by city-data.com from local newspapers, TV, and radio stations
Ancestries: English (24.1%), Scottish (16.0%), American (7.2%), European (6.4%), German (4.5%), Danish (3.3%).
Current Local Time:
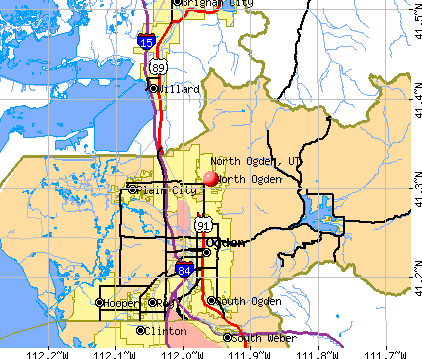
Land area: 6.50 square miles.
Population density: 3,360 people per square mile (average).
570 residents are foreign born (1.6% Latin America , 0.5% Europe , 0.3% Asia ).
Median real estate property taxes paid for housing units with mortgages in 2022: $2,697 (0.5%)Median real estate property taxes paid for housing units with no mortgage in 2022: $2,857 (0.6%)
Nearest city with pop. 50,000+: Ogden, UT
Nearest city with pop. 200,000+: Northeast Jefferson, CO (376.0 miles
Nearest city with pop. 1,000,000+: Phoenix, AZ
Nearest cities:
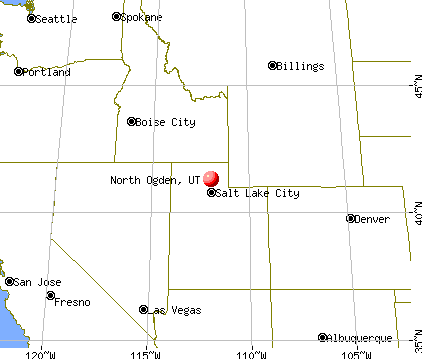
Latitude: 41.31 N, Longitude: 111.96 W
Daytime population change due to commuting: -5,997 (-27.8%)Workers who live and work in this city: 3,208 (29.0%)
Area code commonly used in this area: 801
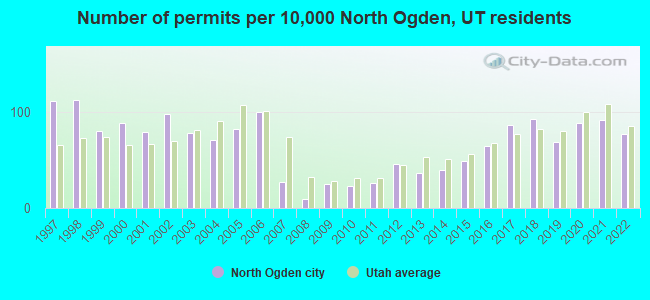
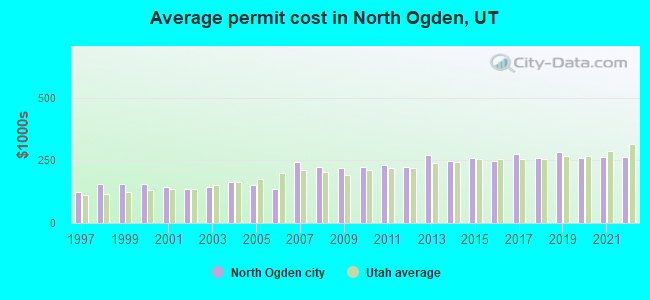
Single-family new house construction building permits:
2022: 116 buildings , average cost: $262,5002021: 138 buildings , average cost: $264,4002020: 133 buildings , average cost: $258,6002019: 103 buildings , average cost: $282,6002018: 140 buildings , average cost: $259,1002017: 130 buildings , average cost: $274,1002016: 97 buildings , average cost: $249,0002015: 74 buildings , average cost: $257,9002014: 60 buildings , average cost: $248,2002013: 55 buildings , average cost: $270,8002012: 69 buildings , average cost: $222,7002011: 39 buildings , average cost: $233,4002010: 34 buildings , average cost: $221,5002009: 38 buildings , average cost: $218,8002008: 14 buildings , average cost: $223,9002007: 41 buildings , average cost: $245,2002006: 151 buildings , average cost: $136,3002005: 125 buildings , average cost: $151,3002004: 106 buildings , average cost: $162,3002003: 117 buildings , average cost: $143,3002002: 147 buildings , average cost: $134,8002001: 119 buildings , average cost: $143,8002000: 134 buildings , average cost: $154,3001999: 122 buildings , average cost: $153,7001998: 170 buildings , average cost: $155,4001997: 168 buildings , average cost: $123,500Unemployment in December 2023:
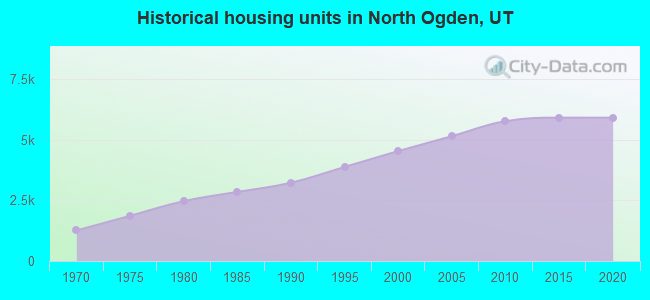
Population change in the 1990s: +3,549 (+30.9%).
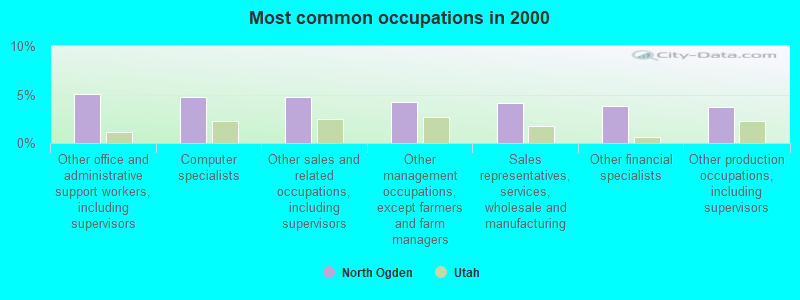
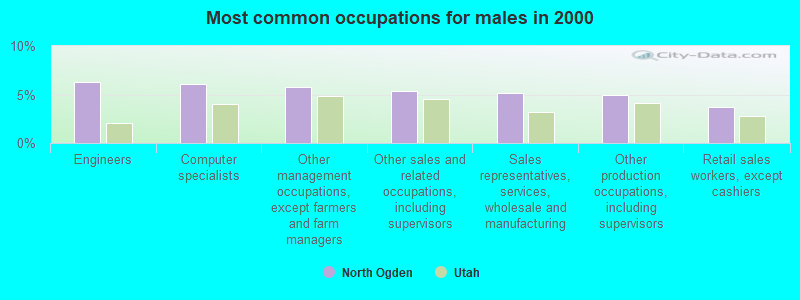
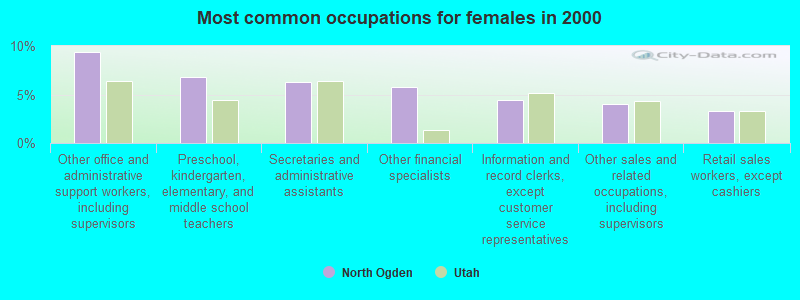
Most common occupations in North Ogden, UT (%)
Both Males Females
Other office and administrative support workers, including supervisors (5.1%)
Computer specialists (4.8%)
Other sales and related occupations, including supervisors (4.7%)
Other management occupations, except farmers and farm managers (4.2%)
Sales representatives, services, wholesale and manufacturing (4.1%)
Other financial specialists (3.9%)
Other production occupations, including supervisors (3.7%)
Engineers (6.3%)
Computer specialists (6.1%)
Other management occupations, except farmers and farm managers (5.7%)
Other sales and related occupations, including supervisors (5.4%)
Sales representatives, services, wholesale and manufacturing (5.2%)
Other production occupations, including supervisors (4.9%)
Retail sales workers, except cashiers (3.7%)
Other office and administrative support workers, including supervisors (9.4%)
Preschool, kindergarten, elementary, and middle school teachers (6.8%)
Secretaries and administrative assistants (6.3%)
Other financial specialists (5.8%)
Information and record clerks, except customer service representatives (4.4%)
Other sales and related occupations, including supervisors (4.0%)
Retail sales workers, except cashiers (3.3%)
Earthquake activity:
North Ogden-area historical earthquake activity is significantly above Utah state average. It is 2083% greater than the overall U.S. average. On 8/18/1959 at 06:37:13, a magnitude 7.7 (7.7 UK, Class: Major, Intensity: VIII - XII) earthquake occurred 234.7 miles away from the city center, causing $26,000,000 total damage On 10/28/1983 at 14:06:06, a magnitude 7.3 (6.2 MB, 7.3 MS, 7.0 MW) earthquake occurred 213.1 miles away from the city center, causing 2 deaths ( 2 shaking deaths) and 3 injuries, causing $15,000,000 total damage On 10/3/1915 at 06:52:48, a magnitude 7.6 (7.6 UK) earthquake occurred 295.0 miles away from the city center On 3/28/1975 at 02:31:05, a magnitude 6.2 (6.1 MB, 6.0 MS, 6.2 ML, Class: Strong, Intensity: VII - IX) earthquake occurred 55.4 miles away from North Ogden center On 3/18/2020 at 13:09:31, a magnitude 5.7 (5.7 MW, Depth: 7.4 mi, Class: Moderate, Intensity: VI - VII) earthquake occurred 39.2 miles away from the city center On 12/21/1932 at 06:10:09, a magnitude 7.2 (7.2 UK) earthquake occurred 378.2 miles away from North Ogden center Magnitude types: body-wave magnitude (MB), local magnitude (ML), surface-wave magnitude (MS), moment magnitude (MW) Natural disasters: The number of natural disasters in Weber County (8) is smaller than the US average (15).Major Disasters (Presidential) Declared: 4Emergencies Declared: 2Floods: 4, Landslides: 2, Storms: 2, Drought: 1, Fire: 1, Heavy Rain: 1, Hurricane: 1, Mudslide: 1, Snow: 1, Other: 1 (Note: some incidents may be assigned to more than one category). Hospitals and medical centers near North Ogden: GEORGE E WAHLEN OGDEN VETERANS HOME (Nursing Home, about 3 miles away; OGDEN, UT)
LOMOND PEAK CARE AND REHAB (Nursing Home, about 3 miles away; OGDEN, UT)
PLEASANT VIEW DIALYSIS CENTER (Dialysis Facility, about 4 miles away; OGDEN, UT)
TRINITY MISSION WIDE HORIZONS RES CARE FACILITY (Hospital, about 5 miles away; OGDEN, UT)
WEBER VALLEY DIALYSIS (DVA) (Dialysis Facility, about 5 miles away; OGDEN, UT)
ASPEN CARE CENTER (Nursing Home, about 6 miles away; OGDEN, UT)
KINDRED NURSING AND REHABILITATION - WASATCH CARE (Nursing Home, about 8 miles away; OGDEN, UT)
Colleges/universities with over 2000 students nearest to North Ogden:
Weber State University (about 9 miles; Ogden, UT ; Full-time enrollment: 17,655)
Utah State University (about 31 miles; Logan, UT ; FT enrollment: 21,131)
Latter-day Saints Business College (about 38 miles; Salt Lake City, UT ; FT enrollment: 2,059)
University of Utah (about 39 miles; Salt Lake City, UT ; FT enrollment: 28,454)
Westminster College (about 41 miles; Salt Lake City, UT ; FT enrollment: 2,870)
Western Governors University (about 44 miles; Salt Lake City, UT ; FT enrollment: 31,481)
Salt Lake Community College (about 45 miles; Salt Lake City, UT ; FT enrollment: 20,797)
Birthplace of: Bill Orton - Politician, Kelsey Nixon - Television chef.
Weber County has a predicted average indoor radon screening level between 2 and 4 pCi/L (pico curies per liter) - Moderate Potential Drinking water stations with addresses in North Ogden that have no violations reported:
SWAN CREEK VILLAGE (Population served: 25, Primary Water Source Type: Groundwater)
Average household size: This city:
3.1 peopleUtah:
3.1 people
Percentage of family households: This city:
83.2%Whole state:
75.2%
Percentage of households with unmarried partners: This city:
2.9%Whole state:
4.6%
Likely homosexual households (counted as self-reported same-sex unmarried-partner households)
Lesbian couples: 0.4% of all households Gay men: 0.1% of all households
8 people in residential treatment centers for juveniles (non-correctional) in 2010people in group homes intended for adults in 2010people in other noninstitutional group quarters in 2000people in nursing homes in 2000
Banks with branches in North Ogden (2011 data):
U.S. Bank National Association: North Ogden Smith's Branch at 2560 North 400 East, branch established on 2009/02/17. Info updated 2012/01/30: Bank assets: $330,470.8 mil, Deposits: $236,091.5 mil, headquarters in Cincinnati, OH, positive income , 3121 total offices , Holding Company: U.S. Bancorp
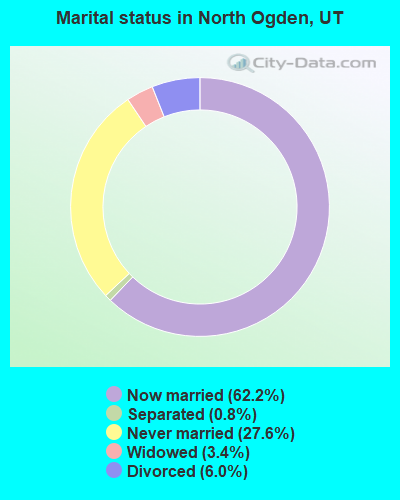
For population 15 years and over in North Ogden:
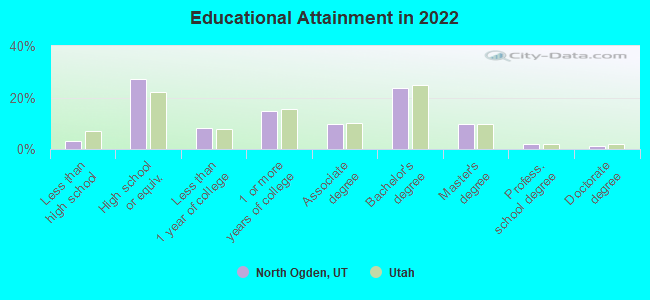
Never married: 27.6%Now married: 62.2%Separated: 0.8%Widowed: 3.4%Divorced: 6.0% For population 25 years and over in North Ogden:
High school or higher: 97.0%Bachelor's degree or higher: 34.7%Graduate or professional degree: 10.7%Unemployed: 5.2%Mean travel time to work (commute): 19.1 minutes
Education Gini index (Inequality in education) Here:
9.5Utah average:
10.9
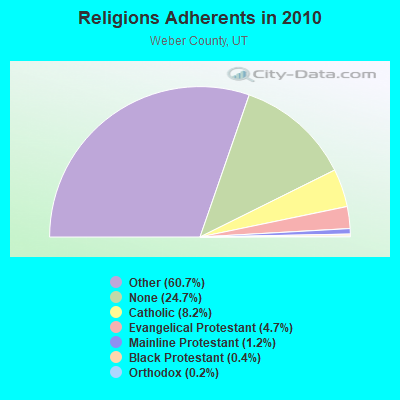
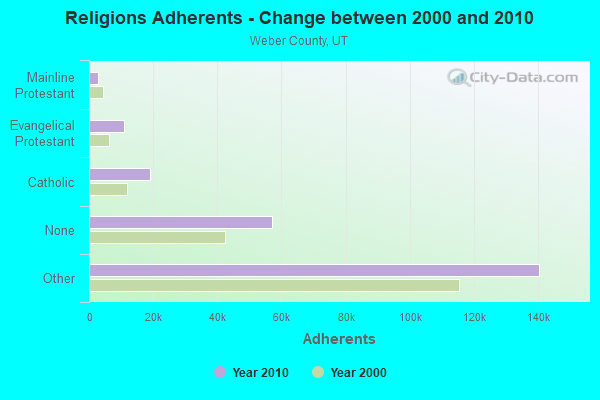
Religion statistics for North Ogden, UT (based on Weber County data)
Religion Adherents Congregations Other 140,427 324 Catholic 18,933 6 Evangelical Protestant 10,761 52 Mainline Protestant 2,761 11 Black Protestant 887 4 Orthodox 350 1 None 57,117 -
Source: Clifford Grammich, Kirk Hadaway, Richard Houseal, Dale E.Jones, Alexei Krindatch, Richie Stanley and Richard H.Taylor. 2012. 2010 U.S.Religion Census: Religious Congregations & Membership Study. Association of Statisticians of American Religious Bodies. Jones, Dale E., et al. 2002. Congregations and Membership in the United States 2000. Nashville, TN: Glenmary Research Center. Graphs represent county-level data
Food Environment Statistics: Number of grocery stores : 30Weber County :
1.35 / 10,000 pop.Utah :
1.37 / 10,000 pop.
Number of supercenters and club stores : 5Weber County :
0.23 / 10,000 pop.Utah :
0.18 / 10,000 pop.
Number of convenience stores (no gas) : 16Weber County :
0.72 / 10,000 pop.Utah :
0.41 / 10,000 pop.
Number of convenience stores (with gas) : 58Weber County :
2.62 / 10,000 pop.Utah :
2.82 / 10,000 pop.
Number of full-service restaurants : 106Weber County :
4.79 / 10,000 pop.State :
5.09 / 10,000 pop.
Adult diabetes rate : This county :
7.1%Utah :
6.3%
Adult obesity rate : Weber County :
25.7%State :
23.6%
Health and Nutrition: Healthy diet rate : North Ogden:
50.6%Utah:
48.9%
Average overall health of teeth and gums : This city:
49.5%Utah:
47.0%
Average BMI : North Ogden:
28.7Utah:
28.4
People feeling badly about themselves : This city:
22.3%Utah:
21.0%
People not drinking alcohol at all : Average hours sleeping at night : Overweight people : North Ogden:
35.2%State:
31.9%
General health condition : Average condition of hearing : North Ogden:
79.8%State:
80.1%
More about Health and Nutrition of North Ogden, UT Residents
Local government employment and payroll (March 2022)
Function
Full-time employees
Monthly full-time payroll
Average yearly full-time wage
Part-time employees
Monthly part-time payroll
Firefighters
21 $117,871 $67,355 10 $12,172 Police Protection - Officers
19 $94,652 $59,780 0 $0 Parks and Recreation
12 $44,241 $44,241 7 $3,578 Streets and Highways
11 $50,843 $55,465 0 $0 Other Government Administration
6 $28,192 $56,384 15 $11,031 Sewerage
5 $17,772 $42,653 0 $0 Other and Unallocable
5 $27,477 $65,945 1 $1,321 Water Supply
5 $25,625 $61,500 0 $0 Police - Other
4 $13,474 $40,422 9 $3,585 Financial Administration
3 $15,841 $63,364 0 $0 Judicial and Legal
1 $3,611 $43,332 1 $1,454 Fire - Other
1 $5,498 $65,976 0 $0
Totals for Government
93 $445,096 $57,432 43 $33,140
North Ogden government finances - Expenditure in 2021 (per resident):
Construction - Regular Highways: $2,720,000 ($124.46)
Parks and Recreation: $35,000 ($1.60)Housing and Community Development: $15,000 ($0.69)Parking Facilities: $1,000 ($0.05)Current Operations - Local Fire Protection: $3,603,000 ($164.86)
Police Protection: $2,215,000 ($101.35)Parks and Recreation: $1,581,000 ($72.34)Sewerage: $1,531,000 ($70.05)General - Other: $1,529,000 ($69.96)Central Staff Services: $1,181,000 ($54.04)Solid Waste Management: $1,105,000 ($50.56)Regular Highways: $987,000 ($45.16)Water Utilities: $858,000 ($39.26)Financial Administration: $367,000 ($16.79)Protective Inspection and Regulation - Other: $249,000 ($11.39)Judicial and Legal Services: $189,000 ($8.65)Health - Other: $97,000 ($4.44)Public Welfare - Other: $59,000 ($2.70)General Public Buildings: $25,000 ($1.14)Transit Utilities: $5,000 ($0.23)General - Interest on Debt: $87,000 ($3.98)
Intergovernmental to Local - Other - Parks and Recreation: $13,000 ($0.59)
Other Capital Outlay - Regular Highways: $1,573,000 ($71.97)
Sewerage: $285,000 ($13.04)Water Utilities: $278,000 ($12.72)Solid Waste Management: $73,000 ($3.34)Central Staff Services: $23,000 ($1.05)Parks and Recreation: $18,000 ($0.82)Local Fire Protection: $15,000 ($0.69)General - Other: $3,000 ($0.14)Total Salaries and Wages: $6,840,000 ($312.97)
North Ogden government finances - Revenue in 2021 (per resident):
Charges - Sewerage: $4,067,000 ($186.09)
Parks and Recreation: $1,393,000 ($63.74)Solid Waste Management: $1,224,000 ($56.01)Regular Highways: $820,000 ($37.52)Other: $493,000 ($22.56)Federal Intergovernmental - Other: $1,157,000 ($52.94)
Local Intergovernmental - Highways: $2,694,000 ($123.27)
Other: $12,000 ($0.55)Miscellaneous - General Revenue - Other: $2,472,000 ($113.11)
Sale of Property: $403,000 ($18.44)Rents: $200,000 ($9.15)Fines and Forfeits: $150,000 ($6.86)Interest Earnings: $86,000 ($3.94)Donations From Private Sources: $8,000 ($0.37)Revenue - Water Utilities: $3,603,000 ($164.86)
State Intergovernmental - Other: $901,000 ($41.23)
General Local Government Support: $61,000 ($2.79)Tax - Property: $5,694,000 ($260.54)
General Sales and Gross Receipts: $4,162,000 ($190.44)Public Utilities Sales: $1,062,000 ($48.59)Other License: $780,000 ($35.69)Occupation and Business License - Other: $31,000 ($1.42)
North Ogden government finances - Debt in 2021 (per resident):
Long Term Debt - Issue, Unspecified Public Purpose: $2,000 ($0.09)
North Ogden government finances - Cash and Securities in 2021 (per resident):
Sinking Funds - Cash and Securities: $701,000 ($32.08)
8.58% of this county's 2021 resident taxpayers lived in other counties in 2020 ($63,347 average adjusted gross income )
Here:
8.58%Utah average:
7.95%
0.06% of residents moved from foreign countries ($419 average AGI )Weber County:
0.06%Utah average:
0.02%
Top counties from which taxpayers relocated into this county between 2020 and 2021:
7.73% of this county's 2020 resident taxpayers moved to other counties in 2021 ($55,300 average adjusted gross income )
Here:
7.73%Utah average:
7.39%
0.04% of residents moved to foreign countries ($368 average AGI )Weber County:
0.04%Utah average:
0.02%
Top counties to which taxpayers relocated from this county between 2020 and 2021:
Businesses in North Ogden, UT
Name Count Name Count
7-Eleven 1 Kroger 1 AutoZone 1 McDonald's 1 Big O Tires 1 Subway 1 Blockbuster 1 UPS 1 Curves 1 Walgreens 1 H&R Block 1
Strongest AM radio stations in North Ogden:
KXOL (1660 AM; 10 kW; BRIGHAM CITY, UT; Owner: SIMMONS-SLC, LS, LLC)
KALL (700 AM; 50 kW; NORTH SALT LAKE CITY, UT; Owner: CITICASTERS LICENSES, L.P.)
KSOS (800 AM; 10 kW; BRIGHAM CITY, UT; Owner: SIMMONS-SLC, LS, LLC)
KIQN (1010 AM; 50 kW; TOOELE, UT)
KSL (1160 AM; 50 kW; SALT LAKE CITY, UT; Owner: BONNEVILLE HOLDING COMPANY)
KYFO (1490 AM; 1 kW; OGDEN, UT; Owner: BIBLE BROADCAST NETWORK)
KANN (1120 AM; 10 kW; ROY, UT; Owner: FAITH COMMUNICATIONS CORPORATION)
KLO (1430 AM; 10 kW; OGDEN, UT; Owner: KLO BROADCASTING CO.)
KVNU (610 AM; 5 kW; LOGAN, UT; Owner: SUN VALLEY RADIO,INC.)
KSVN (730 AM; 1 kW; OGDEN, UT; Owner: AZTECA BROADCASTING CORPORATION)
KTKK (630 AM; 10 kW; SANDY, UT; Owner: UNITED BROADCASTING COMPANY)
KZNS (1280 AM; 10 kW; SALT LAKE CITY, UT; Owner: SIMMONS-SLC, LS, LLC)
KNRS (570 AM; 5 kW; SALT LAKE CITY, UT; Owner: CITICASTERS LICENSES, L.P.)
Strongest FM radio stations in North Ogden:
KYFO-FM (95.5 FM; OGDEN, UT; Owner: BIBLE BROADCASTING NETWORK, INC.)
KCPX (105.7 FM; CENTERVILLE, UT; Owner: MERCURY BROADCASTING COMPANY, INC.)
KUDD (107.9 FM; ROY, UT; Owner: MILLCREEK BROADCASTING, L.L.C.)
KSOP-FM (104.3 FM; SALT LAKE CITY, UT; Owner: KSOP, INC.)
K272DP (102.3 FM; TOOELE, UT; Owner: FAMILY STATIONS, INC.)
KBZN (97.9 FM; OGDEN, UT; Owner: CAPITOL BROADCASTING, INC.)
KRCL (90.9 FM; SALT LAKE CITY, UT; Owner: LISTENERS COMMUNITY RADIO OF UTAH)
KBER (101.1 FM; OGDEN, UT; Owner: CITADEL BROADCASTING COMPANY)
KISN-FM (97.1 FM; SALT LAKE CITY, UT; Owner: CLEAR CHANNEL BROADCASTING LICENSES, INC.)
KKAT (101.9 FM; OGDEN, UT; Owner: CITICASTERS LICENSES, L.P.)
KSFI (100.3 FM; SALT LAKE CITY, UT; Owner: SIMMONS-SLC, LS, LLC)
KUBL-FM (93.3 FM; SALT LAKE CITY, UT; Owner: CITADEL BROADCASTING COMPANY)
KOSY-FM (106.5 FM; SPANISH FORK, UT; Owner: MERCURY BROADCASTING COMPANY, INC.)
KRSP-FM (103.5 FM; SALT LAKE CITY, UT; Owner: SIMMONS-SLC, LS, LLC)
KRAR (106.9 FM; BRIGHAM CITY, UT; Owner: MERCURY BROADCASTING COMPANY, INC.)
KBZN-FM1 (97.9 FM; PARK CITY, UT; Owner: CAPITOL BROADCASTING INC.)
KCUA (92.5 FM; COALVILLE, UT; Owner: COMMUNITY WIRELESS OF PARK CITY, INC)
K201AE (88.1 FM; COALVILLE, ETC., UT; Owner: COMMUNITY WIRELESS OF PARK CITY, INC)
KZHT-FM1 (94.9 FM; PARK CITY, UT; Owner: CITICASTERS LICENSES, L.P.)
KJQN (100.7 FM; BRIGHAM CITY, UT; Owner: SIMMONS-SLC, LS, LLC)
TV broadcast stations around North Ogden:
K59BV (Channel 59; LAVA HOT SPRINGS, ID; Owner: STATE BOARD OF EDUCATION (IEPBS))
KULX-CA (Channel 51; OGDEN, UT; Owner: AIRWAVES, INC.)
KPNZ (Channel 24; OGDEN, UT; Owner: UTAH COMMUNICATIONS, LLC)
KUTV (Channel 2; SALT LAKE CITY, UT; Owner: KUTV HOLDINGS, INC.)
KSVN-CA (Channel 49; OGDEN, UT; Owner: AZTECA BROADCASTING CORPORATION)
K56GR (Channel 56; OGDEN, UT; Owner: TRINITY BROADCASTING NETWORK)
K48EI (Channel 48; HUNTSVILLE, LIBERTY,, UT; Owner: WEBER CTY.-OGDEN VALLEY RECREATION)
K46EB (Channel 46; HUNTSVILLE, ETC., UT; Owner: WEBER CTY.-OGDEN VALLEY RECREATION)
K35GG (Channel 35; HUNTSVILLE, ETC., UT; Owner: UNIVERSITY OF UTAH)
K58FT (Channel 58; HUNTSVILLE, UT; Owner: ALPHA & OMEGA COMMUNICATIONS, L.L.C.)
K50EB (Channel 50; HUNTSVILLE, ETC., UT; Owner: WEBER CTY.-OGDEN VALLEY RECREATION)
K52CS (Channel 52; HUNTSVILLE, ETC., UT; Owner: WEBER CTY.-OGDEN VALLEY RECREATION)
K08DI (Channel 8; HUNTSVILLE, ETC., UT; Owner: OGDEN VALLEY TV REPEATER ASSOCIATION)
K10DT (Channel 10; HUNTSVILLE, ETC., UT; Owner: WEBER CTY.-OGDEN VALLEY RECREATION)
FCC Registered Antenna Towers: 14 (
See the full list of FCC Registered Antenna Towers in North Ogden )
FCC Registered Broadcast Land Mobile Towers: 2
Lat: 41.305833 Lon: -111.968333, Call Sign: WPTK642, Assigned Frequencies: 469.212 MHz, 469.037 MHz, 469.237 MHz, 469.062 MHz, 469.262 MHz, 469.087 MHz, 469.287 MHz, 469.112 MHz, 469.312 MHz, 469.137 MHz... (+21 more), Grant Date: 10/22/2001, Expiration Date: 10/22/2011, Cancellation Date: 12/24/2011, Certifier: John P Finely, Registrant: Fcc License Coordinator Panasonic, 1707 N. Randall Road,El-D3, Elgin, IL 60123-7847, Phone: (847) 468-5318, Fax: (847) 468-4555, Email:
2594 North 400 East (Lat: 41.305639 Lon: -111.968472), Call Sign: WPYR303, Assigned Frequencies: 468.762 MHz, 468.837 MHz, 469.137 MHz, 469.462 MHz, 469.637 MHz, 469.662 MHz, 469.887 MHz, 457.512 MHz, 457.537 MHz, 457.562 MHz, 457.587 MHz, 457.612 MHz, Grant Date: 10/03/2003, Expiration Date: 10/03/2013, Cancellation Date: 12/07/2013, Certifier: Kelly R Zolton, Registrant: Hm Electronics, Inc., 14110 Stowe Drive, Poway, CA 92064, Phone: (858) 535-6015, Fax: (858) 452-7207, Email:
FCC Registered Microwave Towers: 13 (
See the full list of FCC Registered Microwave Towers in this town )
FCC Registered Amateur Radio Licenses: 134 (
See the full list of FCC Registered Amateur Radio Licenses in North Ogden )
FAA Registered Aircraft: 10 (
See the full list of FAA Registered Aircraft in North Ogden )
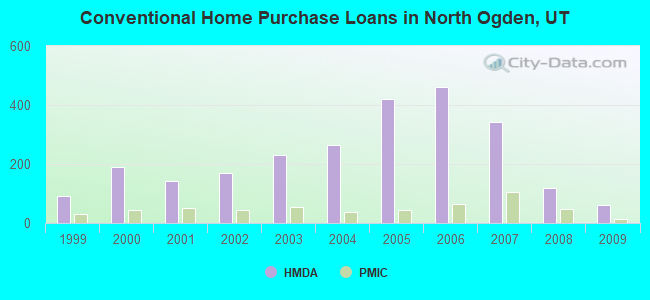
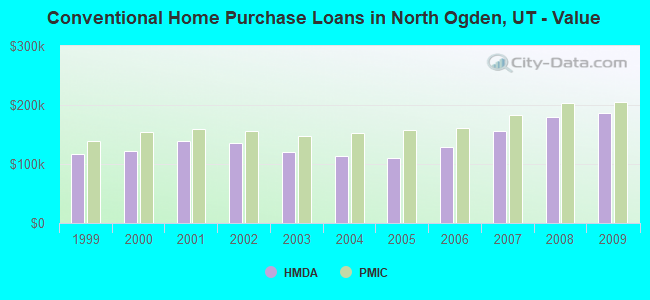
Home Mortgage Disclosure Act Aggregated Statistics For Year 2009(Based on 1 full and 4 partial tracts) A) FHA, FSA/RHS & VA B) Conventional C) Refinancings D) Home Improvement Loans F) Non-occupant Loans on G) Loans On Manufactured Number Average Value Number Average Value Number Average Value Number Average Value Number Average Value Number Average Value
LOANS ORIGINATED 107 $173,771 60 $186,514 764 $169,982 25 $55,269 11 $184,637 4 $66,810 APPLICATIONS APPROVED, NOT ACCEPTED 6 $157,857 6 $233,360 66 $165,450 6 $29,717 2 $142,950 0 $0 APPLICATIONS DENIED 13 $187,907 7 $133,606 165 $186,658 9 $62,987 5 $175,640 0 $0 APPLICATIONS WITHDRAWN 18 $186,383 8 $178,688 93 $172,481 6 $117,290 1 $232,660 0 $0 FILES CLOSED FOR INCOMPLETENESS 2 $158,835 2 $113,810 23 $195,990 1 $12,370 2 $121,105 0 $0
Aggregated Statistics For Year 2008(Based on 1 full and 4 partial tracts) A) FHA, FSA/RHS & VA B) Conventional C) Refinancings D) Home Improvement Loans F) Non-occupant Loans on G) Loans On Manufactured Number Average Value Number Average Value Number Average Value Number Average Value Number Average Value Number Average Value
LOANS ORIGINATED 102 $171,876 117 $178,919 442 $163,954 43 $72,651 29 $157,611 5 $34,614 APPLICATIONS APPROVED, NOT ACCEPTED 5 $164,794 11 $259,480 56 $174,100 10 $82,796 4 $124,155 1 $18,000 APPLICATIONS DENIED 13 $176,215 20 $193,178 134 $184,596 27 $51,921 11 $147,208 3 $28,280 APPLICATIONS WITHDRAWN 15 $156,707 11 $200,581 73 $178,258 5 $141,504 4 $155,832 0 $0 FILES CLOSED FOR INCOMPLETENESS 1 $210,420 3 $178,440 10 $185,271 1 $26,350 1 $85,660 0 $0
Aggregated Statistics For Year 2007(Based on 1 full and 4 partial tracts) A) FHA, FSA/RHS & VA B) Conventional C) Refinancings D) Home Improvement Loans E) Loans on Dwellings For 5+ Families F) Non-occupant Loans on G) Loans On Manufactured Number Average Value Number Average Value Number Average Value Number Average Value Number Average Value Number Average Value Number Average Value
LOANS ORIGINATED 50 $160,259 341 $155,541 430 $150,774 52 $56,384 1 $3,251,310 71 $140,565 2 $108,045 APPLICATIONS APPROVED, NOT ACCEPTED 1 $259,550 26 $145,201 58 $144,877 15 $50,501 0 $0 6 $145,723 2 $30,420 APPLICATIONS DENIED 7 $150,444 68 $173,005 186 $184,223 30 $56,963 0 $0 35 $192,305 3 $35,780 APPLICATIONS WITHDRAWN 7 $161,231 31 $162,180 89 $180,847 7 $118,377 0 $0 10 $153,865 0 $0 FILES CLOSED FOR INCOMPLETENESS 0 $0 4 $363,362 16 $180,948 1 $50,130 0 $0 1 $81,970 0 $0
Aggregated Statistics For Year 2006(Based on 1 full and 4 partial tracts) A) FHA, FSA/RHS & VA B) Conventional C) Refinancings D) Home Improvement Loans E) Loans on Dwellings For 5+ Families F) Non-occupant Loans on G) Loans On Manufactured Number Average Value Number Average Value Number Average Value Number Average Value Number Average Value Number Average Value Number Average Value
LOANS ORIGINATED 52 $148,648 462 $128,939 349 $134,288 53 $52,446 1 $476,450 78 $121,858 2 $111,115 APPLICATIONS APPROVED, NOT ACCEPTED 0 $0 62 $114,028 55 $111,984 13 $45,435 0 $0 23 $94,383 1 $24,150 APPLICATIONS DENIED 4 $125,270 96 $120,425 143 $138,509 27 $46,430 0 $0 25 $105,876 3 $38,063 APPLICATIONS WITHDRAWN 1 $157,350 65 $111,862 97 $139,167 10 $53,156 0 $0 16 $126,307 0 $0 FILES CLOSED FOR INCOMPLETENESS 0 $0 11 $124,235 26 $135,640 1 $125,400 0 $0 2 $118,970 0 $0
Aggregated Statistics For Year 2005(Based on 1 full and 4 partial tracts) A) FHA, FSA/RHS & VA B) Conventional C) Refinancings D) Home Improvement Loans F) Non-occupant Loans on G) Loans On Manufactured Number Average Value Number Average Value Number Average Value Number Average Value Number Average Value Number Average Value
LOANS ORIGINATED 59 $129,567 420 $110,880 401 $124,925 32 $69,235 61 $89,197 2 $27,895 APPLICATIONS APPROVED, NOT ACCEPTED 0 $0 31 $85,765 61 $116,062 9 $52,317 8 $80,309 2 $54,335 APPLICATIONS DENIED 5 $110,990 87 $104,230 149 $119,895 24 $26,564 16 $100,398 3 $31,343 APPLICATIONS WITHDRAWN 4 $115,742 67 $120,404 94 $141,354 9 $181,054 7 $85,617 0 $0 FILES CLOSED FOR INCOMPLETENESS 0 $0 7 $123,353 46 $162,425 5 $26,224 1 $92,960 0 $0
Aggregated Statistics For Year 2004(Based on 1 full and 4 partial tracts) A) FHA, FSA/RHS & VA B) Conventional C) Refinancings D) Home Improvement Loans E) Loans on Dwellings For 5+ Families F) Non-occupant Loans on G) Loans On Manufactured Number Average Value Number Average Value Number Average Value Number Average Value Number Average Value Number Average Value Number Average Value
LOANS ORIGINATED 75 $128,407 264 $113,569 506 $128,605 30 $38,394 1 $392,960 39 $111,589 3 $46,610 APPLICATIONS APPROVED, NOT ACCEPTED 1 $172,860 29 $96,958 85 $136,180 3 $57,650 0 $0 8 $104,044 2 $25,070 APPLICATIONS DENIED 6 $115,360 50 $98,237 178 $137,630 22 $32,250 0 $0 11 $82,951 2 $42,065 APPLICATIONS WITHDRAWN 8 $120,170 38 $102,276 129 $136,140 4 $51,442 0 $0 11 $96,835 0 $0 FILES CLOSED FOR INCOMPLETENESS 1 $199,860 7 $126,189 45 $143,290 3 $72,803 0 $0 1 $169,730 0 $0
Aggregated Statistics For Year 2003(Based on 1 full and 4 partial tracts) A) FHA, FSA/RHS & VA B) Conventional C) Refinancings D) Home Improvement Loans F) Non-occupant Loans on Number Average Value Number Average Value Number Average Value Number Average Value Number Average Value
LOANS ORIGINATED 105 $123,223 232 $120,369 1,166 $125,604 23 $21,823 48 $110,732 APPLICATIONS APPROVED, NOT ACCEPTED 1 $244,670 28 $108,796 95 $113,878 3 $86,473 9 $83,834 APPLICATIONS DENIED 5 $129,238 36 $114,759 191 $131,719 13 $17,816 19 $112,460 APPLICATIONS WITHDRAWN 8 $106,714 35 $129,819 153 $144,107 3 $11,690 11 $123,467 FILES CLOSED FOR INCOMPLETENESS 3 $107,377 6 $74,313 45 $131,330 1 $78,070 2 $84,600
Aggregated Statistics For Year 2002(Based on 1 full and 3 partial tracts) A) FHA, FSA/RHS & VA B) Conventional C) Refinancings D) Home Improvement Loans F) Non-occupant Loans on Number Average Value Number Average Value Number Average Value Number Average Value Number Average Value
LOANS ORIGINATED 64 $128,002 168 $135,441 708 $130,617 29 $28,136 27 $131,956 APPLICATIONS APPROVED, NOT ACCEPTED 3 $173,603 20 $122,897 79 $130,562 5 $43,828 3 $107,310 APPLICATIONS DENIED 5 $140,550 39 $92,083 110 $128,379 20 $17,236 12 $118,578 APPLICATIONS WITHDRAWN 8 $117,381 18 $141,935 132 $143,737 3 $26,830 7 $119,101 FILES CLOSED FOR INCOMPLETENESS 1 $119,500 15 $106,212 44 $124,602 1 $15,000 3 $120,760
Aggregated Statistics For Year 2001(Based on 1 full and 3 partial tracts) A) FHA, FSA/RHS & VA B) Conventional C) Refinancings D) Home Improvement Loans F) Non-occupant Loans on Number Average Value Number Average Value Number Average Value Number Average Value Number Average Value
LOANS ORIGINATED 75 $123,606 143 $138,627 650 $120,628 36 $34,169 24 $120,597 APPLICATIONS APPROVED, NOT ACCEPTED 1 $73,860 12 $140,362 44 $117,125 8 $21,901 3 $111,937 APPLICATIONS DENIED 3 $104,210 46 $92,748 145 $121,131 13 $22,001 3 $136,487 APPLICATIONS WITHDRAWN 3 $108,217 23 $141,957 114 $149,946 3 $21,043 3 $182,673 FILES CLOSED FOR INCOMPLETENESS 1 $157,110 7 $136,521 29 $158,801 1 $49,700 0 $0
Aggregated Statistics For Year 2000(Based on 1 full and 3 partial tracts) A) FHA, FSA/RHS & VA B) Conventional C) Refinancings D) Home Improvement Loans E) Loans on Dwellings For 5+ Families F) Non-occupant Loans on Number Average Value Number Average Value Number Average Value Number Average Value Number Average Value Number Average Value
LOANS ORIGINATED 53 $118,020 191 $121,985 169 $113,493 37 $23,312 1 $111,730 13 $120,381 APPLICATIONS APPROVED, NOT ACCEPTED 1 $93,810 20 $85,307 20 $108,969 8 $23,698 0 $0 0 $0 APPLICATIONS DENIED 6 $121,475 69 $115,199 79 $125,836 11 $20,845 0 $0 1 $258,390 APPLICATIONS WITHDRAWN 2 $81,200 25 $142,015 40 $122,196 5 $60,484 0 $0 0 $0 FILES CLOSED FOR INCOMPLETENESS 0 $0 7 $126,851 34 $129,924 0 $0 0 $0 1 $442,980
Aggregated Statistics For Year 1999(Based on 5 partial tracts) A) FHA, FSA/RHS & VA B) Conventional C) Refinancings D) Home Improvement Loans F) Non-occupant Loans on Number Average Value Number Average Value Number Average Value Number Average Value Number Average Value
LOANS ORIGINATED 48 $104,573 90 $117,031 192 $100,093 19 $20,234 8 $102,559 APPLICATIONS APPROVED, NOT ACCEPTED 1 $96,920 13 $91,829 35 $97,341 6 $16,257 1 $97,190 APPLICATIONS DENIED 5 $102,622 35 $80,831 67 $97,590 8 $19,160 1 $133,770 APPLICATIONS WITHDRAWN 5 $96,364 12 $107,855 43 $115,508 4 $88,050 2 $87,945 FILES CLOSED FOR INCOMPLETENESS 1 $145,560 3 $130,967 25 $121,149 0 $0 1 $72,390
Detailed HMDA statistics for the following Tracts:
2002.01
, 2102.01 , 2102.02 , 2103.01 , 2103.02
Private Mortgage Insurance Companies Aggregated Statistics For Year 2009(Based on 1 full and 4 partial tracts) A) Conventional B) Refinancings Number Average Value Number Average Value
LOANS ORIGINATED 15 $205,831 41 $191,386 APPLICATIONS APPROVED, NOT ACCEPTED 1 $273,550 16 $209,013 APPLICATIONS DENIED 3 $189,040 17 $215,787 APPLICATIONS WITHDRAWN 2 $144,840 13 $203,518 FILES CLOSED FOR INCOMPLETENESS 0 $0 0 $0
Aggregated Statistics For Year 2008(Based on 1 full and 4 partial tracts) A) Conventional B) Refinancings C) Non-occupant Loans on Number Average Value Number Average Value Number Average Value
LOANS ORIGINATED 46 $203,209 40 $209,432 9 $159,321 APPLICATIONS APPROVED, NOT ACCEPTED 13 $208,815 22 $217,069 4 $188,682 APPLICATIONS DENIED 1 $143,530 3 $300,487 0 $0 APPLICATIONS WITHDRAWN 1 $256,080 3 $314,583 0 $0 FILES CLOSED FOR INCOMPLETENESS 1 $230,690 0 $0 0 $0
Aggregated Statistics For Year 2007(Based on 1 full and 4 partial tracts) A) Conventional B) Refinancings C) Non-occupant Loans on Number Average Value Number Average Value Number Average Value
LOANS ORIGINATED 104 $183,649 42 $190,926 13 $166,901 APPLICATIONS APPROVED, NOT ACCEPTED 11 $195,962 12 $260,207 1 $161,450 APPLICATIONS DENIED 2 $280,685 0 $0 0 $0 APPLICATIONS WITHDRAWN 3 $147,983 0 $0 0 $0 FILES CLOSED FOR INCOMPLETENESS 1 $209,670 0 $0 0 $0
Aggregated Statistics For Year 2006(Based on 1 full and 4 partial tracts) A) Conventional B) Refinancings C) Non-occupant Loans on Number Average Value Number Average Value Number Average Value
LOANS ORIGINATED 64 $161,114 24 $168,965 12 $161,679 APPLICATIONS APPROVED, NOT ACCEPTED 13 $207,804 6 $221,440 1 $153,250 APPLICATIONS DENIED 1 $180,320 0 $0 1 $214,880 APPLICATIONS WITHDRAWN 1 $212,960 1 $215,160 0 $0 FILES CLOSED FOR INCOMPLETENESS 0 $0 0 $0 0 $0
Aggregated Statistics For Year 2005(Based on 1 full and 4 partial tracts) A) Conventional B) Refinancings C) Non-occupant Loans on Number Average Value Number Average Value Number Average Value
LOANS ORIGINATED 45 $157,546 37 $162,144 8 $119,850 APPLICATIONS APPROVED, NOT ACCEPTED 7 $170,404 10 $158,542 1 $143,320 APPLICATIONS DENIED 1 $245,000 1 $275,000 0 $0 APPLICATIONS WITHDRAWN 3 $206,153 5 $159,758 0 $0 FILES CLOSED FOR INCOMPLETENESS 0 $0 0 $0 0 $0
Aggregated Statistics For Year 2004(Based on 1 full and 4 partial tracts) A) Conventional B) Refinancings C) Non-occupant Loans on D) Loans On Manufactured Number Average Value Number Average Value Number Average Value Number Average Value
LOANS ORIGINATED 38 $151,887 48 $148,010 5 $105,830 1 $149,610 APPLICATIONS APPROVED, NOT ACCEPTED 4 $164,790 15 $168,012 3 $114,450 0 $0 APPLICATIONS DENIED 1 $150,820 0 $0 0 $0 0 $0 APPLICATIONS WITHDRAWN 1 $150,880 4 $181,808 0 $0 0 $0 FILES CLOSED FOR INCOMPLETENESS 0 $0 0 $0 0 $0 0 $0
Aggregated Statistics For Year 2003(Based on 1 full and 4 partial tracts) A) Conventional B) Refinancings C) Non-occupant Loans on Number Average Value Number Average Value Number Average Value
LOANS ORIGINATED 54 $147,031 146 $145,014 10 $122,219 APPLICATIONS APPROVED, NOT ACCEPTED 5 $150,556 36 $158,499 3 $96,840 APPLICATIONS DENIED 3 $270,403 2 $148,285 1 $344,220 APPLICATIONS WITHDRAWN 2 $181,445 14 $149,443 0 $0 FILES CLOSED FOR INCOMPLETENESS 0 $0 0 $0 0 $0
Aggregated Statistics For Year 2002(Based on 1 full and 3 partial tracts) A) Conventional B) Refinancings C) Non-occupant Loans on Number Average Value Number Average Value Number Average Value
LOANS ORIGINATED 43 $156,109 68 $160,432 6 $128,115 APPLICATIONS APPROVED, NOT ACCEPTED 9 $144,650 16 $154,085 2 $81,320 APPLICATIONS DENIED 0 $0 0 $0 0 $0 APPLICATIONS WITHDRAWN 3 $145,447 5 $171,424 0 $0 FILES CLOSED FOR INCOMPLETENESS 0 $0 0 $0 0 $0
Aggregated Statistics For Year 2001(Based on 1 full and 3 partial tracts) A) Conventional B) Refinancings C) Non-occupant Loans on Number Average Value Number Average Value Number Average Value
LOANS ORIGINATED 50 $159,733 73 $148,416 7 $106,624 APPLICATIONS APPROVED, NOT ACCEPTED 9 $142,857 16 $143,584 2 $170,920 APPLICATIONS DENIED 1 $189,550 2 $181,940 0 $0 APPLICATIONS WITHDRAWN 3 $157,737 4 $150,275 2 $115,050 FILES CLOSED FOR INCOMPLETENESS 0 $0 0 $0 0 $0
Aggregated Statistics For Year 2000(Based on 1 full and 3 partial tracts) A) Conventional B) Refinancings Number Average Value Number Average Value
LOANS ORIGINATED 45 $154,842 20 $146,900 APPLICATIONS APPROVED, NOT ACCEPTED 7 $140,939 6 $150,325 APPLICATIONS DENIED 2 $155,915 1 $215,000 APPLICATIONS WITHDRAWN 1 $164,430 1 $154,960 FILES CLOSED FOR INCOMPLETENESS 0 $0 0 $0
Aggregated Statistics For Year 1999(Based on 5 partial tracts) A) Conventional B) Refinancings C) Non-occupant Loans on Number Average Value Number Average Value Number Average Value
LOANS ORIGINATED 30 $138,188 20 $133,671 1 $105,350 APPLICATIONS APPROVED, NOT ACCEPTED 3 $99,640 5 $139,378 0 $0 APPLICATIONS DENIED 1 $159,660 1 $152,860 0 $0 APPLICATIONS WITHDRAWN 1 $72,870 1 $204,710 0 $0 FILES CLOSED FOR INCOMPLETENESS 0 $0 0 $0 0 $0
Detailed PMIC statistics for the following Tracts:
2002.01
, 2102.01 , 2102.02 , 2103.01 , 2103.02 North Ogden compared to Utah state average:
Unemployed percentage below state average. Foreign-born population percentage below state average. Renting percentage significantly below state average. Length of stay since moving in above state average. Number of rooms per house above state average. Percentage of population with a bachelor's degree or higher above state average.
Top Patent Applicants
Whitt F. Woods (8)
William P. Sampson (7)
Donald Waite (7)
Deloy Lindley (7)
David W. Parkinson (4)
Ed Vannimwegen (4)
Jared K. Olson (4)
Edward G. Van Nimwegen (3)
Patrick Jamison (3)
Patrick Dee Jamison (3)
Total of 117 patent applications in 2008-2024.


 Recent articles from our blog. Our writers, many of them Ph.D. graduates or candidates, create easy-to-read articles on a wide variety of topics.

 (5.7 miles
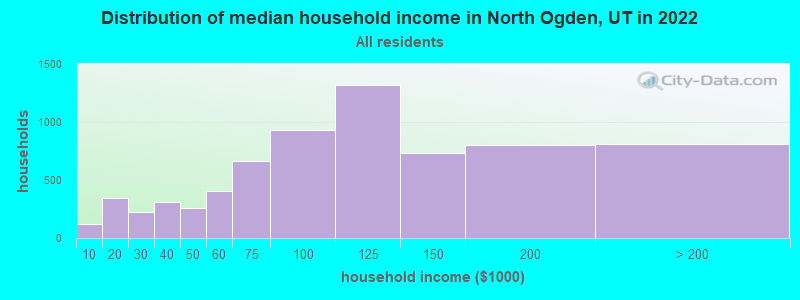


 Based on the data from the years 2002 - 2018 the average number of fires per year is 17. The highest number of reported fires - 33 took place in 2012, and the least - 5 in 2006. The data has a growing trend.
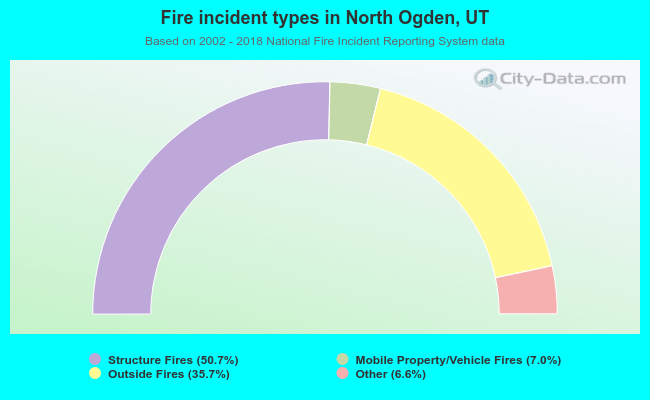 When looking into fire subcategories, the most reports belonged to: Structure Fires (50.7%), and Outside Fires (35.7%).