Plum, Pennsylvania
Submit your own pictures of this borough and show them to the world
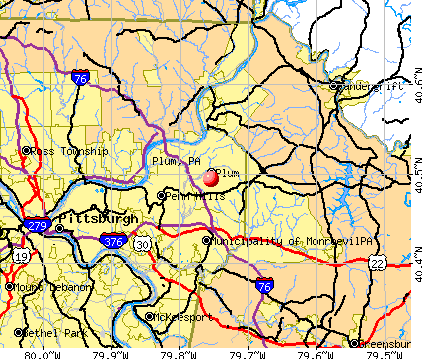
- OSM Map
- General Map
- Google Map
- MSN Map
Population change since 2000: -1.0%
 |
| Males: 13,323 | |
| Females: 13,339 |
| Median resident age: | 44.0 years |
| Pennsylvania median age: | 40.9 years |
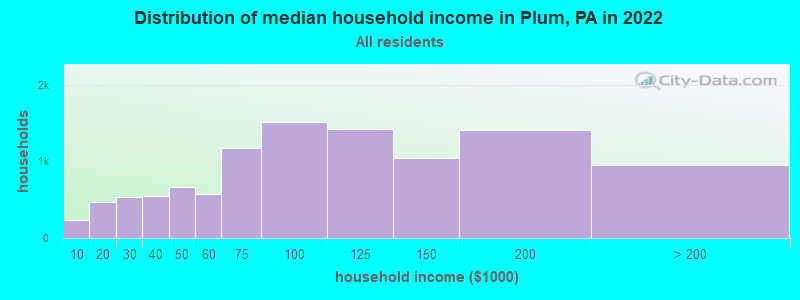
| Plum: | $91,290 |
| PA: | $71,798 |
Estimated per capita income in 2022: $44,627 (it was $20,863 in 2000)
Plum borough income, earnings, and wages data
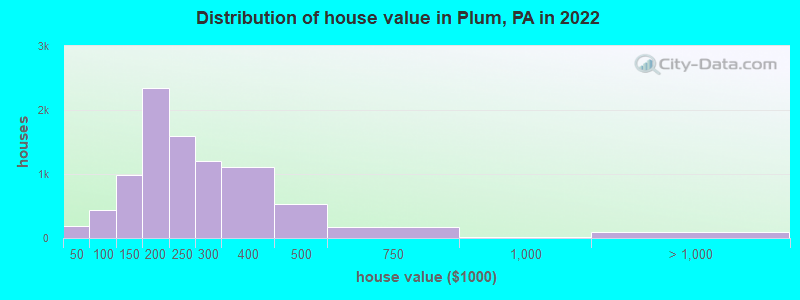
Estimated median house or condo value in 2022: $220,482 (it was $92,900 in 2000)
| Plum: | $220,482 |
| PA: | $245,500 |
Mean prices in 2022: all housing units: $230,219; detached houses: $230,447; townhouses or other attached units: $199,845; in 5-or-more-unit structures: $313,770; mobile homes: $80,065
Median gross rent in 2022: $1,089.
(2.8% for White Non-Hispanic residents, 1.5% for Black residents, 66.8% for other race residents)
Detailed information about poverty and poor residents in Plum, PA
Compare current foreclosures near Plum, PA:
| Photo | Address | Area | Beds / Baths | Price | Details |
|---|---|---|---|---|---|

|
#1
Punta Gorda St
East Mc Keesport, PA 15035
|
1,200 sq. feet
|
1 baths 3 beds |
$178,500
|
show details |

|
#2
Brinwood Ave
Pittsburgh, PA 15227
|
1,000 sq. feet
|
2 baths 3 beds |
$239,900
|
show details |

|
#3
Wedgewood Dr
Pittsburgh, PA 15229
|
835 sq. feet
|
1 baths 2 beds |
$138,500
|
show details |

|
#4
Orangewood Ave
Pittsburgh, PA 15216
|
1,760 sq. feet
|
1 baths 3 beds |
$74,900
|
show details |

|
#5
Kirk Ave
Pittsburgh, PA 15227
|
1,500 sq. feet
|
2 baths 3 beds |
$217,500
|
show details |

|
#6
Natrona St
Natrona Heights, PA 15065
|
1,260 sq. feet
|
1 baths 2 beds |
$12,000
|
show details |

|
#7
Joan Dr
Pittsburgh, PA 15235
|
1,725 sq. feet
|
2 baths 3 beds |
$219,900
|
show details |

|
#8
Triana St
Pittsburgh, PA 15210
|
1,184 sq. feet
|
1 baths 3 beds |
$163,500
|
show details |

|
#9
1/2 Floral Avenue
Leechburg, PA 15656
|
792 sq. feet
|
1 baths 2 beds |
$60,549
|
show details |

|
#10
Riverside Dr
Freeport, PA 16229
|
1,060 sq. feet
|
1 baths 3 beds |
$97,941
|
show details |
| Photo | Address | Area | Beds / Baths | Price | Details |
|---|---|---|---|---|---|

|
#11
Terrace Ave
Apollo, PA 15613
|
856 sq. feet
|
1 baths 2 beds |
$76,005
|
show details |

|
#12
Lehigh Dr
Leechburg, PA 15656
|
1,154 sq. feet
|
1 baths 3 beds |
$17,206
|
show details |

|
#13
Marbury Rd
Pittsburgh, PA 15221
|
- sq. feet
|
2 baths 3 beds |
$295,000
|
show details |

|
#14
Hungry Hollow Rd
Leechburg, PA 15656
|
1,496 sq. feet
|
1 baths 4 beds |
$14,900
|
show details |

|
#15
Canal Rd
Apollo, PA 15613
|
1,517 sq. feet
|
1 baths 5 beds |
$159,924
|
show details |

|
#16
Overlook Dr
Vandergrift, PA 15690
|
- sq. feet
|
1 baths 2 beds |
$59,900
|
show details |

|
#17
Beale Ave
Leechburg, PA 15656
|
1,200 sq. feet
|
1 baths 2 beds |
$52,770
|
show details |

|
#18
Maple Rd
Vandergrift, PA 15690
|
1,144 sq. feet
|
1 baths 3 beds |
$63,205
|
show details |

|
#19
Crucible St
Pittsburgh, PA 15220
|
1,980 sq. feet
|
2 baths 4 beds |
show details | |

|
#20
North Ave Apt 1
Pittsburgh, PA 15221
|
1,759 sq. feet
|
2 baths 2 beds |
show details |
| Photo | Address | Area | Beds / Baths | Price | Details |
|---|---|---|---|---|---|

|
#21
Laurel Ave
Irwin, PA 15642
|
973 sq. feet
|
1 baths 3 beds |
show details | |

|
#22
Raymond St
Dravosburg, PA 15034
|
920 sq. feet
|
2 baths 3 beds |
show details | |

|
#23
Elm St
Clairton, PA 15025
|
1,485 sq. feet
|
1 baths 3 beds |
show details | |

|
#24
Maryellen Dr
North Versailles, PA 15137
|
944 sq. feet
|
1 baths 3 beds |
show details | |

|
#25
Lucerne Ave
Pittsburgh, PA 15214
|
1,937 sq. feet
|
1 baths 3 beds |
show details | |

|
#26
Saratoga Dr
Pittsburgh, PA 15236
|
1,000 sq. feet
|
1 baths 2 beds |
show details | |

|
#27
Rodgers St
Pittsburgh, PA 15207
|
2,048 sq. feet
|
2 baths 4 beds |
show details | |

|
#28
Westmoreland Ave
Avonmore, PA 15618
|
1,824 sq. feet
|
2 baths 4 beds |
show details | |

|
#29
Willow Dr
Monroeville, PA 15146
|
1,536 sq. feet
|
1 baths 3 beds |
show details | |

|
#30
Zdina St
Leechburg, PA 15656
|
- sq. feet
|
1 baths 3 beds |
show details |
| Photo | Address | Area | Beds / Baths | Price | Details |
|---|---|---|---|---|---|

|
#31
Blackridge Ave
Pittsburgh, PA 15235
|
1,232 sq. feet
|
1 baths 3 beds |
show details | |

|
#32
Good Ln
Pittsburgh, PA 15237
|
988 sq. feet
|
1 baths 3 beds |
show details | |

|
#33
Floral Ave
Leechburg, PA 15656
|
1,352 sq. feet
|
1 baths 3 beds |
show details | |

|
#34
Raymond St
Pittsburgh, PA 15218
|
- sq. feet
|
3 baths 4 beds |
show details | |

|
#35
Johnston Rd
Pittsburgh, PA 15235
|
1,228 sq. feet
|
1 baths 2 beds |
show details | |

|
#36
Ridge Rd
Irwin, PA 15642
|
1,520 sq. feet
|
2 baths 3 beds |
show details | |

|
#37
Arizona Dr
Allison Park, PA 15101
|
1,191 sq. feet
|
1 baths 3 beds |
show details | |

|
#38
Cloverlea St
Pittsburgh, PA 15227
|
1,200 sq. feet
|
1 baths 3 beds |
show details | |

|
#39
Evaline St
Pittsburgh, PA 15235
|
1,724 sq. feet
|
1 baths 3 beds |
show details | |

|
#40
Morton Ave
Mckeesport, PA 15133
|
1,328 sq. feet
|
1 baths 2 beds |
show details |
| Photo | Address | Area | Beds / Baths | Price | Details |
|---|---|---|---|---|---|

|
#41
Oakleaf Rd
Pittsburgh, PA 15227
|
1,163 sq. feet
|
1 baths 3 beds |
show details | |

|
#42
N 2nd St
Apollo, PA 15613
|
- sq. feet
|
2 baths 4 beds |
show details | |

|
#43
3rd St
Verona, PA 15147
|
1,025 sq. feet
|
1 baths 2 beds |
show details | |

|
#44
E 10th Ave
Homestead, PA 15120
|
1,950 sq. feet
|
2 baths 5 beds |
show details | |

|
#45
North Ave
Pittsburgh, PA 15209
|
1,386 sq. feet
|
1 baths 3 beds |
show details | |

|
#46
Grandview Ave
Mckeesport, PA 15132
|
1,764 sq. feet
|
1 baths 3 beds |
show details | |

|
#47
W Marigold St
Homestead, PA 15120
|
1,644 sq. feet
|
1 baths 2 beds |
show details | |

|
#48
Parkway Dr
Harwick, PA 15049
|
1,914 sq. feet
|
2 baths 4 beds |
show details | |

|
#49
Long Rd
Pittsburgh, PA 15235
|
1,780 sq. feet
|
1 baths 3 beds |
show details | |

|
Check over 1 million property listings on Foreclosure.com!
|
browse all offers | |||


- 23,98389.6%White alone
- 1,0714.0%Black alone
- 9243.5%Two or more races
- 3051.1%Asian alone
- 1960.7%Hispanic
- 1520.6%Other race alone
- 70.03%American Indian alone
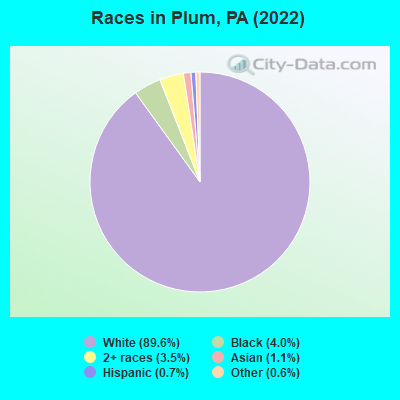
Races in Plum detailed stats: ancestries, foreign born residents, place of birth
According to our research of Pennsylvania and other state lists, there was 1 registered sex offender living in Plum, Pennsylvania as of April 19, 2024.
The ratio of all residents to sex offenders in Plum is 27,362 to 1.
The ratio of registered sex offenders to all residents in this city is much lower than the state average.
Type |
2009 |
2010 |
2011 |
2012 |
2013 |
2014 |
2015 |
2016 |
2017 |
2018 |
2019 |
2020 |
2022 |
|---|---|---|---|---|---|---|---|---|---|---|---|---|---|
| Murders (per 100,000) | 0 (0.0) | 0 (0.0) | 0 (0.0) | 0 (0.0) | 0 (0.0) | 0 (0.0) | 0 (0.0) | 0 (0.0) | 1 (3.6) | 0 (0.0) | 0 (0.0) | 1 (3.7) | 0 (0.0) |
| Rapes (per 100,000) | 1 (3.8) | 1 (3.7) | 1 (3.7) | 0 (0.0) | 1 (3.6) | 10 (36.2) | 7 (25.3) | 1 (3.6) | 2 (7.3) | 3 (11.0) | 2 (7.4) | 4 (14.8) | 1 (3.8) |
| Robberies (per 100,000) | 5 (19.1) | 5 (18.4) | 5 (18.4) | 5 (18.4) | 6 (21.8) | 7 (25.4) | 3 (10.9) | 1 (3.6) | 5 (18.2) | 5 (18.3) | 3 (11.1) | 1 (3.7) | 1 (3.8) |
| Assaults (per 100,000) | 22 (84.2) | 33 (121.7) | 92 (338.1) | 95 (348.9) | 64 (232.9) | 59 (213.8) | 47 (170.1) | 28 (101.5) | 63 (229.6) | 57 (209.0) | 25 (92.1) | 12 (44.3) | 1 (3.8) |
| Burglaries (per 100,000) | 47 (180.0) | 63 (232.2) | 60 (220.5) | 48 (176.3) | 38 (138.3) | 81 (293.5) | 56 (202.7) | 30 (108.8) | 30 (109.3) | 19 (69.7) | 9 (33.2) | 24 (88.6) | 3 (11.3) |
| Thefts (per 100,000) | 73 (279.5) | 93 (342.8) | 152 (558.6) | 138 (506.8) | 126 (458.6) | 155 (561.7) | 128 (463.3) | 108 (391.6) | 76 (277.0) | 116 (425.3) | 113 (416.5) | 59 (217.9) | 0 (0.0) |
| Auto thefts (per 100,000) | 1 (3.8) | 0 (0.0) | 8 (29.4) | 7 (25.7) | 6 (21.8) | 11 (39.9) | 9 (32.6) | 8 (29.0) | 8 (29.2) | 15 (55.0) | 2 (7.4) | 1 (3.7) | 0 (0.0) |
| Arson (per 100,000) | 1 (3.8) | 0 (0.0) | 0 (0.0) | 0 (0.0) | 0 (0.0) | 0 (0.0) | 0 (0.0) | 1 (3.6) | 1 (3.6) | 0 (0.0) | 0 (0.0) | 0 (0.0) | 0 (0.0) |
| City-Data.com crime index | 49.7 | 62.8 | 116.2 | 110.0 | 85.8 | 125.6 | 92.9 | 49.9 | 85.6 | 82.4 | 47.2 | 44.4 | 5.7 |
The City-Data.com crime index weighs serious crimes and violent crimes more heavily. Higher means more crime, U.S. average is 246.1. It adjusts for the number of visitors and daily workers commuting into cities.
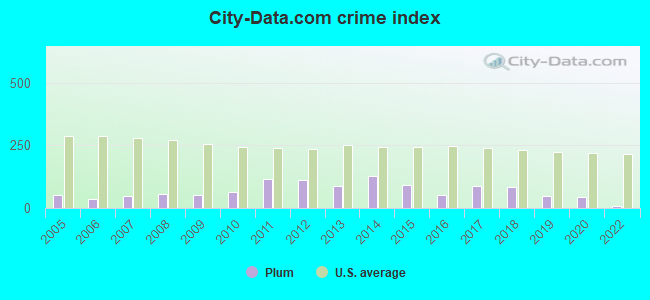
Crime rate in Plum detailed stats: murders, rapes, robberies, assaults, burglaries, thefts, arson
Full-time law enforcement employees in 2021, including police officers: 28 (26 officers - 25 male; 1 female).
| Officers per 1,000 residents here: | 0.96 |
| Pennsylvania average: | 2.55 |
 Recent articles from our blog. Our writers, many of them Ph.D. graduates or candidates, create easy-to-read articles on a wide variety of topics.

 | 5 People Shot Within 24 Hours In Allegheny County (3431 replies) |
| Pittsburgh restaurant scene update (105 replies) |
| Former GOP Candidate for Allegheny County Council (14 replies) |
| Suburb of the week: Plum (6 replies) |
| Suburb of the week: Churchill (30 replies) |
| Suburb of the week: Oakmont (34 replies) |
Latest news from Plum, PA collected exclusively by city-data.com from local newspapers, TV, and radio stations
Ancestries: Italian (22.5%), German (19.5%), Irish (11.6%), English (7.5%), Polish (6.0%), American (4.5%).
Current Local Time: EST time zone
Incorporated on 03/01/1956
Elevation: 1040 feet
Land area: 28.6 square miles.
Population density: 931 people per square mile (low).
420 residents are foreign born
| This borough: | 1.6% |
| Pennsylvania: | 7.3% |
Median real estate property taxes paid for housing units with mortgages in 2022: $3,794 (1.6%)
Median real estate property taxes paid for housing units with no mortgage in 2022: $3,198 (1.6%)
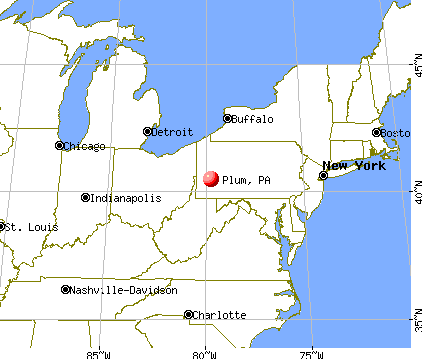
Nearest city with pop. 50,000+: Pittsburgh, PA  (12.3 miles , pop. 334,563).
Nearest city with pop. 1,000,000+: Philadelphia, PA (245.7 miles , pop. 1,517,550).
Nearest cities:
), ), ), Latitude: 40.49 N, Longitude: 79.75 W
Daytime population change due to commuting: -5,701 (-21.3%)
Workers who live and work in this borough: 4,117 (29.2%)
Area code commonly used in this area: 724
Property values in Plum, PA
Plum, Pennsylvania accommodation & food services, waste management - Economy and Business Data
| Here: | 2.3% |
| Pennsylvania: | 2.9% |
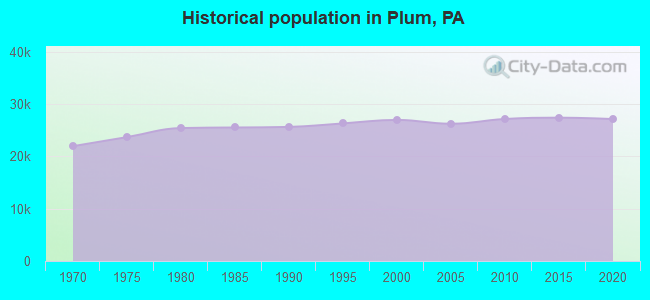
Population change in the 1990s: +1,287 (+5.0%).
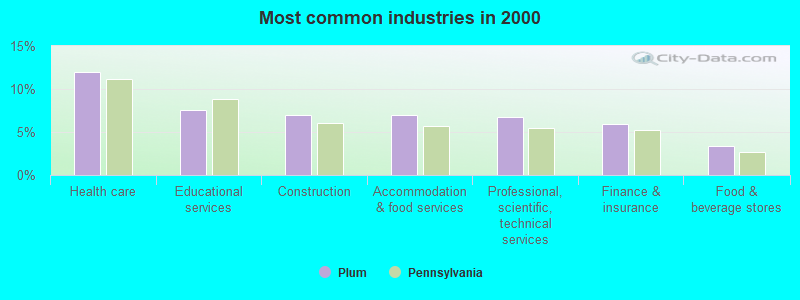
- Health care (12.0%)
- Educational services (7.6%)
- Construction (7.0%)
- Accommodation & food services (7.0%)
- Professional, scientific, technical services (6.7%)
- Finance & insurance (6.0%)
- Food & beverage stores (3.3%)
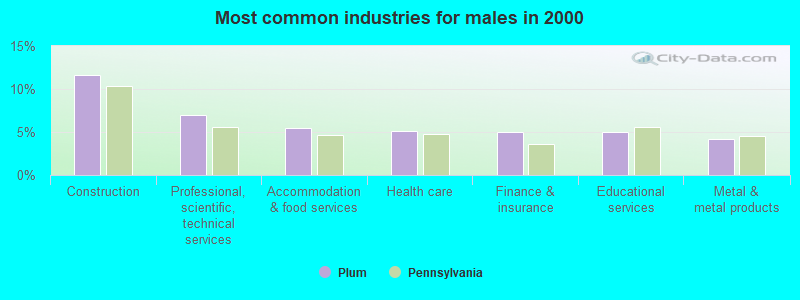
- Construction (11.7%)
- Professional, scientific, technical services (7.0%)
- Accommodation & food services (5.5%)
- Health care (5.1%)
- Finance & insurance (5.0%)
- Educational services (5.0%)
- Metal & metal products (4.2%)
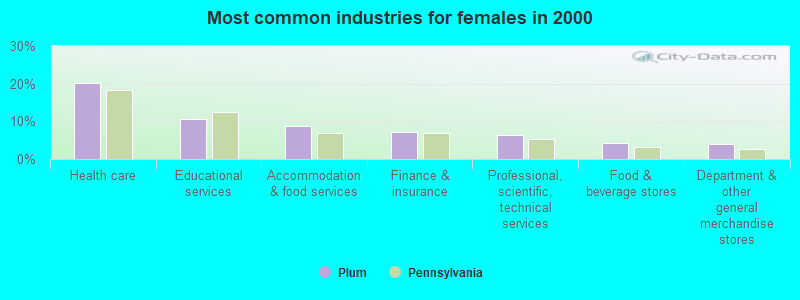
- Health care (20.1%)
- Educational services (10.6%)
- Accommodation & food services (8.7%)
- Finance & insurance (7.1%)
- Professional, scientific, technical services (6.4%)
- Food & beverage stores (4.2%)
- Department & other general merchandise stores (3.9%)

- Other sales and related occupations, including supervisors (4.6%)
- Secretaries and administrative assistants (4.3%)
- Other management occupations, except farmers and farm managers (4.2%)
- Other office and administrative support workers, including supervisors (4.2%)
- Retail sales workers, except cashiers (3.6%)
- Computer specialists (3.4%)
- Preschool, kindergarten, elementary, and middle school teachers (3.1%)
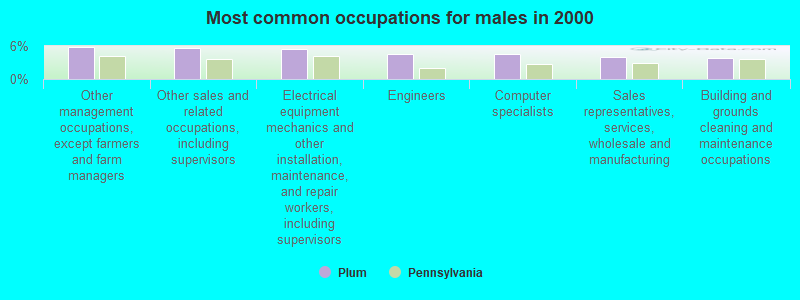
- Other management occupations, except farmers and farm managers (5.7%)
- Other sales and related occupations, including supervisors (5.6%)
- Electrical equipment mechanics and other installation, maintenance, and repair workers, including supervisors (5.4%)
- Engineers (4.5%)
- Computer specialists (4.5%)
- Sales representatives, services, wholesale and manufacturing (3.9%)
- Building and grounds cleaning and maintenance occupations (3.9%)

- Secretaries and administrative assistants (9.1%)
- Registered nurses (6.6%)
- Other office and administrative support workers, including supervisors (6.6%)
- Preschool, kindergarten, elementary, and middle school teachers (5.3%)
- Cashiers (4.8%)
- Retail sales workers, except cashiers (4.2%)
- Information and record clerks, except customer service representatives (4.0%)
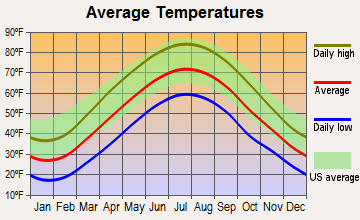
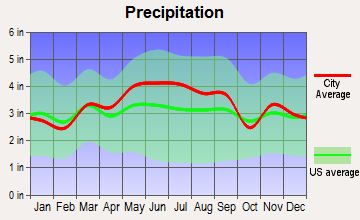
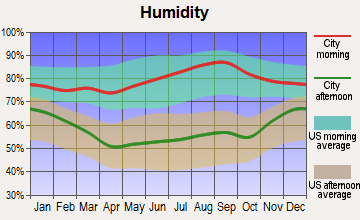
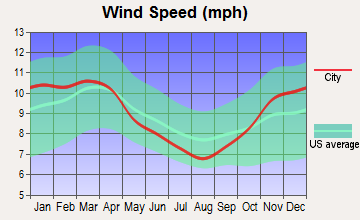
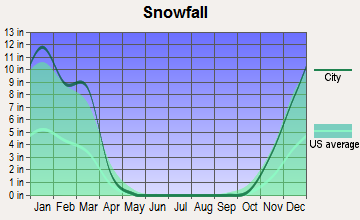
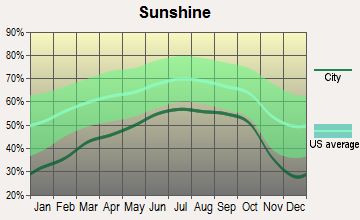
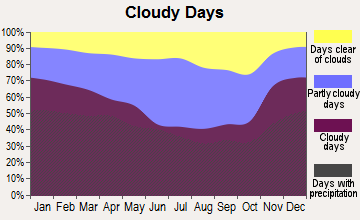
Average climate in Plum, Pennsylvania
Based on data reported by over 4,000 weather stations
|
|


(lower is better)
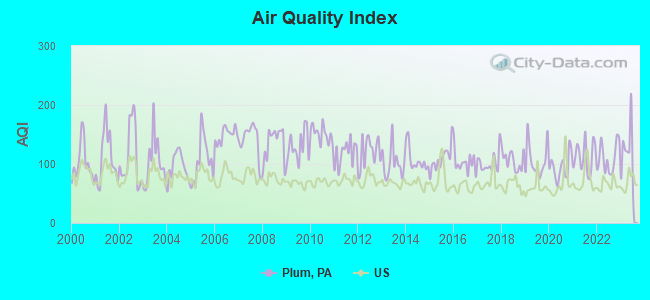
Air Quality Index (AQI) level in 2023 was 121. This is significantly worse than average.
| City: | 121 |
| U.S.: | 73 |
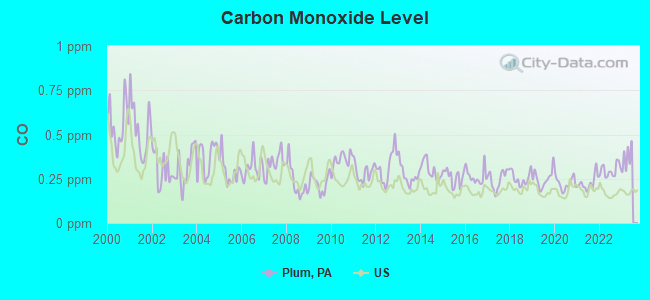
Carbon Monoxide (CO) [ppm] level in 2022 was 0.298. This is about average. Closest monitor was 3.2 miles away from the city center.
| City: | 0.298 |
| U.S.: | 0.251 |
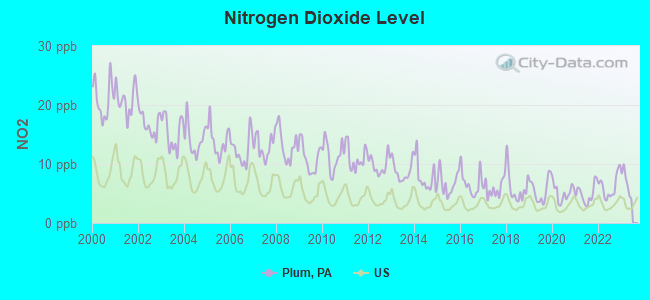
Nitrogen Dioxide (NO2) [ppb] level in 2022 was 6.21. This is worse than average. Closest monitor was 3.2 miles away from the city center.
| City: | 6.21 |
| U.S.: | 5.11 |
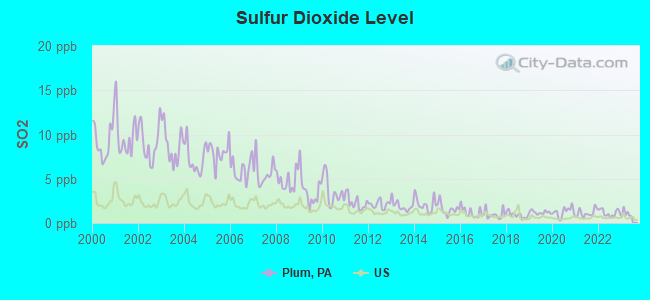
Sulfur Dioxide (SO2) [ppb] level in 2022 was 1.15. This is better than average. Closest monitor was 3.3 miles away from the city center.
| City: | 1.15 |
| U.S.: | 1.51 |
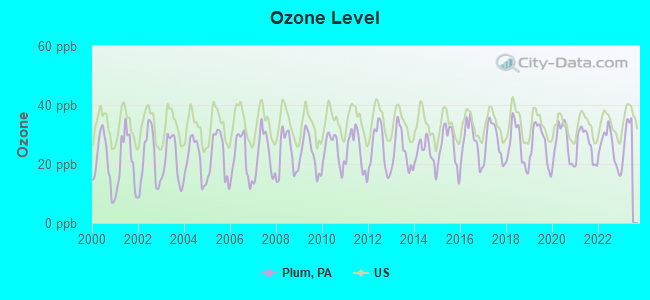
Ozone [ppb] level in 2022 was 25.7. This is better than average. Closest monitor was 3.7 miles away from the city center.
| City: | 25.7 |
| U.S.: | 33.3 |
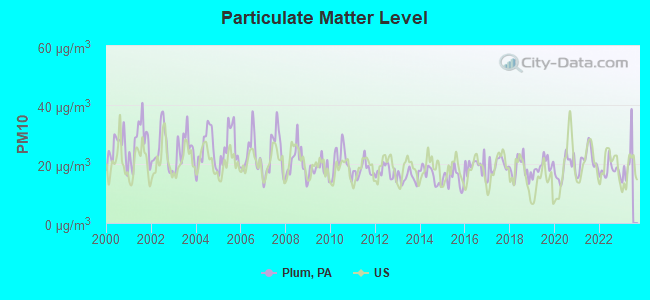
Particulate Matter (PM10) [µg/m3] level in 2022 was 17.9. This is about average. Closest monitor was 3.2 miles away from the city center.
| City: | 17.9 |
| U.S.: | 19.2 |
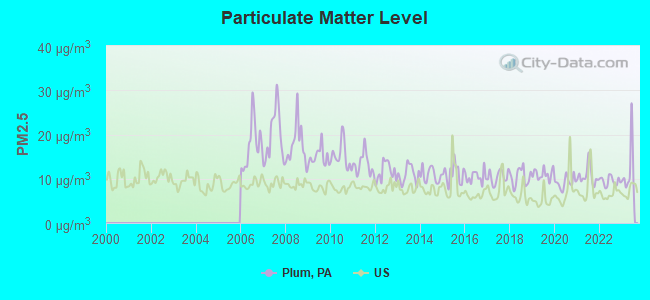
Particulate Matter (PM2.5) [µg/m3] level in 2023 was 11.9. This is significantly worse than average. Closest monitor was 4.0 miles away from the city center.
| City: | 11.9 |
| U.S.: | 8.1 |
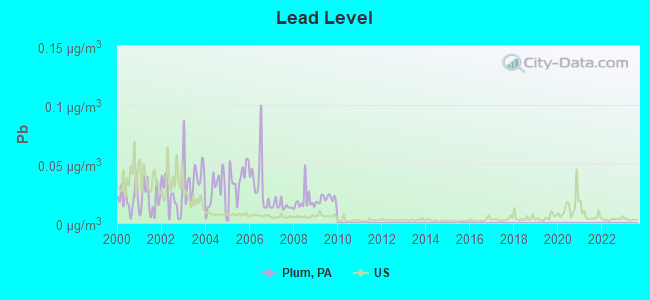
Lead (Pb) [µg/m3] level in 2009 was 0.0203. This is significantly worse than average. Closest monitor was 3.0 miles away from the city center.
| City: | 0.0203 |
| U.S.: | 0.0093 |
Tornado activity:
Plum-area historical tornado activity is near Pennsylvania state average. It is 20% smaller than the overall U.S. average.
On 6/3/1980, a category F4 (max. wind speeds 207-260 mph) tornado 10.9 miles away from the Plum borough center injured 140 people and caused between $50,000,000 and $500,000,000 in damages.
On 8/3/1963, a category F3 (max. wind speeds 158-206 mph) tornado 13.7 miles away from the borough center killed 2 people and injured 70 people and caused between $5,000,000 and $50,000,000 in damages.
Earthquake activity:
Plum-area historical earthquake activity is significantly above Pennsylvania state average. It is 57% smaller than the overall U.S. average.On 8/23/2011 at 17:51:04, a magnitude 5.8 (5.8 MW, Depth: 3.7 mi, Class: Moderate, Intensity: VI - VII) earthquake occurred 203.6 miles away from Plum center
On 9/25/1998 at 19:52:52, a magnitude 5.2 (4.8 MB, 4.3 MS, 5.2 LG, 4.5 MW, Depth: 3.1 mi) earthquake occurred 76.7 miles away from the city center
On 1/31/1986 at 16:46:43, a magnitude 5.0 (5.0 MB) earthquake occurred 106.1 miles away from the city center
On 7/27/1980 at 18:52:21, a magnitude 5.2 (5.1 MB, 4.7 MS, 5.0 UK, 5.2 UK) earthquake occurred 274.3 miles away from the city center
On 12/31/2011 at 20:05:01, a magnitude 4.0 (4.0 ML, Depth: 3.1 mi, Class: Light, Intensity: IV - V) earthquake occurred 65.2 miles away from the city center
On 8/9/2020 at 12:07:37, a magnitude 5.1 (5.1 MW, Depth: 4.7 mi) earthquake occurred 287.2 miles away from Plum center
Magnitude types: regional Lg-wave magnitude (LG), body-wave magnitude (MB), local magnitude (ML), surface-wave magnitude (MS), moment magnitude (MW)
Natural disasters:
The number of natural disasters in Allegheny County (15) is near the US average (15).Major Disasters (Presidential) Declared: 12
Emergencies Declared: 3
Causes of natural disasters: Floods: 6, Storms: 6, Winter Storms: 3, Hurricanes: 2, Tornadoes: 2, Blizzard: 1, Snowfall: 1, Snowstorm: 1, Tropical Depression: 1, Tropical Storm: 1, Other: 1 (Note: some incidents may be assigned to more than one category).
Hospitals and medical centers near Plum:
- DCI RENAL SERVICES OF PITTSBURGH, LLC - MONROEVILLE (Dialysis Facility, about 4 miles away; MONROEVILLE, PA)
- LONGWOOD AT OAKMONT (Nursing Home, about 4 miles away; VERONA, PA)
- NIGHTINGALE HOME HEALTHCARE OF WESTERN PENNSYLVANI (Home Health Center, about 4 miles away; MONROEVILLE, PA)
- CEDARS HOME HEALTH CARE SERVICES INC (Home Health Center, about 5 miles away; MONROEVILLE, PA)
- CEDARS OF MONROEVILLE, THE (Nursing Home, about 5 miles away; MONROEVILLE, PA)
- GOLDEN LIVINGCENTER-MONROEVILLE (Nursing Home, about 5 miles away; MONROEVILLE, PA)
- DAVITA - MONROEVILLE (Dialysis Facility, about 5 miles away; MONROEVILLE, PA)
Heliports located in Plum:
Amtrak stations near Plum:
- 14 miles: PITTSBURGH (1100 LIBERTY AVE.) . Services: ticket office, fully wheelchair accessible, enclosed waiting area, public restrooms, public payphones, vending machines, ATM, free short-term parking, paid long-term parking, call for car rental service, call for taxi service, intercity bus service, public transit connection.
- 18 miles: GREENSBURG (HARRISON AVE.) . Services: enclosed waiting area, public payphones, free short-term parking, free long-term parking, call for taxi service.
Colleges/universities with over 2000 students nearest to Plum:
- Carnegie Mellon University (about 11 miles; Pittsburgh, PA; Full-time enrollment: 14,186)
- University of Pittsburgh-Pittsburgh Campus (about 12 miles; Pittsburgh, PA; FT enrollment: 27,137)
- The Art Institute of Pittsburgh-Online Division (about 13 miles; Pittsburgh, PA; FT enrollment: 11,040)
- Duquesne University (about 14 miles; Pittsburgh, PA; FT enrollment: 8,211)
- Point Park University (about 14 miles; Pittsburgh, PA; FT enrollment: 3,525)
- Community College of Allegheny County (about 15 miles; Pittsburgh, PA; FT enrollment: 13,486)
- Seton Hill University (about 17 miles; Greensburg, PA; FT enrollment: 2,167)
Points of interest:
Notable locations in Plum: Boyce Park Ski Area (A), Oakmont Golf Course (B), Oakmont Heights Golf Course (C), Valley Heights Golf Course (D), Logans Ferry (E), Dice Pumping Station (F), A E Oblock Junior High School Library (G), Kinder Care Learning Center (H), Plum Borough Hall (I), Plum Borough Library (J), Saint John the Baptist Catholic Church Convent (K), Whales Tale Plum Center (L), Plum Boro Fire Department (M), Unity Volunteer Fire Department (N), Holiday Park Volunteer Fire Department Station 236 (O), Logans Ferry Heights Volunteer Fire Department Station 235 (P), Renton Volunteer Fire Department Station 234 (Q), Unity Junction (R). Display/hide their locations on the map
Churches in Plum include: Holiday Park United Methodist Church (A), Holiday Park Baptist Church (B), Tetelestai Church (C), Pittsburgh East Community Church (D), Penn Hills Alliance Church (E), Our Lady of Joy Church (F), Christian Alliance Church (G), Crossroads Vineyard Christian Fellowship Church (H), Saint Januarius Mission (I). Display/hide their locations on the map
Cemeteries: Laird Cemetery (1), Dugan Cemetery (2), Plum Creek Cemetery (3), Temple Sinai Memorial Park (4). Display/hide their locations on the map
Reservoirs: Collins Lake (A), Pond Three (B). Display/hide their locations on the map
Streams, rivers, and creeks: Humms Run (A), Little Plum Creek (B), Blacks Run (C), Bodies Run (D). Display/hide their locations on the map
Park in Plum: William D Boyce Regional Park (1). Display/hide its location on the map
Tourist attraction: Classic Travel & Tours (795-16 Pine Valley Dr) (1). Display/hide its approximate location on the map
Birthplace of: William D. Boyce - Businessman and founder of Scouting in America.
| This borough: | 2.5 people |
| Pennsylvania: | 2.5 people |
| This borough: | 71.2% |
| Whole state: | 65.0% |
| This borough: | 5.0% |
| Whole state: | 6.6% |
Likely homosexual households (counted as self-reported same-sex unmarried-partner households)
- Lesbian couples: 0.3% of all households
- Gay men: 0.2% of all households
10 people in group homes for juveniles (non-correctional) in 2010
People in group quarters in Plum in 2000:
- 180 people in other noninstitutional group quarters
- 44 people in nursing homes
- 7 people in homes for the mentally retarded
- 2 people in religious group quarters
Banks with branches in Plum (2011 data):
- Citizens Bank of Pennsylvania: Plum Branch at 2005 Route 286, branch established on 1984/11/29. Info updated 2010/09/24: Bank assets: $32,316.9 mil, Deposits: $25,297.1 mil, headquarters in Philadelphia, PA, positive income, 396 total offices, Holding Company: Uk Financial Investments Limited
For population 15 years and over in Plum:
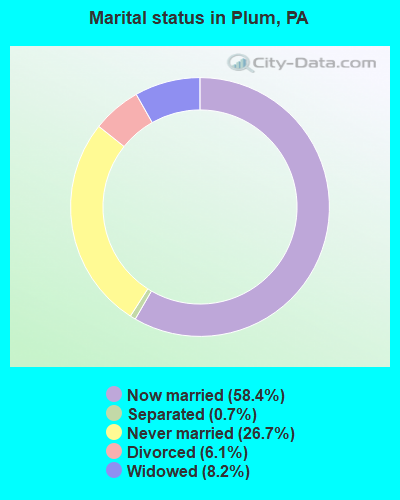
- Never married: 26.7%
- Now married: 58.4%
- Separated: 0.7%
- Widowed: 8.2%
- Divorced: 6.1%
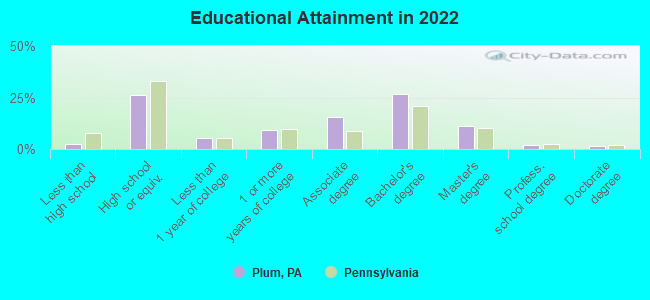
For population 25 years and over in Plum:
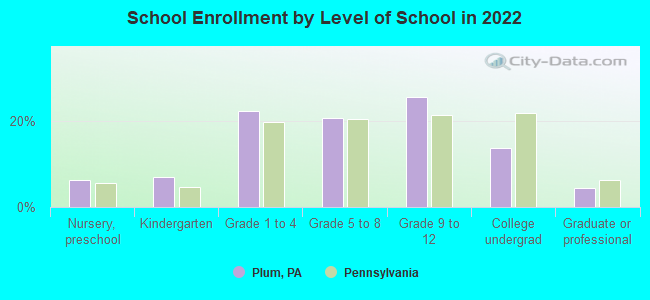
- High school or higher: 97.3%
- Bachelor's degree or higher: 40.0%
- Graduate or professional degree: 14.2%
- Unemployed: 4.5%
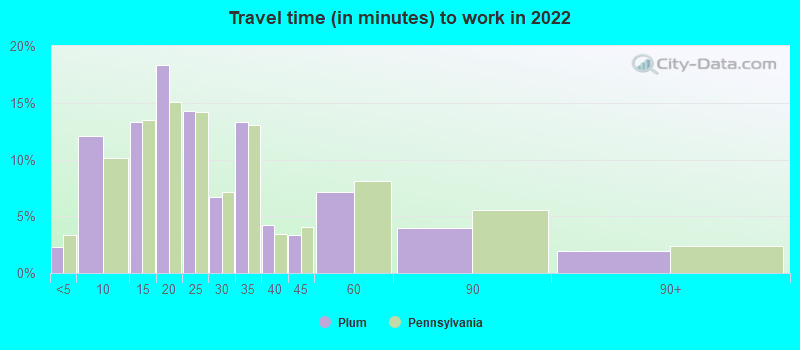
- Mean travel time to work (commute): 23.0 minutes
| Here: | 8.8 |
| Pennsylvania average: | 11.4 |
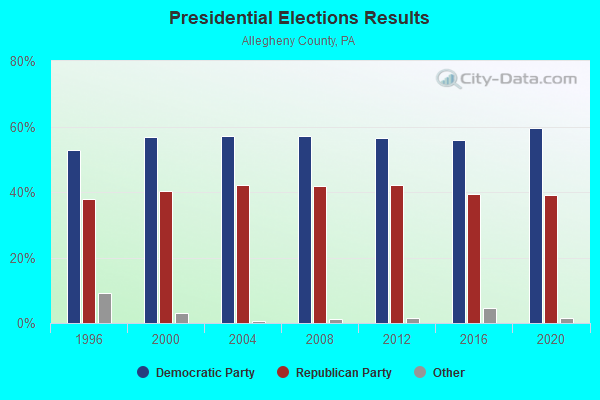
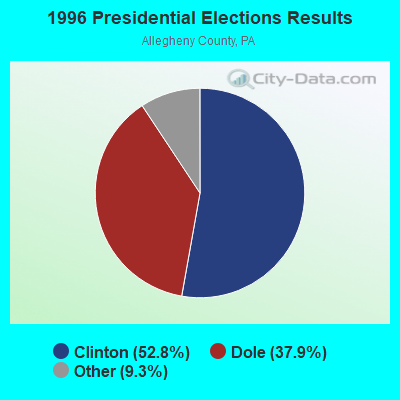
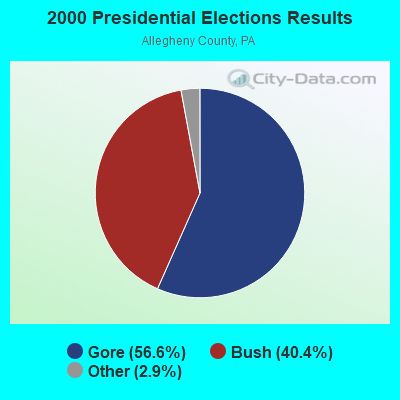


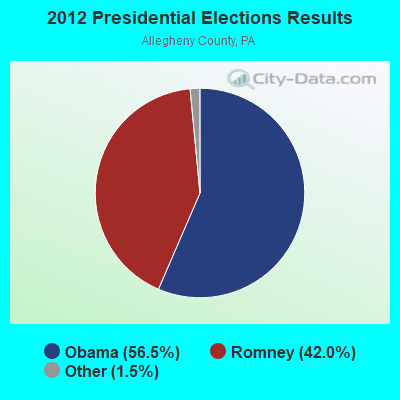
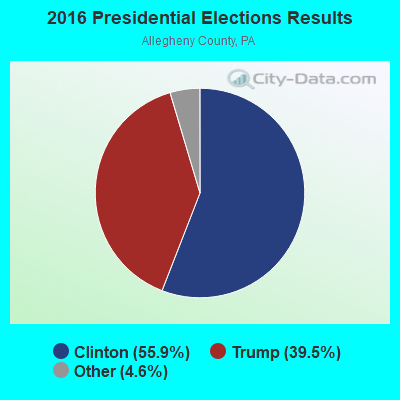

Graphs represent county-level data. Detailed 2008 Election Results
Religion statistics for Plum, PA (based on Allegheny County data)
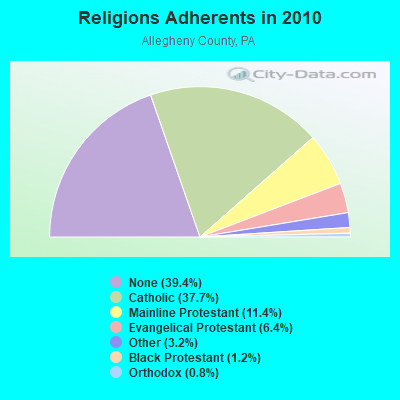
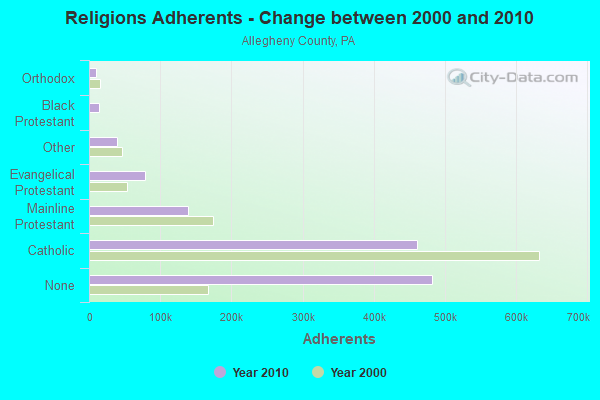
| Religion | Adherents | Congregations |
|---|---|---|
| Catholic | 460,672 | 183 |
| Mainline Protestant | 139,551 | 414 |
| Evangelical Protestant | 78,101 | 349 |
| Other | 38,781 | 98 |
| Black Protestant | 14,268 | 75 |
| Orthodox | 9,606 | 29 |
| None | 482,369 | - |
Food Environment Statistics:
| Allegheny County: | 1.72 / 10,000 pop. |
| Pennsylvania: | 2.04 / 10,000 pop. |
| Here: | 0.09 / 10,000 pop. |
| Pennsylvania: | 0.09 / 10,000 pop. |
| Here: | 1.09 / 10,000 pop. |
| State: | 0.88 / 10,000 pop. |
| Allegheny County: | 2.44 / 10,000 pop. |
| Pennsylvania: | 2.52 / 10,000 pop. |
| Allegheny County: | 8.15 / 10,000 pop. |
| Pennsylvania: | 7.12 / 10,000 pop. |
| Allegheny County: | 8.7% |
| Pennsylvania: | 9.1% |
| Here: | 26.3% |
| State: | 27.2% |
| This county: | 12.9% |
| State: | 11.5% |
Health and Nutrition:
| Plum: | 55.3% |
| Pennsylvania: | 50.2% |
| This city: | 55.1% |
| State: | 47.1% |
| This city: | 28.2 |
| State: | 28.7 |
| Plum: | 20.9% |
| Pennsylvania: | 20.8% |
| Here: | 8.5% |
| State: | 10.9% |
| Plum: | 7.0 |
| Pennsylvania: | 6.8 |
| Here: | 34.6% |
| Pennsylvania: | 34.3% |
| Plum: | 61.9% |
| Pennsylvania: | 56.2% |
| Plum: | 80.5% |
| Pennsylvania: | 78.3% |
More about Health and Nutrition of Plum, PA Residents
| Local government employment and payroll (March 2022) | |||||
| Function | Full-time employees | Monthly full-time payroll | Average yearly full-time wage | Part-time employees | Monthly part-time payroll |
|---|---|---|---|---|---|
| Streets and Highways | 26 | $149,492 | $68,996 | 0 | $0 |
| Police Protection - Officers | 23 | $196,250 | $102,391 | 0 | $0 |
| Other Government Administration | 10 | $67,278 | $80,734 | 8 | $382 |
| Financial Administration | 5 | $28,592 | $68,621 | 0 | $0 |
| Police - Other | 4 | $31,774 | $95,322 | 2 | $2,349 |
| Totals for Government | 68 | $473,386 | $83,539 | 10 | $2,731 |
Plum government finances - Expenditure in 2017 (per resident):
- Construction - Regular Highways: $473,000 ($17.74)
Parks and Recreation: $371,000 ($13.91)
- Current Operations - Police Protection: $4,485,000 ($168.22)
Regular Highways: $4,470,000 ($167.65)
Central Staff Services: $1,442,000 ($54.08)
Solid Waste Management: $1,260,000 ($47.26)
Parks and Recreation: $834,000 ($31.28)
Local Fire Protection: $484,000 ($18.15)
Natural Resources - Other: $477,000 ($17.89)
General Public Buildings: $452,000 ($16.95)
General - Other: $424,000 ($15.90)
Judicial and Legal Services: $117,000 ($4.39)
Libraries: $96,000 ($3.60)
Financial Administration: $84,000 ($3.15)
- General - Interest on Debt: $579,000 ($21.72)
- Other Capital Outlay - Solid Waste Management: $474,000 ($17.78)
Regular Highways: $440,000 ($16.50)
Police Protection: $120,000 ($4.50)
Central Staff Services: $20,000 ($0.75)
- Total Salaries and Wages: $4,901,000 ($183.82)
Plum government finances - Revenue in 2017 (per resident):
- Charges - Solid Waste Management: $1,797,000 ($67.40)
Other: $207,000 ($7.76)
Parks and Recreation: $4,000 ($0.15)
- Federal Intergovernmental - Other: $29,000 ($1.09)
- Local Intergovernmental - Other: $229,000 ($8.59)
- Miscellaneous - Special Assessments: $700,000 ($26.25)
General Revenue - Other: $82,000 ($3.08)
Fines and Forfeits: $59,000 ($2.21)
Sale of Property: $54,000 ($2.03)
Rents: $30,000 ($1.13)
Interest Earnings: $6,000 ($0.23)
- State Intergovernmental - Highways: $902,000 ($33.83)
Other: $544,000 ($20.40)
General Local Government Support: $14,000 ($0.53)
- Tax - Property: $5,690,000 ($213.41)
Individual Income: $3,702,000 ($138.85)
Public Utility License: $601,000 ($22.54)
Occupation and Business License - Other: $530,000 ($19.88)
Documentary and Stock Transfer: $307,000 ($11.51)
Plum government finances - Debt in 2017 (per resident):
- Long Term Debt - Issue, Unspecified Public Purpose: $24,022,000 ($900.98)
Retired Unspecified Public Purpose: $23,321,000 ($874.69)
Outstanding Unspecified Public Purpose: $17,034,000 ($638.89)
Beginning Outstanding - Unspecified Public Purpose: $16,332,000 ($612.56)
Plum government finances - Cash and Securities in 2017 (per resident):
- Bond Funds - Cash and Securities: $1,592,000 ($59.71)
- Other Funds - Cash and Securities: $2,402,000 ($90.09)
- Sinking Funds - Cash and Securities: $70,000 ($2.63)
4.01% of this county's 2021 resident taxpayers lived in other counties in 2020 ($71,916 average adjusted gross income)
| Here: | 4.01% |
| Pennsylvania average: | 5.27% |
0.01% of residents moved from foreign countries ($162 average AGI)
Allegheny County: 0.01% Pennsylvania average: 0.01%
Top counties from which taxpayers relocated into this county between 2020 and 2021:
| from Westmoreland County, PA | |
| from Washington County, PA | |
| from Butler County, PA |
4.90% of this county's 2020 resident taxpayers moved to other counties in 2021 ($87,789 average adjusted gross income)
| Here: | 4.90% |
| Pennsylvania average: | 5.44% |
0.01% of residents moved to foreign countries ($61 average AGI)
Allegheny County: 0.01% Pennsylvania average: 0.01%
Top counties to which taxpayers relocated from this county between 2020 and 2021:
| to Westmoreland County, PA | |
| to Washington County, PA | |
| to Butler County, PA |
| Businesses in Plum, PA | ||||
| Name | Count | Name | Count | |
|---|---|---|---|---|
| Curves | 1 | Quiznos | 1 | |
| FedEx | 1 | Wendy's | 1 | |
| McDonald's | 1 | |||
Strongest AM radio stations in Plum:
- KDKA (1020 AM; 50 kW; PITTSBURGH, PA; Owner: INFINITY BROADCASTING OPERATIONS, INC.)
- WPGR (1510 AM; 5 kW; MONROEVILLE, PA; Owner: MCL/ MCM- INC.)
- WJAS (1320 AM; 6 kW; PITTSBURGH, PA; Owner: RENDA BROADCASTING CORP. OF NEVADA)
- WPIT (730 AM; 5 kW; PITTSBURGH, PA; Owner: PENNSYLVANIA MEDIA ASSOCIATES, INC.)
- WKHB (620 AM; 6 kW; IRWIN, PA; Owner: BROADCAST COMMUNICATIONS, INC.)
- WPTT (1360 AM; 5 kW; MCKEESPORT, PA; Owner: RENDA BROADCASTING CORPORATION OF NEVADA)
- WAVL (910 AM; 5 kW; APOLLO, PA; Owner: EVANGEL HEIGHTS ASSEMBLY OF GOD)
- WBGG (970 AM; 5 kW; PITTSBURGH, PA; Owner: AMFM RADIO LICENSES, L.L.C.)
- WGBN (1150 AM; 1 kW; NEW KENSINGTON, PA; Owner: PENTECOSTAL TEMPLE DEVELOPMENT CORP.)
- WEAE (1250 AM; 5 kW; PITTSBURGH, PA; Owner: ABC, INC.)
- KQV (1410 AM; 5 kW; PITTSBURGH, PA; Owner: CALVARY, INC.)
- WEDO (810 AM; daytime; 1 kW; MCKEESPORT, PA; Owner: 810 INCORPORATED)
- WWCS (540 AM; 5 kW; CANONSBURG, PA; Owner: BIRACH BROADCASTING CORPORATION)
Strongest FM radio stations in Plum:
- WRWJ (88.1 FM; MURRYSVILLE, PA; Owner: HE'S ALIVE, INCORPORATED)
- WZPT (100.7 FM; NEW KENSINGTON, PA; Owner: INFINITY RADIO SUBSIDIARY OPERATIONS INC.)
- WSHH (99.7 FM; PITTSBURGH, PA; Owner: RENDA B/CING CORP. OF NEVADA)
- WDSY-FM (107.9 FM; PITTSBURGH, PA; Owner: INFINITY RADIO SUBSIDIARY OPERATIONS INC.)
- WJJJ (104.7 FM; PITTSBURGH, PA; Owner: CAPSTAR TX LIMITED PARTNERSHIP)
- WLTJ (92.9 FM; PITTSBURGH, PA; Owner: WPNT, INC.)
- WWSW-FM (94.5 FM; PITTSBURGH, PA; Owner: AMFM RADIO LICENSES, L.L.C.)
- WQED-FM (89.3 FM; PITTSBURGH, PA; Owner: WQED MULTIMEDIA)
- WDVE (102.5 FM; PITTSBURGH, PA; Owner: CAPSTAR TX LIMITED PARTNERSHIP)
- WRRK (96.9 FM; BRADDOCK, PA; Owner: WPNT INC)
- WPTS-FM (92.1 FM; PITTSBURGH, PA; Owner: UNIV. OF PITTSBURGH COMMONWEALTH SYS)
- WORD-FM (101.5 FM; PITTSBURGH, PA; Owner: PENNSYLVANIA MEDIA ASSOCIATES, INC.)
- WKST-FM (96.1 FM; PITTSBURGH, PA; Owner: CAPSTAR TX LIMITED PARTNERSHIP)
- WYEP-FM (91.3 FM; PITTSBURGH, PA; Owner: PITTSBURGH COMM. B/CING. CORP.)
- WXDX-FM (105.9 FM; PITTSBURGH, PA; Owner: CAPSTAR TX LIMITED PARTNERSHIP)
- WSSZ (107.1 FM; GREENSBURG, PA; Owner: MCL/MCM-INC.)
- WBZZ (93.7 FM; PITTSBURGH, PA; Owner: INFINITY RADIO SUBSIDIARY OPERATIONS INC.)
- WOGI (98.3 FM; DUQUESNE, PA; Owner: KEYMARKET LICENSES, LLC)
- WDUQ (90.5 FM; PITTSBURGH, PA; Owner: DUQUESNE UNIVERSITY)
- WQEJ (89.7 FM; JOHNSTOWN, PA; Owner: WQED MULTIMEDIA)
TV broadcast stations around Plum:
- WCWB (Channel 22; PITTSBURGH, PA; Owner: WCWB LICENSEE, LLC)
- WPCB-TV (Channel 40; GREENSBURG, PA; Owner: CORNERSTONE TELEVISION, INC.)
- WPXI (Channel 11; PITTSBURGH, PA; Owner: WPXI-TV HOLDINGS, INC.)
- WBGN-LP (Channel 59; PITTSBURGH, PA; Owner: BRUNO GOODWORTH NETWORK, INC.)
- WPTG-LP (Channel 69; PITTSBURGH, PA; Owner: ABACUS TELEVISION)
- W65CG (Channel 65; PITTSBURGH, PA; Owner: TRINITY BROADCASTING NETWORK)
- WQEX (Channel 16; PITTSBURGH, PA; Owner: WQED MULTIMEDIA)
- WTAE-TV (Channel 4; PITTSBURGH, PA; Owner: WTAE HEARST-ARGYLE TV, INC. (CA CORP.))
- KDKA-TV (Channel 2; PITTSBURGH, PA; Owner: CBS BROADCASTING INC.)
- WPGH-TV (Channel 53; PITTSBURGH, PA; Owner: WPGH LICENSEE, LLC)
- WQED (Channel 13; PITTSBURGH, PA; Owner: WQED MULTIMEDIA)
- W61CC (Channel 61; PITTSBURGH, PA; Owner: THE VIDEOHOUSE, INC.)
- WIIC-LP (Channel 29; PITTSBURGH, PA; Owner: ABACUS TELEVISION)
- WBPA-LP (Channel 29; PITTSBURGH, PA; Owner: VENTURE TECHNOLOGIES GROUP, LLC)
- WBYD-CA (Channel 35; JOHNSTOWN, PA; Owner: BENJAMIN PEREZ)
- W63AU (Channel 63; PITTSBURGH, PA; Owner: THE BON-TELE NETWORK, INC.)
- WTOV-TV (Channel 9; STEUBENVILLE, OH; Owner: WTOV-TV HOLDINGS, INC.)
- WLLS-LP (Channel 49; INDIANA, PA; Owner: LARRY L. SCHRECONGOST)
- WQVC-CA (Channel 28; GREENSBURG, PA; Owner: ABACUS TELEVISION)
- W25AX (Channel 25; KITTANNING, PA; Owner: TURNPIKE TELEVISION)
- W56CG (Channel 56; GREENSBURG, PA; Owner: TURNPIKE TELEVISION)
- W60BL (Channel 60; BUTLER, PA; Owner: TURNPIKE TELEVISION)
- National Bridge Inventory (NBI) Statistics
- 60Number of bridges
- 925ft / 282mTotal length
- $12,372,000Total costs
- 655,667Total average daily traffic
- 86,860Total average daily truck traffic
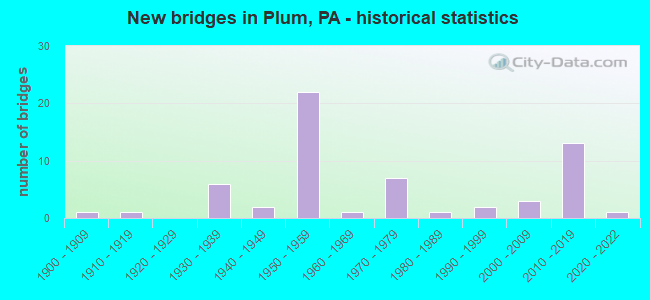
- New bridges - historical statistics
- 11900-1909
- 11910-1919
- 61930-1939
- 21940-1949
- 221950-1959
- 11960-1969
- 71970-1979
- 11980-1989
- 21990-1999
- 32000-2009
- 132010-2019
- 12020-2022
FCC Registered Broadcast Land Mobile Towers:
2- 3860 New Texas Rd (Lat: 40.466722 Lon: -79.733111), Type: Building, Structure height: 6 m, Overall height: 8 m, Call Sign: WPMG479,
Assigned Frequencies: 45.0000 MHz, Grant Date: 07/04/2013, Expiration Date: 07/17/2023, Cancellation Date: 02/13/2015, Certifier: Donald C Madl, Registrant: Pennsylvania Game Commission, 2001 Elmerton Avenue, Harrisburg, PA 17110-9797, Phone: (717) 787-4023, Fax: (717) 787-2832, Email:
- Lat: 40.463389 Lon: -79.706444, Call Sign: WQDG901,
Assigned Frequencies: 152.915 MHz, 160.020 MHz, 154.490 MHz, 152.990 MHz, 151.550 MHz, Grant Date: 08/11/2015, Expiration Date: 08/23/2025, Certifier: Mark Lukacs, Registrant: Lauttamus Communications Inc., P.O. Box 2216, Weirton, WV 26062, Phone: (304) 723-5555, Fax: (304) 723-7451, Email:
FCC Registered Microwave Towers:
2- REPP ROAD, .1 Mi W .2 Mi S Of Repp Rd & Logans Ferry Rd (Lat: 40.527000 Lon: -79.781722), Type: Tower, Structure height: 54.9 m, Call Sign: WNTR846,
Assigned Frequencies: 10628.7 MHz, 10621.2 MHz, Grant Date: 04/21/2018, Expiration Date: 07/12/2028, Registrant: Port Authority Of Allegheny County, 345 Sixth Ave, Floor 3, Pittsburgh, PA 15222, Phone: (412) 566-5372, Fax: (412) 566-5356, Email:
- Plum, Lat: 40.530833 Lon: -79.797500, Type: Ltower, Structure height: 54 m, Call Sign: WQOB232,
Assigned Frequencies: 3650.00 MHz, Grant Date: 07/30/2011, Expiration Date: 07/30/2021, Cancellation Date: 08/19/2021, Certifier: Lee W Pillar, Registrant: Duquesne Light, 2839 New Beaver Ave, Pittsburgh, PA 15233, Phone: (412) 393-8161, Fax: (412) 393-5762, Email:
FCC Registered Paging Towers:
2- Penn Hills, Approx 1.5 Miles Sw (Lat: 40.634500 Lon: -79.786972), Call Sign: KNKL631,
Assigned Frequencies: 454.525 MHz, Grant Date: 11/04/1999, Expiration Date: 11/04/2009, Cancellation Date: 10/18/2004, Certifier: Glenn S Rabin, Registrant: Alltel Communications, Inc., One Allied Drive B2f2-A, Little Rock, AR 72202, Phone: (501) 905-8555, Fax: (501) 905-6193, Email:
- Penn Hills, Approx. 1.5 Miles Sw Of (Lat: 40.467833 Lon: -79.786972), Overall height: 45.7 m, Call Sign: KNKL631,
Assigned Frequencies: 454.525 MHz, Grant Date: 11/04/1999, Expiration Date: 11/04/2009, Cancellation Date: 10/18/2004, Certifier: Glenn S Rabin, Registrant: Alltel Communications, Inc., One Allied Drive B2f2-A, Little Rock, AR 72202, Phone: (501) 905-8555, Fax: (501) 905-6193, Email:
FCC Registered Amateur Radio Licenses:
1- Call Sign: KB3NGE, Licensee ID: L01126086, Grant Date: 03/08/2006, Expiration Date: 03/08/2016, Cancellation Date: 03/09/2018, Certifier: Jeffrey L Fedele, Registrant: Jeffrey L Fedele, 454 Vale Dr, Plum, PA 15239
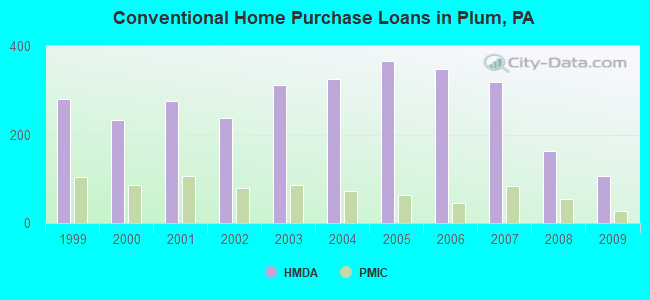
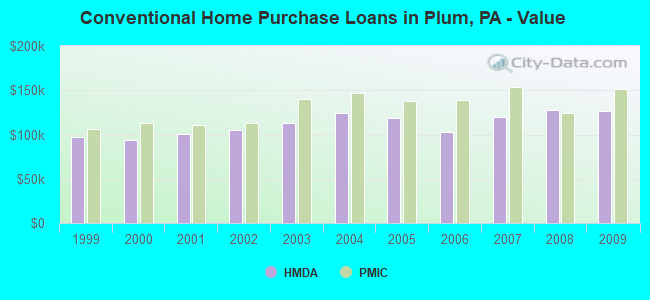
| Home Mortgage Disclosure Act Aggregated Statistics For Year 2009 (Based on 6 full tracts) | ||||||||||||||
| A) FHA, FSA/RHS & VA Home Purchase Loans | B) Conventional Home Purchase Loans | C) Refinancings | D) Home Improvement Loans | E) Loans on Dwellings For 5+ Families | F) Non-occupant Loans on < 5 Family Dwellings (A B C & D) | G) Loans On Manufactured Home Dwelling (A B C & D) | ||||||||
|---|---|---|---|---|---|---|---|---|---|---|---|---|---|---|
| Number | Average Value | Number | Average Value | Number | Average Value | Number | Average Value | Number | Average Value | Number | Average Value | Number | Average Value | |
| LOANS ORIGINATED | 126 | $136,595 | 107 | $126,579 | 492 | $132,455 | 81 | $35,975 | 1 | $295,000 | 10 | $65,400 | 0 | $0 |
| APPLICATIONS APPROVED, NOT ACCEPTED | 7 | $106,714 | 6 | $126,833 | 45 | $103,533 | 11 | $31,545 | 0 | $0 | 3 | $67,000 | 0 | $0 |
| APPLICATIONS DENIED | 9 | $155,111 | 11 | $83,727 | 169 | $132,314 | 33 | $40,152 | 0 | $0 | 7 | $61,857 | 2 | $53,500 |
| APPLICATIONS WITHDRAWN | 10 | $136,800 | 8 | $150,250 | 122 | $129,156 | 13 | $53,692 | 0 | $0 | 3 | $104,000 | 0 | $0 |
| FILES CLOSED FOR INCOMPLETENESS | 1 | $95,000 | 2 | $104,000 | 26 | $136,692 | 3 | $27,667 | 0 | $0 | 0 | $0 | 0 | $0 |
Detailed HMDA statistics for the following Tracts: 5261.01 , 5261.02, 5262.01, 5262.02, 5263.01, 5263.02
| Private Mortgage Insurance Companies Aggregated Statistics For Year 2009 (Based on 6 full tracts) | ||||
| A) Conventional Home Purchase Loans | B) Refinancings | |||
|---|---|---|---|---|
| Number | Average Value | Number | Average Value | |
| LOANS ORIGINATED | 27 | $151,741 | 20 | $159,300 |
| APPLICATIONS APPROVED, NOT ACCEPTED | 14 | $160,643 | 3 | $140,333 |
| APPLICATIONS DENIED | 3 | $173,333 | 5 | $204,000 |
| APPLICATIONS WITHDRAWN | 2 | $218,500 | 2 | $218,500 |
| FILES CLOSED FOR INCOMPLETENESS | 0 | $0 | 0 | $0 |
Detailed PMIC statistics for the following Tracts: 5261.01 , 5261.02, 5262.01, 5262.02, 5263.01, 5263.02
2004 - 2018 National Fire Incident Reporting System (NFIRS) incidents
- Fire incident types reported to NFIRS in Plum, PA
- 20559.9%Structure Fires
- 5817.0%Outside Fires
- 4112.0%Mobile Property/Vehicle Fires
- 3811.1%Other
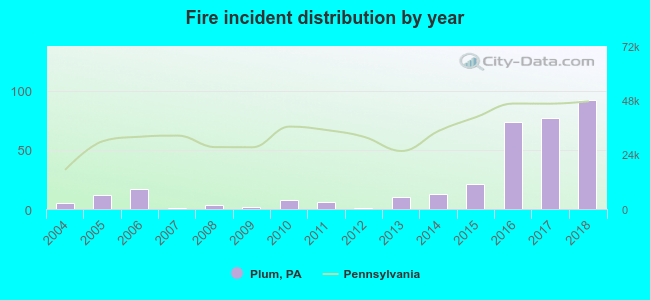 Based on the data from the years 2004 - 2018 the average number of fires per year is 23. The highest number of reported fires - 92 took place in 2018, and the least - 1 in 2007. The data has a rising trend.
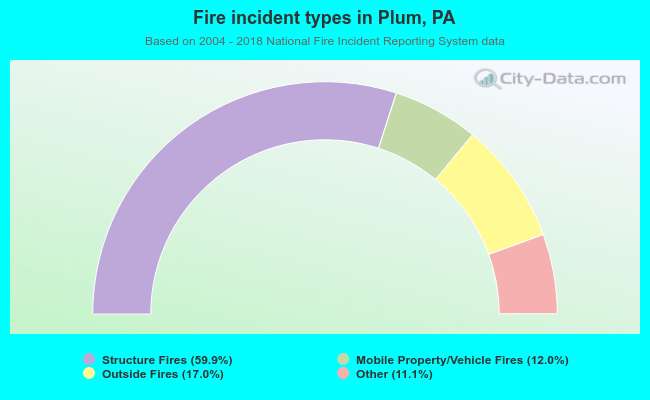 When looking into fire subcategories, the most reports belonged to: Structure Fires (59.9%), and Outside Fires (17.0%).
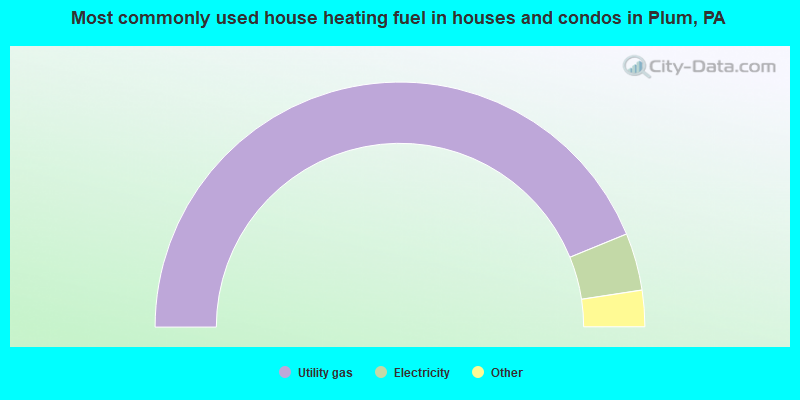
- 87.7%Utility gas
- 7.6%Electricity
- 2.9%Fuel oil, kerosene, etc.
- 1.7%Bottled, tank, or LP gas
- 0.1%Wood
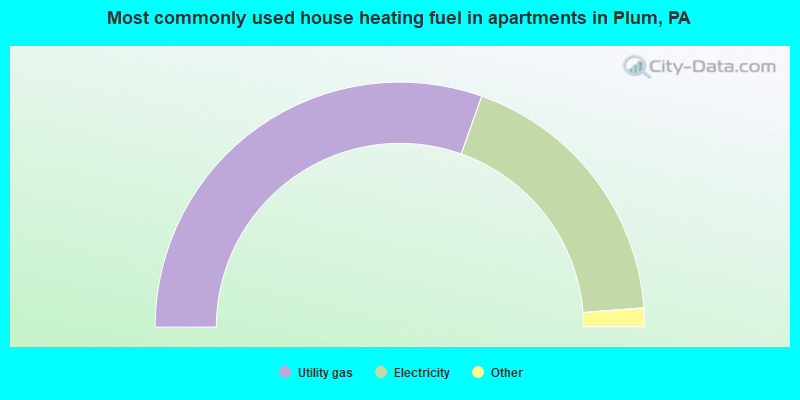
- 60.9%Utility gas
- 36.7%Electricity
- 1.9%Bottled, tank, or LP gas
- 0.5%Fuel oil, kerosene, etc.
Plum compared to Pennsylvania state average:
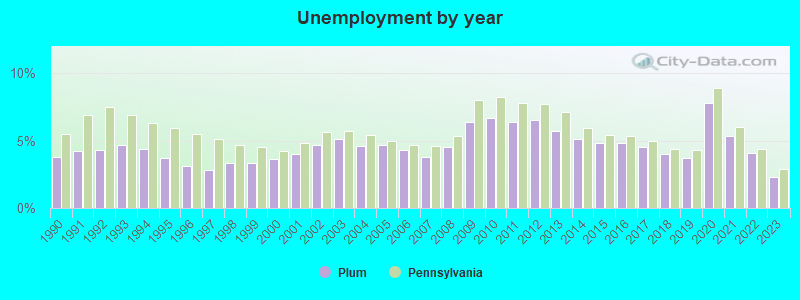
- Unemployed percentage significantly below state average.
- Black race population percentage below state average.
- Hispanic race population percentage significantly below state average.
- Foreign-born population percentage significantly below state average.
- Length of stay since moving in significantly above state average.
- Percentage of population with a bachelor's degree or higher above state average.
Plum on our top lists:
- #25 on the list of "Top 101 cities where residents moved in more then 10 years ago (10,000+ households)"
- #67 (15239) on the list of "Top 101 zip codes with the largest percentage of Slovak first ancestries (pop 5,000+)"
- #3 on the list of "Top 101 counties with the most Mainline Protestant congregations"
- #3 on the list of "Top 101 counties with the most Catholic congregations"
- #6 on the list of "Top 101 counties with the most Orthodox congregations"
- #8 on the list of "Top 101 counties with the most Mainline Protestant adherents"
- #15 on the list of "Top 101 counties with the most Catholic adherents (pop. 50,000+)"

|
|
Total of 16 patent applications in 2008-2024.