Percentage of residents living in poverty in 2022: 12.3%
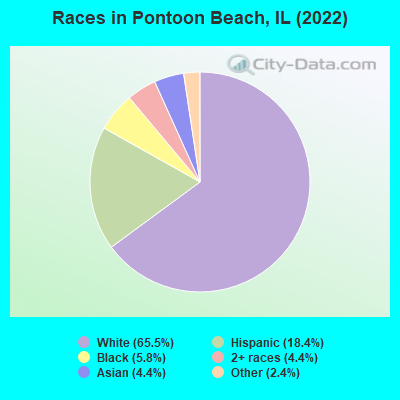
(10.9% for White Non-Hispanic residents, 13.3% for Black residents, 9.9% for Hispanic or Latino residents, 19.4% for other race residents, 26.5% for two or more races residents)
According to our research of Illinois and other state lists, there were 9 registered sex offenders living in Pontoon Beach, Illinois as of April 25, 2024. The ratio of all residents to sex offenders in Pontoon Beach is 637 to 1. The ratio of registered sex offenders to all residents in this city is near the state average.
Crime rates in Pontoon Beach by year
Type
2010
2011
2012
2013
2014
2015
2016
2017
2018
2019
Murders (per 100,000)
0 (0.0)
1 (17.1)
0 (0.0)
0 (0.0)
0 (0.0)
0 (0.0)
0 (0.0)
0 (0.0)
0 (0.0)
0 (0.0)
Rapes (per 100,000)
2 (34.3)
0 (0.0)
0 (0.0)
0 (0.0)
1 (17.7)
1 (17.8)
0 (0.0)
1 (17.9)
0 (0.0)
3 (53.1)
Robberies (per 100,000)
3 (51.4)
3 (51.2)
3 (51.5)
2 (34.9)
1 (17.7)
2 (35.5)
2 (35.7)
2 (35.9)
3 (53.2)
0 (0.0)
Assaults (per 100,000)
1 (17.1)
5 (85.4)
0 (0.0)
4 (69.8)
3 (53.1)
3 (53.3)
6 (107.2)
5 (89.7)
10 (177.3)
15 (265.6)
Burglaries (per 100,000)
31 (531.2)
30 (512.5)
19 (326.4)
11 (191.9)
17 (300.8)
11 (195.3)
23 (410.9)
22 (394.8)
5 (88.7)
13 (230.2)
Thefts (per 100,000)
79 (1,354)
97 (1,657)
85 (1,460)
69 (1,204)
111 (1,964)
67 (1,190)
84 (1,501)
65 (1,167)
53 (939.7)
48 (849.9)
Auto thefts (per 100,000)
4 (68.5)
15 (256.2)
9 (154.6)
5 (87.2)
9 (159.3)
4 (71.0)
6 (107.2)
8 (143.6)
10 (177.3)
8 (141.6)
Arson (per 100,000)
0 (0.0)
0 (0.0)
0 (0.0)
0 (0.0)
0 (0.0)
3 (53.3)
1 (17.9)
0 (0.0)
0 (0.0)
0 (0.0)
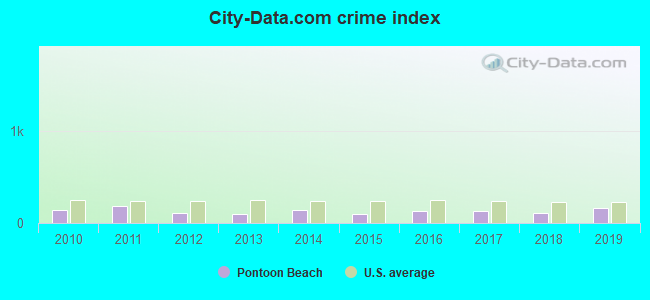
City-Data.com crime index
143.1
189.3
109.1
93.0
142.5
102.5
129.5
128.9
109.4
157.0
The City-Data.com crime index weighs serious crimes and violent crimes more heavily. Higher means more crime, U.S. average is 246.1. It adjusts for the number of visitors and daily workers commuting into cities.
Latest news from Pontoon Beach, IL collected exclusively by city-data.com from local newspapers, TV, and radio stations
Ancestries: German (9.7%), Italian (7.2%), Irish (5.6%), English (5.2%), American (4.1%), British (1.2%).
Current Local Time: CST time zone
Incorporated on 07/17/1963
Elevation: 420 feet
Land area: 8.18 square miles.
Population density: 712 people per square mile (low).
523 residents are foreign born (6.3% Latin America, 2.2% Asia).
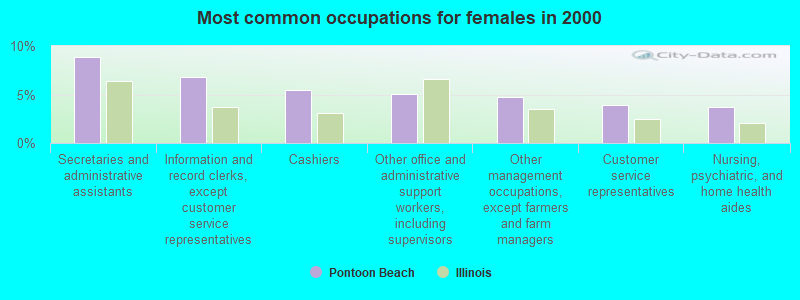
This village:
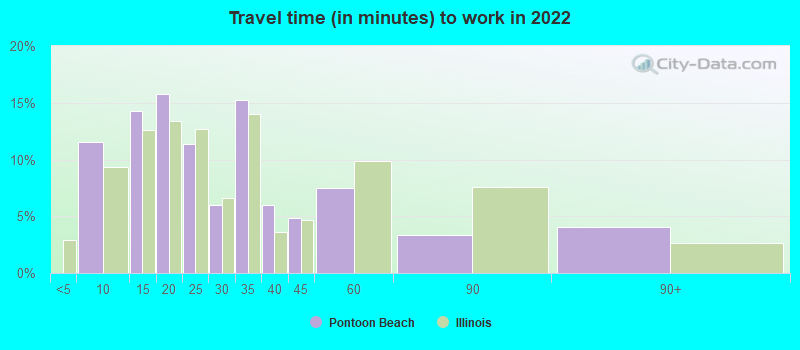
8.7%
Illinois:
14.1%
Median real estate property taxes paid for housing units with mortgages in 2022: $3,966 (2.3%) Median real estate property taxes paid for housing units with no mortgage in 2022: $1,804 (1.4%)
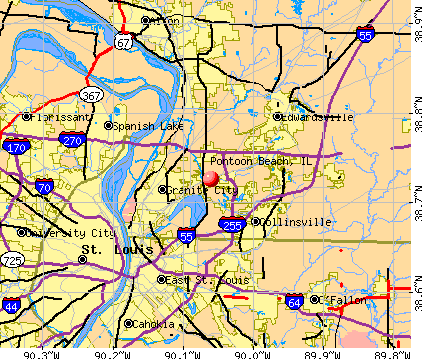
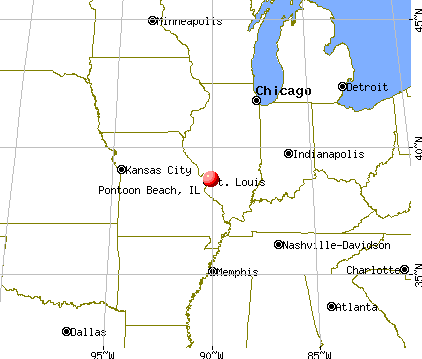
Nearest city with pop. 50,000+: St. Louis, MO (12.0 miles , pop. 348,189).
Nearest city with pop. 1,000,000+: Chicago, IL (249.4 miles , pop. 2,896,016).
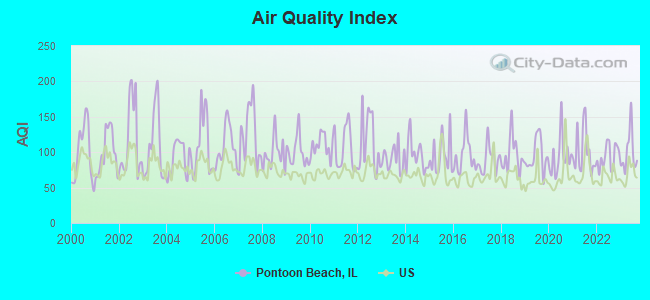
Air Quality Index (AQI) level in 2023 was 99.6. This is worse than average.
City:
99.6
U.S.:
72.6
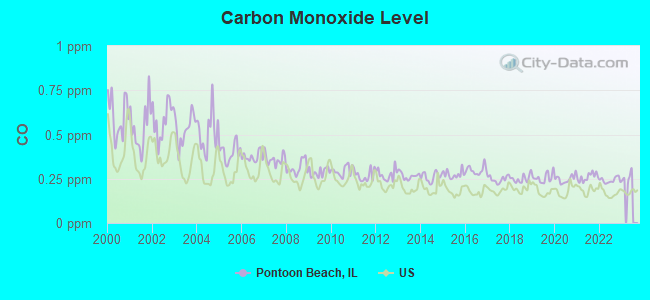
Carbon Monoxide (CO) [ppm] level in 2022 was 0.241. This is about average.Closest monitor was 4.5 miles away from the city center.
City:
0.241
U.S.:
0.251
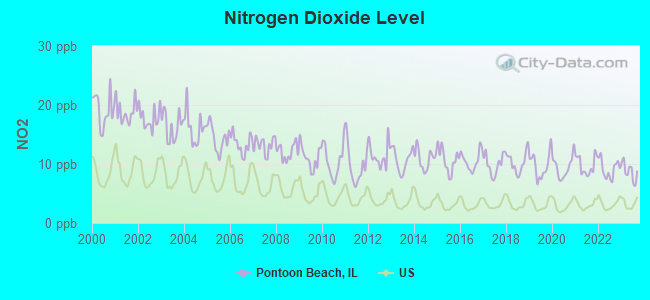
Nitrogen Dioxide (NO2) [ppb] level in 2023 was 8.73. This is significantly worse than average.Closest monitor was 4.5 miles away from the city center.
City:
8.73
U.S.:
5.11
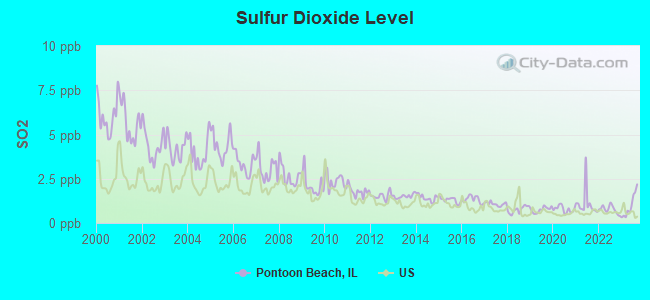
Sulfur Dioxide (SO2) [ppb] level in 2023 was 0.980. This is significantly better than average.Closest monitor was 4.5 miles away from the city center.
City:
0.980
U.S.:
1.515
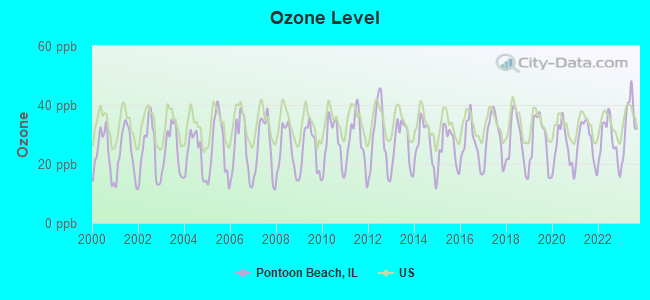
Ozone [ppb] level in 2023 was 34.4. This is about average.Closest monitor was 4.5 miles away from the city center.
City:
34.4
U.S.:
33.3
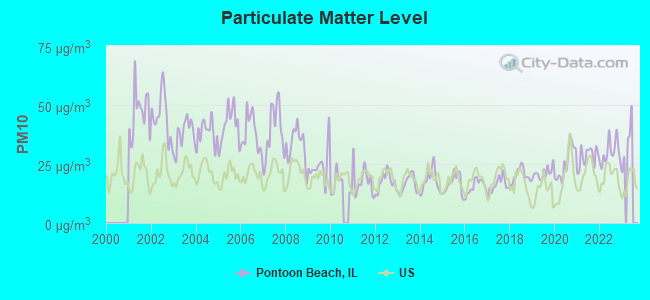
Particulate Matter (PM10) [µg/m3] level in 2022 was 29.9. This is significantly worse than average.Closest monitor was 4.5 miles away from the city center.
City:
29.9
U.S.:
19.2
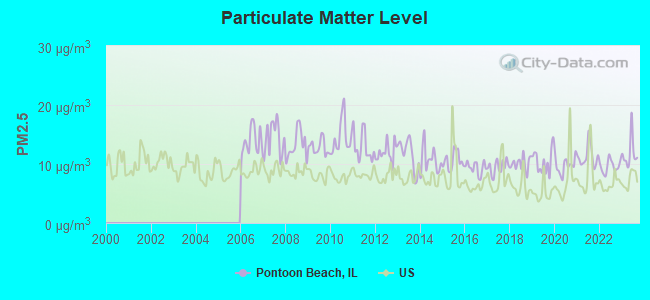
Particulate Matter (PM2.5) [µg/m3] level in 2023 was 11.8. This is significantly worse than average.Closest monitor was 4.5 miles away from the city center.
City:
11.8
U.S.:
8.1
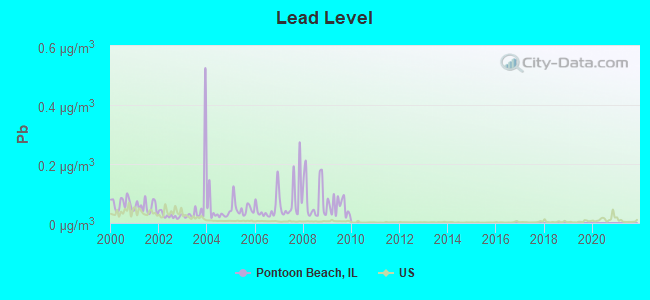
Lead (Pb) [µg/m3] level in 2009 was 0.0581. This is significantly worse than average.Closest monitor was 3.1 miles away from the city center.
City:
0.0581
U.S.:
0.0093
Tornado activity:
Pontoon Beach-area historical tornado activity is slightly above Illinois state average. It is 87% greater than the overall U.S. average.
On 4/3/1981, a category F4 (max. wind speeds 207-260 mph) tornado 3.8 miles away from the Pontoon Beach village center injured 32 peopleand causedbetween $5,000,000 and $50,000,000 in damages.
On 2/10/1959, a category F4 tornado 6.2 miles away from the village center killed 21 peopleand injured 345 peopleand causedbetween $5,000,000 and $50,000,000 in damages.
Earthquake activity:
Pontoon Beach-area historical earthquake activity is significantly above Illinois state average. It is 298% greater than the overall U.S. average.
On 4/18/2008 at 09:36:59, a magnitude 5.4 (5.1 MB, 4.8 MS, 5.4 MW, 5.2 MW, Class: Moderate, Intensity: VI - VII) earthquake occurred 119.1 miles away from Pontoon Beach center On 4/18/2008 at 09:36:59, a magnitude 5.2 (5.2 MW, Depth: 8.9 mi) earthquake occurred 119.1 miles away from Pontoon Beach center On 6/10/1987 at 23:48:54, a magnitude 5.1 (4.9 MB, 4.4 MS, 4.6 MS, 5.1 LG) earthquake occurred 117.5 miles away from Pontoon Beach center On 9/26/1990 at 13:18:51, a magnitude 5.0 (4.7 MB, 4.8 LG, 5.0 LG, Depth: 7.7 mi) earthquake occurred 111.6 miles away from Pontoon Beach center On 6/18/2002 at 17:37:15, a magnitude 5.0 (4.3 MB, 4.6 MW, 5.0 LG) earthquake occurred 133.8 miles away from the city center On 5/4/1991 at 01:18:54, a magnitude 5.0 (4.4 MB, 4.6 LG, 5.0 LG, Depth: 3.1 mi) earthquake occurred 150.1 miles away from the city center Magnitude types: regional Lg-wave magnitude (LG), body-wave magnitude (MB), surface-wave magnitude (MS), moment magnitude (MW)
Natural disasters:
The number of natural disasters in Madison County (14) is near the US average (15). Major Disasters (Presidential) Declared: 11 Emergencies Declared: 1
Causes of natural disasters: Floods: 11, Storms: 10, Tornadoes: 3, Heavy Rain: 1, Hurricane: 1, Winter Storm: 1, Other: 1 (Note: some incidents may be assigned to more than one category).
Hospitals and medical centers in Pontoon Beach:
LEWIS AND CLARK MANOR (56 CHOUTEAU TRACE PARKWAY)
Other hospitals and medical centers near Pontoon Beach:
STEARNS NURSING AND REHAB CENTER (Nursing Home, about 3 miles away; GRANITE CITY, IL)
LYNHAVEN (Hospital, about 3 miles away; GRANITE CITY, IL)
GRANITE NURSING AND REHABILITATION (Nursing Home, about 4 miles away; GRANITE CITY, IL)
GATEWAY REGIONAL HOME HEALTH - GRANITE CITY (Home Health Center, about 5 miles away; GRANITE CITY, IL)
GATEWAY REGIONAL MEDICAL CENTER Acute Care Hospitals (about 5 miles away; GRANITE CITY, IL)
MERIDIAN VILLAGE CARE CENTER (Nursing Home, about 6 miles away; GLEN CARBON, IL)
UNITY HOSPICE (Hospital, about 6 miles away; COLLINSVILLE, IL)
Amtrak stations near Pontoon Beach:
11 miles: ST. LOUIS (550 S. 16TH ST.) . Services: ticket office, partially wheelchair accessible, enclosed waiting area, public restrooms, public payphones, vending machines, free short-term parking, free long-term parking, call for car rental service, taxi stand.
13 miles: ALTON (3400 COLLEGE AVE.) . Services: ticket office, fully wheelchair accessible, public payphones, vending machines, free short-term parking, free long-term parking, call for taxi service.
Colleges/universities with over 2000 students nearest to Pontoon Beach:
Hotel: Holiday Inn Express Hotel & Suites (14 Regency Park Drive).
Madison County has a predicted average indoor radon screening level between 2 and 4 pCi/L (pico curies per liter) - Moderate Potential
Drinking water stations with addresses in Pontoon Beach that have no violations reported:
ICE HOUSE AMERICA PONTOON BEACH (Population served: 25,Primary Water Source Type: Purch surface water)
Average household size:
This village:
2.6 people
Illinois:
2.6 people
Percentage of family households:
This village:
69.1%
Whole state:
65.8%
Percentage of households with unmarried partners:
This village:
8.6%
Whole state:
6.3%
Likely homosexual households (counted as self-reported same-sex unmarried-partner households)
Lesbian couples: 0.4% of all households
Gay men: 0.2% of all households
31 people in group homes intended for adults in 2010
29 people in homes for the mentally retarded in 2000
Banks with branches in Pontoon Beach (2011 data):
The Bank of Edwardsville: Pontoon Beach Center at 5111 Highway 111, branch established on 1991/02/01. Info updated 2006/11/03: Bank assets: $1,559.6 mil, Deposits: $1,289.3 mil, headquarters in Edwardsville, IL, positive income, 20 total offices, Holding Company: Banc Ed Corp., The
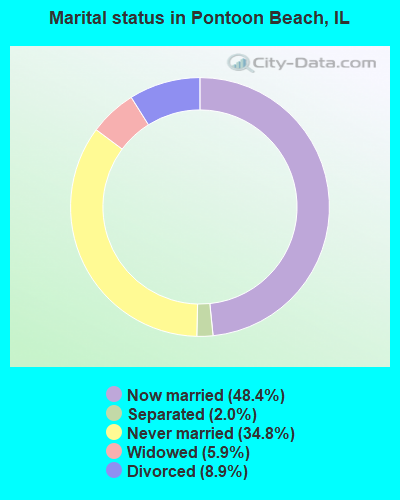
For population 15 years and over in Pontoon Beach:
Never married: 34.8%
Now married: 48.4%
Separated: 2.0%
Widowed: 5.9%
Divorced: 8.9%
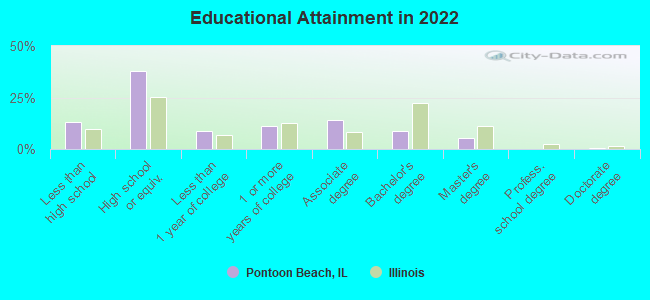
For population 25 years and over in Pontoon Beach:
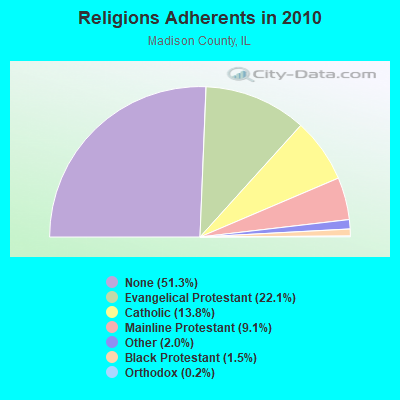
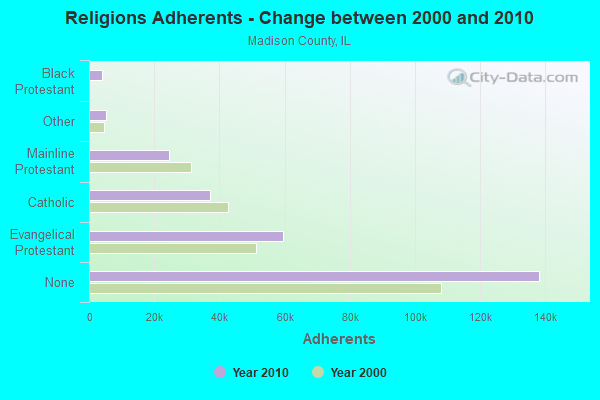
Religion statistics for Pontoon Beach, IL (based on Madison County data)
Religion
Adherents
Congregations
Evangelical Protestant
59,455
212
Catholic
37,243
21
Mainline Protestant
24,545
79
Other
5,330
20
Black Protestant
3,942
21
Orthodox
590
4
None
138,177
-
Source: Clifford Grammich, Kirk Hadaway, Richard Houseal, Dale E.Jones, Alexei Krindatch, Richie Stanley and Richard H.Taylor. 2012. 2010 U.S.Religion Census: Religious Congregations & Membership Study. Association of Statisticians of American Religious Bodies. Jones, Dale E., et al. 2002. Congregations and Membership in the United States 2000. Nashville, TN: Glenmary Research Center. Graphs represent county-level data
MO-STL0356A, 4113 Pontoon Road (Lat: 38.732611 Lon: -90.073806), Type: Pole, Structure height: 31.4 m, Overall height: 34.4 m, Call Sign: WQLJ850, Assigned Frequencies: 10735.0 MHz, 10855.0 MHz, Grant Date: 04/07/2020, Expiration Date: 02/17/2030, Cancellation Date: 09/10/2021, Certifier: Nadja S Sodos-Wallace, Registrant: T-Mobile Usa, Inc., 12920 Se 38th Street, Bellevue, WA 98006, Phone: (425) 383-8402, Fax: (425) 383-4840, Email:
FCC Registered Amateur Radio Licenses:
4
Call Sign: KB9RSJ, Licensee ID: L00293143, Grant Date: 11/20/1997, Expiration Date: 11/20/2007, Cancellation Date: 11/21/2009, Registrant: 6m 222 1.2 Preservation Group, 27 Teal St, Pontoon Beach, IL 62040
Call Sign: KC9AHA, Licensee ID: L00401550, Grant Date: 09/19/2001, Expiration Date: 09/19/2011, Cancellation Date: 09/20/2013, Certifier: Bruce A Vinson, Registrant: Bruce A Vinson, 103 Wilson Ct, Pontoon Beach, IL 62040
Call Sign: KC9AHB, Licensee ID: L00401551, Grant Date: 09/19/2001, Expiration Date: 09/19/2011, Cancellation Date: 09/20/2013, Certifier: Carolyn A Vinson, Registrant: Carolyn A Vinson, 103 Wilson Ct, Pontoon Beach, IL 62040
Call Sign: KE7TWT, Licensee ID: L01395941, Grant Date: 05/08/2008, Expiration Date: 05/08/2018, Cancellation Date: 05/09/2020, Certifier: Roy D Mcmullen, Registrant: Roy D Mcmullen, 3801 Lake Drive Lot 341, Pontoon Beach, IL 62040
Home Mortgage Disclosure Act Aggregated Statistics For Year 2009 (Based on 2 partial tracts)
A) FHA, FSA/RHS & VA Home Purchase Loans
B) Conventional Home Purchase Loans
C) Refinancings
D) Home Improvement Loans
F) Non-occupant Loans on < 5 Family Dwellings (A B C & D)
G) Loans On Manufactured Home Dwelling (A B C & D)
Number
Average Value
Number
Average Value
Number
Average Value
Number
Average Value
Number
Average Value
Number
Average Value
LOANS ORIGINATED
8
$121,924
7
$94,513
47
$115,491
5
$38,396
5
$66,692
1
$30,880
APPLICATIONS APPROVED, NOT ACCEPTED
0
$0
1
$105,390
4
$122,585
0
$0
0
$0
0
$0
APPLICATIONS DENIED
1
$56,980
2
$83,315
11
$125,261
2
$29,790
1
$89,160
1
$22,520
APPLICATIONS WITHDRAWN
2
$75,390
1
$210,720
5
$122,730
0
$0
0
$0
0
$0
FILES CLOSED FOR INCOMPLETENESS
0
$0
0
$0
2
$113,290
0
$0
0
$0
0
$0
Aggregated Statistics For Year 2008 (Based on 2 partial tracts)
A) FHA, FSA/RHS & VA Home Purchase Loans
B) Conventional Home Purchase Loans
C) Refinancings
D) Home Improvement Loans
F) Non-occupant Loans on < 5 Family Dwellings (A B C & D)
G) Loans On Manufactured Home Dwelling (A B C & D)
Number
Average Value
Number
Average Value
Number
Average Value
Number
Average Value
Number
Average Value
Number
Average Value
LOANS ORIGINATED
7
$108,661
12
$98,110
32
$106,458
4
$35,468
5
$60,556
2
$26,690
APPLICATIONS APPROVED, NOT ACCEPTED
0
$0
1
$166,380
2
$60,400
1
$60,090
0
$0
0
$0
APPLICATIONS DENIED
4
$123,002
4
$73,498
18
$110,984
10
$41,571
3
$48,437
2
$29,410
APPLICATIONS WITHDRAWN
1
$179,370
1
$126,080
8
$104,529
1
$21,140
0
$0
0
$0
FILES CLOSED FOR INCOMPLETENESS
1
$77,120
0
$0
2
$117,740
0
$0
0
$0
0
$0
Aggregated Statistics For Year 2007 (Based on 2 partial tracts)
A) FHA, FSA/RHS & VA Home Purchase Loans
B) Conventional Home Purchase Loans
C) Refinancings
D) Home Improvement Loans
F) Non-occupant Loans on < 5 Family Dwellings (A B C & D)
G) Loans On Manufactured Home Dwelling (A B C & D)
Number
Average Value
Number
Average Value
Number
Average Value
Number
Average Value
Number
Average Value
Number
Average Value
LOANS ORIGINATED
2
$104,230
25
$101,174
36
$105,398
13
$39,452
7
$93,634
2
$73,805
APPLICATIONS APPROVED, NOT ACCEPTED
0
$0
3
$64,963
4
$123,950
1
$42,780
0
$0
1
$38,230
APPLICATIONS DENIED
2
$58,875
8
$74,876
22
$98,403
6
$32,948
3
$48,337
2
$23,065
APPLICATIONS WITHDRAWN
0
$0
3
$110,443
11
$93,256
2
$24,815
0
$0
0
$0
FILES CLOSED FOR INCOMPLETENESS
0
$0
1
$103,170
4
$128,808
0
$0
0
$0
0
$0
Aggregated Statistics For Year 2006 (Based on 2 partial tracts)
A) FHA, FSA/RHS & VA Home Purchase Loans
B) Conventional Home Purchase Loans
C) Refinancings
D) Home Improvement Loans
F) Non-occupant Loans on < 5 Family Dwellings (A B C & D)
G) Loans On Manufactured Home Dwelling (A B C & D)
Number
Average Value
Number
Average Value
Number
Average Value
Number
Average Value
Number
Average Value
Number
Average Value
LOANS ORIGINATED
2
$128,695
25
$97,990
36
$87,143
12
$29,323
4
$35,092
1
$43,830
APPLICATIONS APPROVED, NOT ACCEPTED
0
$0
3
$125,210
5
$88,872
1
$13,420
1
$31,480
1
$71,850
APPLICATIONS DENIED
0
$0
7
$67,624
19
$99,301
8
$51,555
1
$27,460
2
$34,610
APPLICATIONS WITHDRAWN
1
$49,040
4
$73,538
17
$105,466
3
$72,900
1
$40,170
0
$0
FILES CLOSED FOR INCOMPLETENESS
0
$0
1
$79,400
4
$90,575
0
$0
0
$0
0
$0
Aggregated Statistics For Year 2005 (Based on 2 partial tracts)
A) FHA, FSA/RHS & VA Home Purchase Loans
B) Conventional Home Purchase Loans
C) Refinancings
D) Home Improvement Loans
F) Non-occupant Loans on < 5 Family Dwellings (A B C & D)
G) Loans On Manufactured Home Dwelling (A B C & D)
Number
Average Value
Number
Average Value
Number
Average Value
Number
Average Value
Number
Average Value
Number
Average Value
LOANS ORIGINATED
6
$85,128
30
$92,046
40
$98,236
10
$36,289
7
$58,701
2
$23,740
APPLICATIONS APPROVED, NOT ACCEPTED
0
$0
3
$106,633
5
$115,888
0
$0
1
$57,200
1
$45,370
APPLICATIONS DENIED
0
$0
9
$70,022
28
$91,219
8
$37,695
0
$0
4
$32,135
APPLICATIONS WITHDRAWN
0
$0
5
$86,356
19
$121,675
1
$268,290
2
$53,725
0
$0
FILES CLOSED FOR INCOMPLETENESS
0
$0
1
$73,300
4
$112,075
1
$19,770
0
$0
0
$0
Aggregated Statistics For Year 2004 (Based on 2 partial tracts)
A) FHA, FSA/RHS & VA Home Purchase Loans
B) Conventional Home Purchase Loans
C) Refinancings
D) Home Improvement Loans
F) Non-occupant Loans on < 5 Family Dwellings (A B C & D)
G) Loans On Manufactured Home Dwelling (A B C & D)
Number
Average Value
Number
Average Value
Number
Average Value
Number
Average Value
Number
Average Value
Number
Average Value
LOANS ORIGINATED
4
$90,375
23
$84,769
47
$89,015
6
$31,085
7
$53,784
2
$32,055
APPLICATIONS APPROVED, NOT ACCEPTED
1
$78,770
5
$81,076
7
$96,559
1
$22,570
1
$80,500
0
$0
APPLICATIONS DENIED
0
$0
8
$72,485
26
$84,196
7
$26,354
0
$0
4
$49,215
APPLICATIONS WITHDRAWN
1
$61,730
4
$86,010
23
$96,580
1
$22,020
0
$0
0
$0
FILES CLOSED FOR INCOMPLETENESS
0
$0
0
$0
3
$113,597
0
$0
0
$0
0
$0
Aggregated Statistics For Year 2003 (Based on 2 partial tracts)
A) FHA, FSA/RHS & VA Home Purchase Loans
B) Conventional Home Purchase Loans
C) Refinancings
D) Home Improvement Loans
F) Non-occupant Loans on < 5 Family Dwellings (A B C & D)
Number
Average Value
Number
Average Value
Number
Average Value
Number
Average Value
Number
Average Value
LOANS ORIGINATED
7
$93,056
21
$96,588
94
$86,336
10
$25,622
6
$62,785
APPLICATIONS APPROVED, NOT ACCEPTED
0
$0
3
$88,133
11
$94,996
1
$81,480
0
$0
APPLICATIONS DENIED
0
$0
6
$66,492
22
$80,560
4
$17,372
0
$0
APPLICATIONS WITHDRAWN
1
$35,060
2
$117,430
15
$92,061
1
$28,370
1
$80,350
FILES CLOSED FOR INCOMPLETENESS
0
$0
1
$62,590
3
$94,063
0
$0
0
$0
Aggregated Statistics For Year 2002 (Based on 1 partial tract)
A) FHA, FSA/RHS & VA Home Purchase Loans
B) Conventional Home Purchase Loans
C) Refinancings
D) Home Improvement Loans
F) Non-occupant Loans on < 5 Family Dwellings (A B C & D)
Number
Average Value
Number
Average Value
Number
Average Value
Number
Average Value
Number
Average Value
LOANS ORIGINATED
2
$100,180
7
$63,283
17
$88,268
3
$17,123
2
$29,455
APPLICATIONS APPROVED, NOT ACCEPTED
0
$0
2
$27,820
2
$67,665
1
$25,900
0
$0
APPLICATIONS DENIED
0
$0
3
$36,807
7
$71,414
2
$7,045
0
$0
APPLICATIONS WITHDRAWN
0
$0
1
$91,780
4
$68,980
0
$0
0
$0
FILES CLOSED FOR INCOMPLETENESS
0
$0
0
$0
1
$36,860
0
$0
0
$0
Aggregated Statistics For Year 2001 (Based on 1 partial tract)
A) FHA, FSA/RHS & VA Home Purchase Loans
B) Conventional Home Purchase Loans
C) Refinancings
D) Home Improvement Loans
F) Non-occupant Loans on < 5 Family Dwellings (A B C & D)
Number
Average Value
Number
Average Value
Number
Average Value
Number
Average Value
Number
Average Value
LOANS ORIGINATED
2
$114,905
8
$64,355
18
$82,763
3
$12,380
1
$46,250
APPLICATIONS APPROVED, NOT ACCEPTED
0
$0
2
$43,615
5
$43,544
1
$9,820
0
$0
APPLICATIONS DENIED
0
$0
5
$36,458
10
$52,808
3
$12,760
1
$22,480
APPLICATIONS WITHDRAWN
0
$0
1
$61,760
3
$53,457
1
$12,100
0
$0
FILES CLOSED FOR INCOMPLETENESS
0
$0
0
$0
0
$0
0
$0
0
$0
Aggregated Statistics For Year 2000 (Based on 1 partial tract)
A) FHA, FSA/RHS & VA Home Purchase Loans
B) Conventional Home Purchase Loans
C) Refinancings
D) Home Improvement Loans
F) Non-occupant Loans on < 5 Family Dwellings (A B C & D)
Number
Average Value
Number
Average Value
Number
Average Value
Number
Average Value
Number
Average Value
LOANS ORIGINATED
1
$76,270
13
$53,998
7
$51,024
3
$14,137
2
$24,975
APPLICATIONS APPROVED, NOT ACCEPTED
0
$0
2
$23,055
3
$39,323
1
$23,190
0
$0
APPLICATIONS DENIED
0
$0
7
$38,503
8
$51,549
3
$8,300
1
$40,560
APPLICATIONS WITHDRAWN
0
$0
1
$45,960
4
$40,412
0
$0
0
$0
FILES CLOSED FOR INCOMPLETENESS
0
$0
0
$0
1
$23,760
0
$0
0
$0
Aggregated Statistics For Year 1999 (Based on 2 partial tracts)
A) FHA, FSA/RHS & VA Home Purchase Loans
B) Conventional Home Purchase Loans
C) Refinancings
D) Home Improvement Loans
F) Non-occupant Loans on < 5 Family Dwellings (A B C & D)
Detailed PMIC statistics for the following Tracts:4009.03
, 4009.52
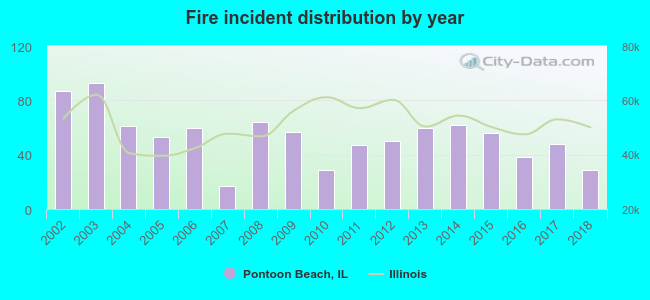
2002 - 2018 National Fire Incident Reporting System (NFIRS) incidents
According to the data from the years 2002 - 2018 the average number of fires per year is 54. The highest number of reported fires - 93 took place in 2003, and the least - 17 in 2007. The data has a dropping trend.
When looking into fire subcategories, the most incidents belonged to: Structure Fires (50.9%), and Outside Fires (26.7%).
Fire incident types reported to NFIRS in Pontoon Beach, IL
#11 on the list of "Top 101 cities with the largest city-data.com crime index decrease from 2002 to 2012 (population 5,000+)"
#62 on the list of "Top 101 cities with the lowest number of assaults per 100,000 residents (population 5,000+)"
#78 on the list of "Top 101 cities with the largest city-data.com crime index decrease from 2011 to 2012 (population 5,000+)"
#97 on the list of "Top 101 cities with largest percentage of females in industries: transportation and warehousing (population 5,000+)"
#12 on the list of "Top 101 counties with the largest decrease in the number of infant deaths per 1000 residents 2000-2006 to 2007-2013 (pop. 50,000+)"
#18 on the list of "Top 101 counties with the lowest number of infant deaths per 1000 residents 2007-2013 (pop. 50,000+)"
#26 on the list of "Top 101 counties with the highest Particulate Matter (PM2.5) Annual air pollution readings in 2012 (µg/m3)"
#67 on the list of "Top 101 counties with the lowest percentage of residents relocating from foreign countries between 2010 and 2011"


 Recent articles from our blog. Our writers, many of them Ph.D. graduates or candidates, create easy-to-read articles on a wide variety of topics.

 (12.0 miles


 According to the data from the years 2002 - 2018 the average number of fires per year is 54. The highest number of reported fires - 93 took place in 2003, and the least - 17 in 2007. The data has a dropping trend.
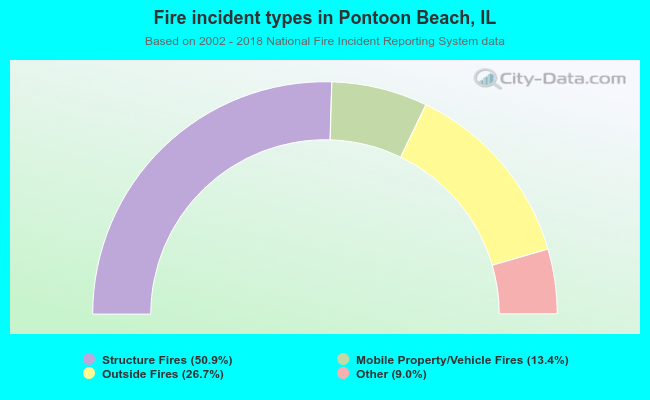 When looking into fire subcategories, the most incidents belonged to: Structure Fires (50.9%), and Outside Fires (26.7%).