San Francisco, California
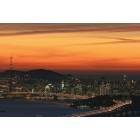
San Francisco: An evening view of San Francisco from the Berkeley/Oakland hills, directly above the Caldecott Tunnel.
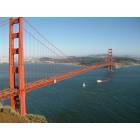
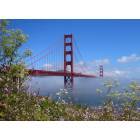
San Francisco: The north approach to the Golden Gate Bridge.

San Francisco: San Francisco from Twin Peaks. This location is the highest elevation in San Francisco and has stunning 360 degree views.
San Francisco: San Francisco
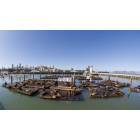
San Francisco: Pier39
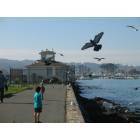
San Francisco: The Birds at the Marina
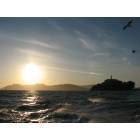
San Francisco: Alcatraz at sunset from San Francisco Bay
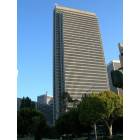
San Francisco: Embarcadero 4

San Francisco: San Francisco: Baker Beach

San Francisco: Golden Gate Bridge Crashing Waves
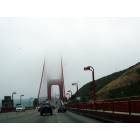
San Francisco: Fog over the Golden Gate
- see
288
more - add
your
Submit your own pictures of this city and show them to the world
- OSM Map
- General Map
- Google Map
- MSN Map
Population change since 2000: +4.1%
 |
| Males: 414,691 | |
| Females: 393,746 |
| Median resident age: | 40.4 years |
| California median age: | 37.9 years |
Zip codes: 94102, 94103, 94104, 94105, 94107, 94108, 94109, 94110, 94111, 94112, 94114, 94115, 94116, 94117, 94118, 94121, 94122, 94123, 94124, 94127, 94129, 94130, 94131, 94132, 94133, 94134, 94158.
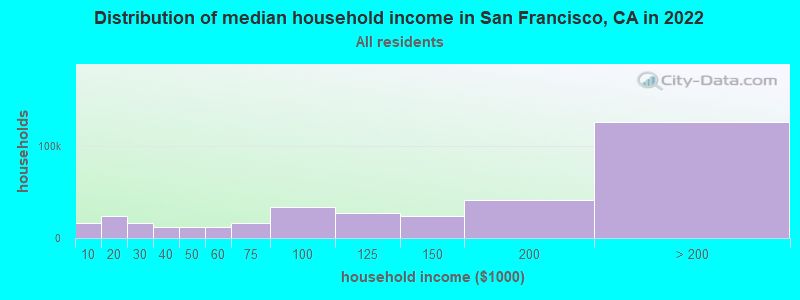
San Francisco Zip Code Map| San Francisco: | $136,692 |
| CA: | $91,551 |
Estimated per capita income in 2022: $89,736 (it was $34,556 in 2000)
San Francisco city income, earnings, and wages data
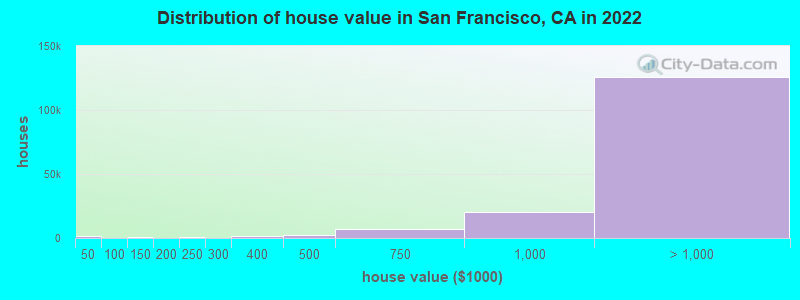
Estimated median house or condo value in 2022: over $1,000,000 (it was $422,700 in 2000)
| San Francisco: | over $1,000,000 |
| CA: | $715,900 |
Mean prices in 2022: all housing units: over $1,000,000; detached houses: over $1,000,000; townhouses or other attached units: over $1,000,000; in 2-unit structures: over $1,000,000; in 3-to-4-unit structures: over $1,000,000; in 5-or-more-unit structures: over $1,000,000; mobile homes: $410,526
Median gross rent in 2022: $2,308.
(7.7% for White Non-Hispanic residents, 25.5% for Black residents, 13.0% for Hispanic or Latino residents, 31.7% for American Indian residents, 10.1% for Native Hawaiian and other Pacific Islander residents, 17.4% for other race residents, 8.0% for two or more races residents)
Detailed information about poverty and poor residents in San Francisco, CA


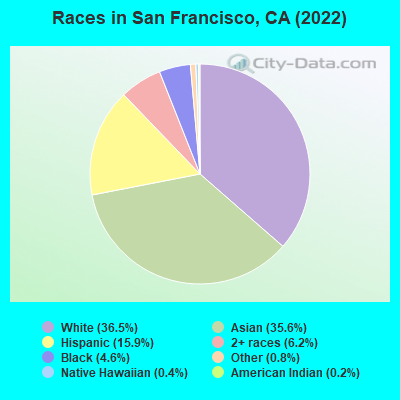
- 295,34336.5%White alone
- 287,42135.6%Asian alone
- 128,16215.9%Hispanic
- 49,7596.2%Two or more races
- 36,7944.6%Black alone
- 6,2520.8%Other race alone
- 3,2750.4%Native Hawaiian and Other
Pacific Islander alone - 1,4310.2%American Indian alone
According to our research of California and other state lists, there were 836 registered sex offenders living in San Francisco, California as of April 16, 2024.
The ratio of all residents to sex offenders in San Francisco is 1,042 to 1.
The ratio of registered sex offenders to all residents in this city is lower than the state average.
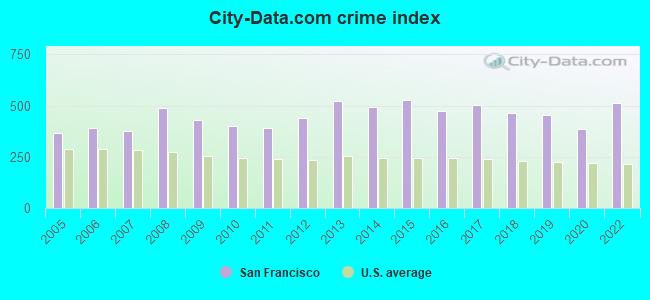
The City-Data.com crime index weighs serious crimes and violent crimes more heavily. Higher means more crime, U.S. average is 246.1. It adjusts for the number of visitors and daily workers commuting into cities.
- means the value is smaller than the state average.- means the value is about the same as the state average.
- means the value is bigger than the state average.
- means the value is much bigger than the state average.
Crime rate in San Francisco detailed stats: murders, rapes, robberies, assaults, burglaries, thefts, arson
Full-time law enforcement employees in 2021, including police officers: 2,857 (2,129 officers - 1,820 male; 309 female).
| Officers per 1,000 residents here: | 2.46 |
| California average: | 2.30 |
 Recent articles from our blog. Our writers, many of them Ph.D. graduates or candidates, create easy-to-read articles on a wide variety of topics.


Latest news from San Francisco, CA collected exclusively by city-data.com from local newspapers, TV, and radio stations
Ancestries: Irish (3.4%), English (2.7%), European (2.7%), German (2.6%), Italian (1.9%), American (1.3%).
Current Local Time: PST time zone
Elevation: 63 feet
Land area: 46.7 square miles.
Population density: 17,313 people per square mile (very high).
287,758 residents are foreign born (21.8% Asia, 6.0% Latin America, 4.4% Europe).
| This city: | 35.6% |
| California: | 26.5% |
Median real estate property taxes paid for housing units with mortgages in 2022: $10,001 (0.7%)
Median real estate property taxes paid for housing units with no mortgage in 2022: $5,164 (0.4%)
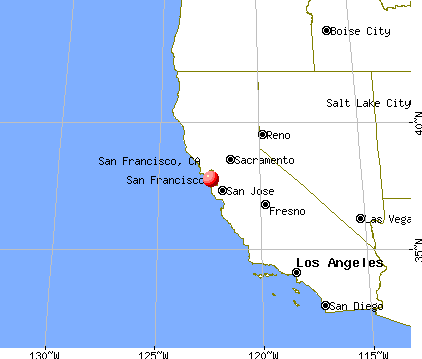
Nearest city with pop. 1,000,000+: Los Angeles, CA  (341.0 miles , pop. 3,694,820).
Nearest cities:
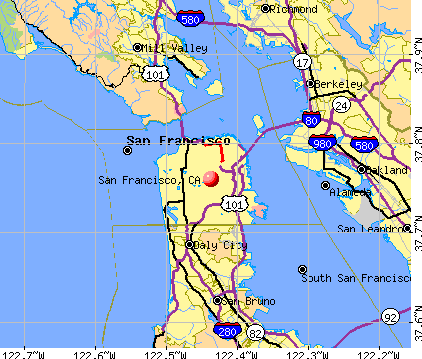
), ), ), )Latitude: 37.76 N, Longitude: 122.44 W
Daytime population change due to commuting: +137,996 (+17.1%)
Workers who live and work in this city: 382,894 (82.3%)
Property values in San Francisco, CA
Detailed articles:
- San Francisco: Introduction
- San Francisco Basic Facts
- San Francisco: Communications
- San Francisco: Convention Facilities
- San Francisco: Economy
- San Francisco: Education and Research
- San Francisco: Geography and Climate
- San Francisco: Health Care
- San Francisco: History
- San Francisco: Municipal Government
- San Francisco: Population Profile
- San Francisco: Recreation
- San Francisco: Transportation
San Francisco tourist attractions:
- Alcatraz Island In San Francisco, California
- Aquarium of the Bay in San Francisco, California
- AT & T Park in San Francisco, California
- Cable Cars, a San Francisco Tradition
- Candlestick Park - San Francisco, California - Home field for the San Francisco 49ers NFL football team
- Fisherman's Wharf On Monterey Harbor In San Fransisco, California
- Golden Gate Bridge - San Francisco, California - Enduring Symbol of San Francisco
- Golden Gate National Recreation Area an Urban Oasis
- International Children's Art Museum World Trade Center - San Francisco, California - Youthful Art Showcased in an Historic Building
- Muir Woods National Monument California
- Holiday Inn Civic Center (San Francisco)
- Francisco Bay Inn
- Holiday Inn San Francisco Golden Gateway
- Club Quarters San Francisco
- 1.5-mile Coastal Trail
- 49 Geary Street Art Galleries
- 450 Sutter Building
- Alamo Square
- Allyne Park
- American Conservatory Theater
- Anchor Brewing Company
- Angel Island Immigration Station
- Hyatt Regency San Francisco
- Cavalia
- Castro Theatre
- Cartoon Art Museum
- Candlestick Point State Recreation Area
- Camera Obscura
- California Historical Society
- California Academy of Sciences
- Cable Car Museum
- Buddha's Universal Church
- Brooks Brothers
- Bonhams & Butterfield
- Blue & Gold Fleet-PIER 39
- Bliss Bar
- Blazing Saddles
- Biscuits and Blues
- Bill Graham Civic Auditorium
- W San Francisco
- Hotel Drisco, A Joie de Vivre Hotel
- Hotel Nikko San Francisco
- Hotel Palomar San Francisco a Kimpton Hotel
- China Beach
- Chinese Cultural Center
- Chinese Historical Society of America
- Church of St. John Coltrane
- City Lights Booksellers
- City Segway Tours
- Civic Center
- Don Edwards San Francisco Bay Wildlife Refuge
- JW Marriott San Francisco Union Square
- The Westin St. Francis
- Eccentrics of San Francisco's Barbary Coast
- Ecology Trail
- East Bay
- Electric Bike Tour over the Golden Gate
- Embarcadero Branch YMCA
- Embarcadero Center SkyDeck
- Embarcadero Center
- Esplanade
- Evelyn's Antique Chinese Furniture, Inc
- Ferry Building Marketplace
- Ferry Plaza Farmer's Market
- Filbert Steps
- Fillmore Street
- Finding San Francisco: A Scavenger Tour
- Fisherman's Wharf
- Fort Funston
- Fort Mason Center
- Fort Mason
- Francis "Lefty" O'Doul Bridge
- Cliff House
- Cobb's Comedy Club
- Columbus Avenue
- Concourse Exhibition Center
- Conservatory of Flowers
- Contemporary Jewish Museum of San Francisco
- Corona Heights
- Cow Hollow
- Cow Palace
- Crissy Field
- Defenestration Building
- Doggie Diner
- Dolores Heights
- Ghirardelli Chocolate Manufactory & Caffe
- Ghirardelli Square
- Glide Memorial United Methodist Church
- Gold Rush City
- Gold Country
- Kong Chow Temple
- Konko Church of San Francisco
- Land's End
- Legion of Honor
- Li Po Cocktail Lounge
- Lincoln Park Golf Course
- Lincoln Park
- Lone Star Saloon
- Lake Merced
- Labyrinth of Cultures
- Lafayette Park
- Mexican Museum
- Metreon Sony Entertainment Center
- Market Street
- Market Street Railway Museum
- Marines Memorial Theater
- Marine Mammal Center
- Marin Headlands
- Marina Green
- Marina District
- Maiden Lane
- Macy's
- Lyon Street
- Macondray Lane
- Lou's Pier 47
- Louise M. Davies Symphony Hall
- Le Meridien San Francisco
- InterContinental San Francisco
- Neptune Society Columbarium
- The Tonga Room and Hurricane Bar
- Nickies
- Nob Hill
- Noe Valley
- Harbor Court Hotel - a Kimpton Hotel
- Palace Hotel
- Mission Bay Conference Center at UCSF
- Mission Cliffs
- Mission District
- Mission Dolores
- Jazz at Pearl's
- Jefferson Airplane House
- Juan Bautista de Anza National Historic Trail
- Kabuki Springs and Spa
- Kenneth Cole
- Kezar Stadium
- Kite Hill Open Space
- Morrison Planetarium
- Moscone Center
- Mount Davidson
- Omni San Francisco Hotel
- The Huntington Hotel & Nob Hill Spa
- The Wharf Inn
- Golden Gate Park
- Golden Gate Promenade
- Golden Horizon tours
- Gordon Biersch
- Musee Mecanique
- Museo Italo Americano
- Museum of Craft and Folk Art
- Museum of Russian Culture
- Museum of the African Diaspora
- National AIDS Memorial Grove
- Natural History Museum
- Grand Pacheco Stairway
- Grateful Dead House
- Greenwich Steps
- Aquatic Park
- Audium
- Badlands
- Baker Beach
- Balclutha
- Basic Brown Bear Factory
- Bay Area Ridge Trail
- Bay Area Theatresports (BATS)
- Bay City Bike Rentals and Tours
- Beach Blanket Babylon
- Beach Chalet
- Bernal Heights
- Bike and Roll San Francisco
- Campton Place Hotel
- de Young Museum
- W San Francisco
- Clift Hotel San Francisco
- Holy Virgin Cathedral
- Hyde Street Pier Historic Waterfront
- Japan Center
- Japantown
- Sir Francis Drake Hotel - a Kimpton Hotel
- North Beach
- Northpoint Health Club
- San Francisco Art Institute
- San Francisco Ballet
- San Francisco Bay Bridge
- San Francisco Bay Trail
- San Francisco Bay
- San Francisco Botanical Garden at Strybing Arboretum
- San Francisco Brewing Company
- San Francisco Convention and Visitors Bureau
- San Francisco History Room and Archives
- San Francisco Maritime Museum
- San Francisco Maritime National Historical Park
- San Francisco National Cemetery
- San Francisco Opera
- San Francisco Oyster Fest
- San Francisco Public Library
- San Francisco Performing Arts Library and Museum
- Courtyard San Francisco Downtown
- Hotel Triton- a Kimpton Hotel
- Marriott San Francisco Fisherman's Wharf
- San Francisco Railway Museum
- San Francisco Symphony
- San Francisco Zen Center
- Sanchez Street
- Saturn Steps
- Scenic 49 Mile Drive
- Sea Cliff
- Peninsula
- Philharmonia Baroque Orchestra
- Pioneer's Monument
- Pioneer Park
- Potrero Hill
- Press Club
- Ocean Beach
- Punch Line
- Queen Anne Victorians
- Red Vic
- Richmond District
- Grand Hyatt San Francisco
- Pier Fishing in California - Pier 7
- Pier 39
- Pier 23
- San Francisco Marriott Union Square
- Westin San Francisco Market Street
- Randall Museum
- Presidio National Park
- Presidio Army Museum
- San Francisco Marriott Marquis
- Painted Ladies
- Palace of Fine Arts
- Octagon House
- Old Cathedral of St. Mary
- Old United States Mint
- Orocco
- Pacific Heights
- Pacific Heritage Museum of San Francisco
- Pacific Union Club
- Theatre Rhinoceros
- The Wave Organ
- The Wax Museum at Fisherman's Wharf
- Villa Florence Hotel
- Tin How Temple
- Hotel Griffon
- Wolf Ridge Loop
- Women's Building Mural
- Hyatt at Fisherman's Wharf
- SS. Peter and Paul Church
- St. Mary's Cathedral
- Steinhart Aquarium
- Stockton Street
- Storyville
- Stow Lake
- Super Sightseeing Tours
- Sutro Tower
- Swedenborgian Church
- Tank Hill
- Tattoo Art Museum
- Teatro ZinZanni
- Telegraph Hill
- Telephone Pioneers Communications Museum
- Temple Emanu-El
- The Beat Museum
- The Cannery
- The Castro
- The Coastal Trail
- The Embarcadero
- The Flood Building
- The Magic Theatre
- The Mechanics Monument
- The Mint Karaoke Lounge
- The Mission
- Yerba Buena Center for the Arts/Yerba Buena Gardens
- Yerba Buena Gardens
- Yerba Buena Ice Skating Center
- Angel Island State Park
- Asian Art Museum
- Chinatown
- Coit Tower
- De Young Museum
- Courtyard by Marriott Fisherman's Wharf
- Hilton San Francisco Union Square
- Hotel Abri - Union Square, A Larkspur Collection Hotel
- Four Seasons Hotel
- Sheraton Fisherman's Wharf Hotel
- The Kensington Park Hotel
- Grace Cathedral
- Hotel Adagio
- InterContinental Mark Hopkins
- Japanese Tea Garden
- Lombard Street
- Mandarin Oriental
- Vermont Street
- Vesuvio Cafe
- Victorian Home Walk
- North Beach Neighborhood
- Vulcan Steps
- Walt Disney Family Museum
- Walter S. Johnson Park
- War Memorial Opera House
- Warfield Theater
- Transamerica Pyramid
- Treasure Island
- Twin Peaks
- Union Street
- Upper Fillmore
- Upper Grant Avenue
- Upper Market
- USS Pampanito
- St. Regis Hotel
- The Exploratorium
- The Ritz- Carlton
- Union Square
- Roxie Cinema
- Rrazz Room
- Russian Hill
- Renaissance Stanford Court
- Serrano Hotel - A Kimpton Hotel
- Parc 55 Wyndham
- Prescott Hotel - A Kimpton Hotel
- Society of California Pioneers
- SoMa (South of Market Street)
- South Park
- S.S. Jeremiah O'Brien
- Sacramento Street
- Hotel Whitcomb
- Hotel Kabuki, a Joie de Vivre hotel
- The Inn at Union Square
- Hotel Frank
- Galleria Park, a Joie de Vivre hotel
- Handlery Union Square Hotel
- Hilton San Francisco Financial District
- White Swan Inn
- Nob Hill Motor Inn
- Best Western Tuscan Inn Fisherman's Wharf - a Kimpton Hotel
- Radisson Hotel Fisherman's Wharf
- St. Regis Hotel, San Francisco
- Best Western Civic Center Motor Inn
- Hotel Union Square
- Hotel Diva
- Holiday Inn Express Hotel & Suites San Francisco Fisherman's Wharf
- Larkspur Hotel Union Square
- Laurel Inn, a Joie de Vivre hotel
- Hotel Rex, a Joie de Vivre hotel
- Executive Hotel Vintage Court
- San Francisco Zoo - San Francisco, California - old zoo and tourist attraction in northern California
- San Francisco International Airport - San Francisco CA San Francisco Airport Flights
- San Francisco Museum of Modern Art - San Francisco, California - A West Coast Leader in Contemporary Art
- Zeum - San Francisco, California - Children's Museum with an Historic Carousel
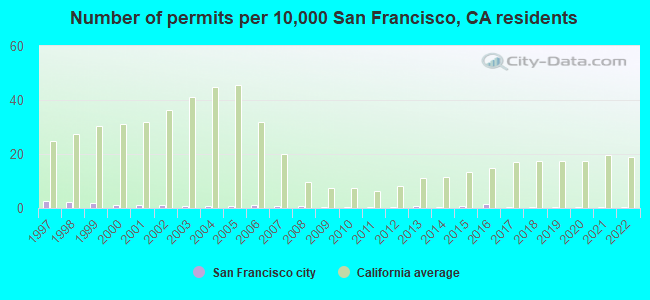
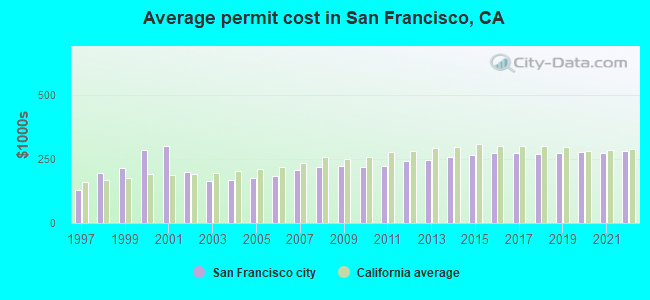
Single-family new house construction building permits:
- 2022: 38 buildings, average cost: $282,400
- 2021: 33 buildings, average cost: $275,200
- 2020: 21 buildings, average cost: $277,700
- 2019: 22 buildings, average cost: $276,100
- 2018: 28 buildings, average cost: $271,200
- 2017: 43 buildings, average cost: $273,900
- 2016: 123 buildings, average cost: $273,000
- 2015: 64 buildings, average cost: $266,400
- 2014: 35 buildings, average cost: $259,700
- 2013: 54 buildings, average cost: $247,900
- 2012: 22 buildings, average cost: $241,300
- 2011: 31 buildings, average cost: $224,600
- 2010: 22 buildings, average cost: $221,400
- 2009: 17 buildings, average cost: $223,500
- 2008: 57 buildings, average cost: $218,300
- 2007: 55 buildings, average cost: $208,800
- 2006: 95 buildings, average cost: $183,900
- 2005: 51 buildings, average cost: $176,300
- 2004: 58 buildings, average cost: $170,400
- 2003: 63 buildings, average cost: $164,600
- 2002: 82 buildings, average cost: $201,200
- 2001: 94 buildings, average cost: $299,700
- 2000: 81 buildings, average cost: $285,700
- 1999: 146 buildings, average cost: $216,500
- 1998: 178 buildings, average cost: $193,800
- 1997: 189 buildings, average cost: $129,400
| Here: | 3.5% |
| California: | 5.1% |

Population change in the 1990s: +53,984 (+7.5%).
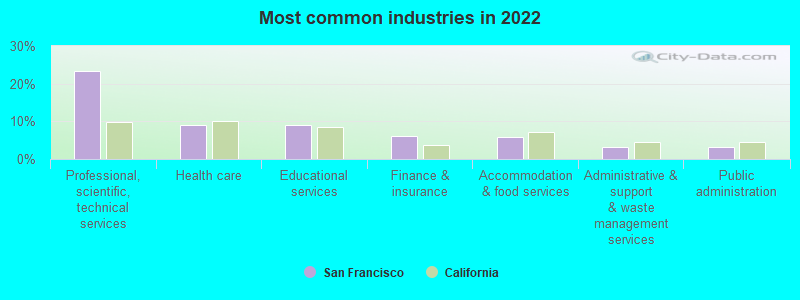
- Professional, scientific, technical services (23.5%)
- Health care (9.1%)
- Educational services (8.9%)
- Finance & insurance (6.0%)
- Accommodation & food services (5.7%)
- Administrative & support & waste management services (3.3%)
- Public administration (3.3%)

- Professional, scientific, technical services (25.7%)
- Finance & insurance (6.7%)
- Educational services (6.1%)
- Accommodation & food services (5.6%)
- Health care (5.4%)
- Construction (5.2%)
- Other transportation, support activities, couriers (4.0%)
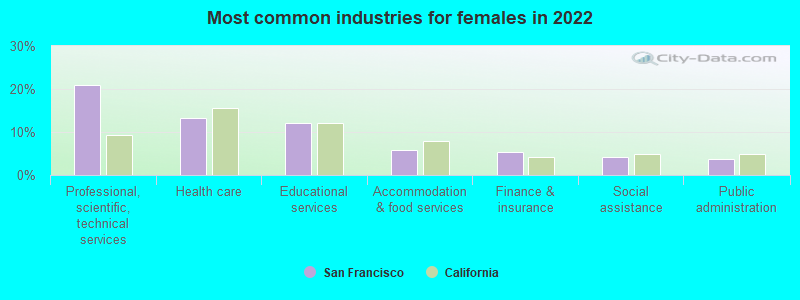
- Professional, scientific, technical services (20.9%)
- Health care (13.3%)
- Educational services (12.2%)
- Accommodation & food services (5.9%)
- Finance & insurance (5.3%)
- Social assistance (4.2%)
- Public administration (3.6%)
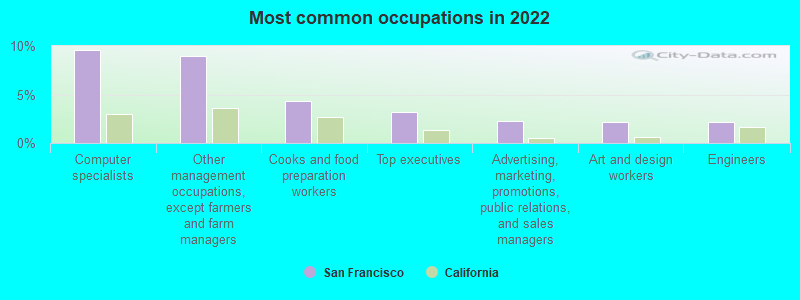
- Computer specialists (9.5%)
- Other management occupations, except farmers and farm managers (9.0%)
- Cooks and food preparation workers (4.3%)
- Top executives (3.2%)
- Advertising, marketing, promotions, public relations, and sales managers (2.2%)
- Art and design workers (2.2%)
- Engineers (2.2%)
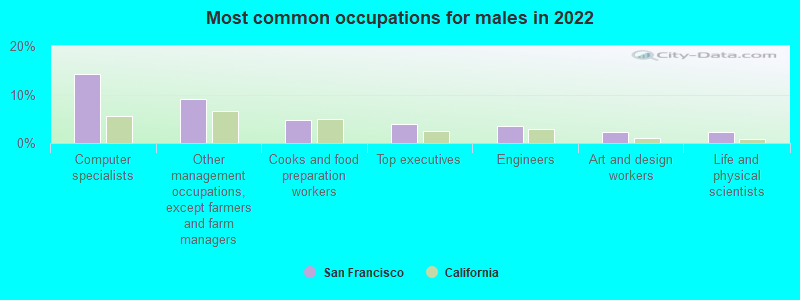
- Computer specialists (14.2%)
- Other management occupations, except farmers and farm managers (9.1%)
- Cooks and food preparation workers (4.7%)
- Top executives (3.9%)
- Engineers (3.5%)
- Art and design workers (2.2%)
- Life and physical scientists (2.2%)
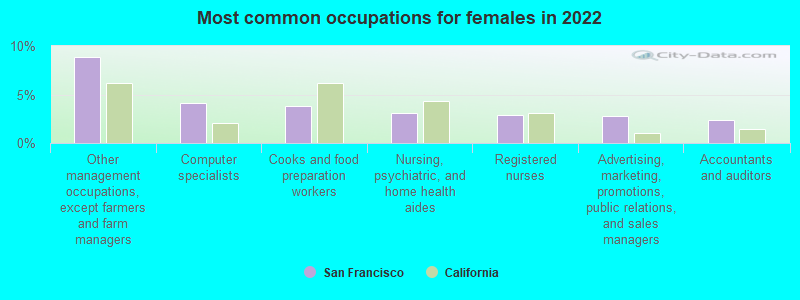
- Other management occupations, except farmers and farm managers (8.9%)
- Computer specialists (4.1%)
- Cooks and food preparation workers (3.9%)
- Nursing, psychiatric, and home health aides (3.1%)
- Registered nurses (2.9%)
- Advertising, marketing, promotions, public relations, and sales managers (2.8%)
- Accountants and auditors (2.3%)
Average climate in San Francisco, California
Based on data reported by over 4,000 weather stations


|
|

(lower is better)
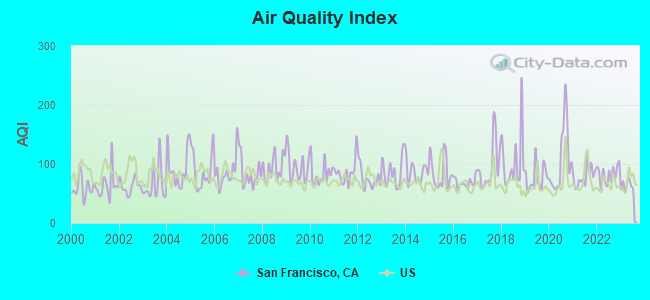
Air Quality Index (AQI) level in 2023 was 63.4. This is about average.
| City: | 63.4 |
| U.S.: | 72.6 |
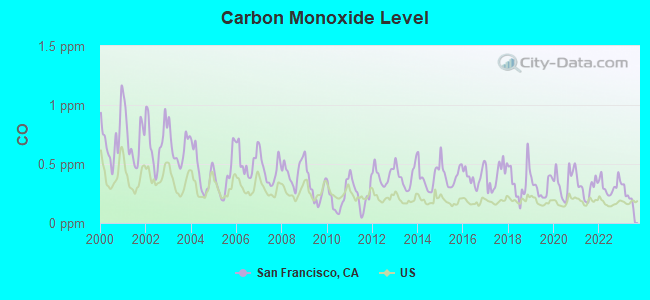
Carbon Monoxide (CO) [ppm] level in 2023 was 0.236. This is about average. Closest monitor was 1.5 miles away from the city center.
| City: | 0.236 |
| U.S.: | 0.251 |
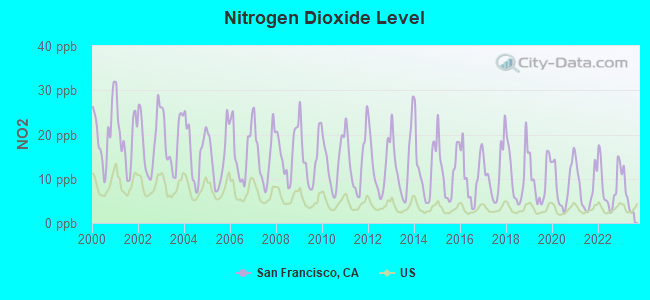
Nitrogen Dioxide (NO2) [ppb] level in 2023 was 6.37. This is worse than average. Closest monitor was 1.5 miles away from the city center.
| City: | 6.37 |
| U.S.: | 5.11 |
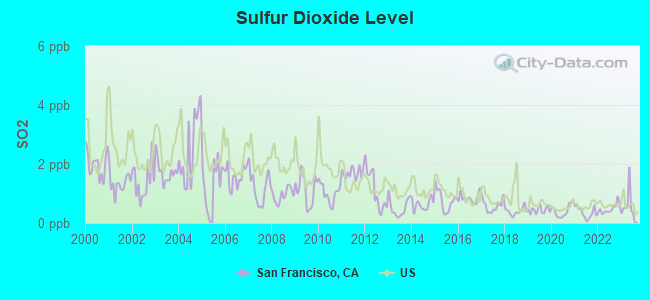
Sulfur Dioxide (SO2) [ppb] level in 2023 was 0.650. This is significantly better than average. Closest monitor was 1.6 miles away from the city center.
| City: | 0.650 |
| U.S.: | 1.515 |
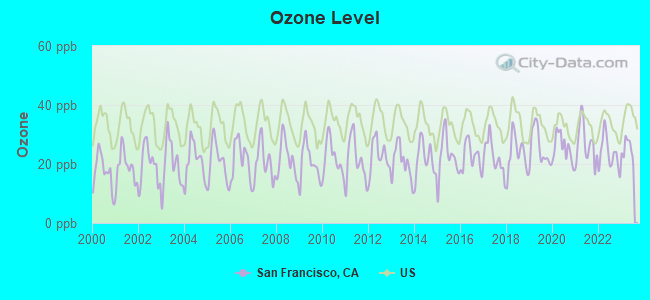
Ozone [ppb] level in 2023 was 25.0. This is better than average. Closest monitor was 1.9 miles away from the city center.
| City: | 25.0 |
| U.S.: | 33.3 |
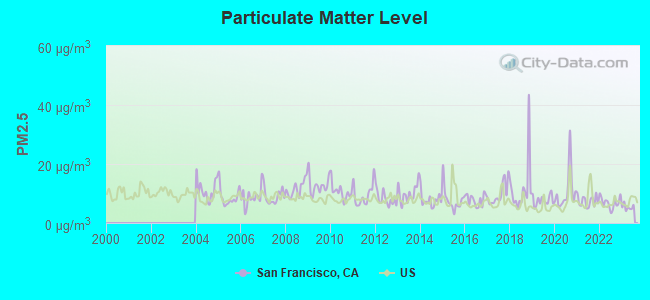
Particulate Matter (PM2.5) [µg/m3] level in 2023 was 5.35. This is significantly better than average. Closest monitor was 2.1 miles away from the city center.
| City: | 5.35 |
| U.S.: | 8.11 |
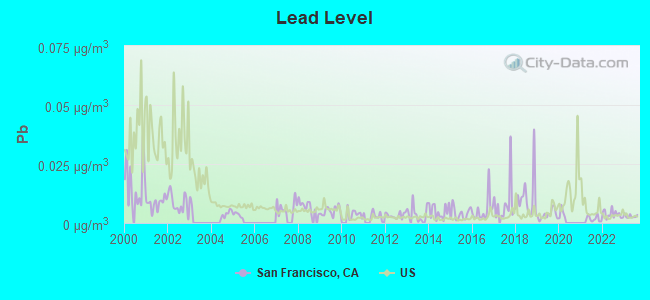
Lead (Pb) [µg/m3] level in 2023 was 0.00290. This is significantly better than average. Closest monitor was 1.6 miles away from the city center.
| City: | 0.00290 |
| U.S.: | 0.00931 |
Earthquake activity:
San Francisco-area historical earthquake activity is significantly above California state average. It is 7368% greater than the overall U.S. average.On 4/18/1906 at 13:12:21, a magnitude 7.9 (7.9 UK, Class: Major, Intensity: VIII - XII) earthquake occurred 34.9 miles away from the city center, causing $524,000,000 total damage
On 10/18/1989 at 00:04:15, a magnitude 7.1 (6.5 MB, 7.1 MS, 6.9 MW, 7.0 ML) earthquake occurred 58.0 miles away from the city center, causing 62 deaths (62 shaking deaths) and 3757 injuries, causing $1,305,032,704 total damage
On 11/4/1927 at 13:51:53, a magnitude 7.5 (7.5 UK) earthquake occurred 211.8 miles away from San Francisco center
On 7/21/1952 at 11:52:14, a magnitude 7.7 (7.7 UK) earthquake occurred 270.3 miles away from San Francisco center, causing $50,000,000 total damage
On 1/31/1922 at 13:17:28, a magnitude 7.6 (7.6 UK) earthquake occurred 263.1 miles away from the city center
On 4/25/1992 at 18:06:04, a magnitude 7.2 (6.3 MB, 7.1 MS, 7.2 MW, 7.1 MW, Depth: 9.4 mi) earthquake occurred 199.4 miles away from San Francisco center, causing $75,000,000 total damage
Magnitude types: body-wave magnitude (MB), local magnitude (ML), surface-wave magnitude (MS), moment magnitude (MW)
Natural disasters:
The number of natural disasters in San Francisco County (6) is a lot smaller than the US average (15).Major Disasters (Presidential) Declared: 4
Emergencies Declared: 1
Causes of natural disasters: Floods: 3, Winter Storms: 2, Earthquake: 1, Hurricane: 1, Landslide: 1, Storm: 1, Other: 1 (Note: some incidents may be assigned to more than one category).
Main business address for: IEA INCOME FUND X LP (SERVICES-EQUIPMENT RENTAL & LEASING, NEC), METRIC PARTNERS GROWTH SUITE INVESTORS LP (HOTELS & MOTELS), DEL MONTE FOODS CO (CANNED, FRUITS, VEG & PRESERVES, JAMS & JELLIES), ATEL CAPITAL EQUIPMENT FUND X LLC (SERVICES-EQUIPMENT RENTAL & LEASING, NEC), TEXTAINER EQUIPMENT INCOME FUND III L P (SERVICES-EQUIPMENT RENTAL & LEASING, NEC), COMMERCE ONE INC / DE/ (SERVICES-COMPUTER INTEGRATED SYSTEMS DESIGN), PLUMTREE SOFTWARE INC (SERVICES-COMPUTER PROGRAMMING SERVICES), MARKETWATCH COM INC (NEWSPAPERS: PUBLISHING OR PUBLISHING & PRINTING) and 60 other public companies.
Hospitals in San Francisco:
- CALIFORNIA PACIFIC MEDICAL CENTER (provides emergency services, 3700 CALIFORNIA STREET)
- CALIFORNIA PACIFIC MEDICAL CTR - ST. LUKE'S CAMPUS (Voluntary non-profit - Church, provides emergency services, 3555 CESAR CHAVEZ STREET)
- CALIFORNIA PACIFIC MEDICAL CTR-PACIFIC CAMPUS HOSP (Voluntary non-profit - Private, provides emergency services, 2333 BUCHANAN STREET)
- CAMEO ICF/DDH HOME (29 CAMEO WAY)
- HOSPICE BY THE BAY (1902 VAN NESS AVENUE, 2ND FLOOR)
- KAISER FOUNDATION HOSPITAL - SAN FRANCISCO (Government - Hospital District or Authority, provides emergency services, 2425 GEARY BLVD)
- LAGUNA HONDA HOSPITAL & REHABILITATION CENTER (Voluntary non-profit - Other, 375 LAGUNA HONDA BLVD)
- SAINT FRANCIS MEMORIAL HOSPITAL (Voluntary non-profit - Private, 900 HYDE ST)
- SAN FRANCISCO GENERAL HOSPITAL (Government - Local, 1001 POTRERO AVENUE)
- ST MARY'S MEDICAL CENTER (Voluntary non-profit - Private, 450 STANYAN ST)
- UCSF MEDICAL CENTER (Voluntary non-profit - Other, 505 PARNASSUS AVE, BOX 0296)
Airports and heliports located in San Francisco:
- San Francisco International Airport (SFO) (Runways: 5, Commercial Ops: 335,428, Air Taxi Ops: 80,914, Itinerant Ops: 2,391, Local Ops: 10,260, Military Ops: 2,973)
- Alcatraz Heliport (CA27)
- Hall Of Justice Heliport (CA26)
- Police Pistol Range Heliport (16CA)
- San Francisco Va Medical Center Heliport (CN02)
- Ucsf Medical Center At Mission Bay Heliport (18CN)
Amtrak stations:
- SAN FRANCISCO SHOPPING (835 MARKET ST.) - Bus Station . Services: fully wheelchair accessible, public payphones, snack bar, paid short-term parking, paid long-term parking, call for taxi service, public transit connection.
- SAN FRANCISCO-FINANCIAL (CALIFORNIA & DRUMM STS.) - Bus Station . Services: fully wheelchair accessible, public payphones, full-service food facilities, paid short-term parking, paid long-term parking, call for taxi service, public transit connection.
- SAN FRANCISCO (31 THE EMBARCADERO) - Bus Station . Services: ticket office, fully wheelchair accessible, enclosed waiting area, public restrooms, public payphones, full-service food facilities, paid short-term parking, call for taxi service, public transit connection.
- SAN FRANCISCO FISHERMANS (PIER 39) - Bus Station . Services: fully wheelchair accessible, public payphones, full-service food facilities, paid short-term parking, paid long-term parking, call for taxi service, public transit connection.
Biggest Colleges/Universities in San Francisco:
- San Francisco State University (Full-time enrollment: 24,644; Location: 1600 Holloway Ave; Public; Website: www.sfsu.edu; Offers Doctor's degree)
- City College of San Francisco (Full-time enrollment: 17,569; Location: 50 Phelan Ave; Public; Website: www.ccsf.edu)
- Academy of Art University (Full-time enrollment: 12,352; Location: 79 New Montgomery; Private, for-profit; Website: www.academyart.edu; Offers Master's degree)
- University of San Francisco (Full-time enrollment: 9,190; Location: 2130 Fulton St; Private, not-for-profit; Website: www.usfca.edu/; Offers Doctor's degree)
- Golden Gate University-San Francisco (Full-time enrollment: 1,816; Location: 536 Mission Street; Private, not-for-profit; Website: www.ggu.edu; Offers Doctor's degree)
- California College of the Arts (Full-time enrollment: 1,738; Location: 1111 Eighth Street; Private, not-for-profit; Website: www.cca.edu; Offers Master's degree)
- University of California-San Francisco (Full-time enrollment: 1,450; Location: 500 Parnassus Ave; Public; Website: www.ucsf.edu; Offers Doctor's degree)
- The Art Institute of California-Argosy University San Francisco (Full-time enrollment: 1,341; Location: 1170 Market St; Private, for-profit; Website: www.artinstitutes.edu/san-francisco/; Offers Master's degree)
- Heald College-San Francisco (Full-time enrollment: 1,230; Location: 875 Howard Street Suite 100; Private, for-profit; Website: www.heald.edu)
- California Institute of Integral Studies (Full-time enrollment: 1,070; Location: 1453 Mission Street; Private, not-for-profit; Website: www.ciis.edu; Offers Doctor's degree)
- Marinello Schools of Beauty-San Francisco (Full-time enrollment: 889; Location: 1087 Mission Street; Private, for-profit; Website: www.marinello.com)
- Le Cordon Bleu College of Culinary Arts-San Francisco (Full-time enrollment: 733; Location: 350 Rhode Island Street; Private, for-profit; Website: www.caculinary.edu)
- Fashion Institute of Design & Merchandising-San Francisco (Full-time enrollment: 658; Location: 55 Stockton St; Private, for-profit; Website: WWW.FIDM.EDU)
- San Francisco Art Institute (Full-time enrollment: 654; Location: 800 Chestnut St; Private, not-for-profit; Website: www.sfai.edu; Offers Master's degree)
- San Francisco Conservatory of Music (Full-time enrollment: 624; Location: 50 Oak Street; Private, not-for-profit; Website: www.sfcm.edu; Offers Master's degree)
- Saybrook University (Full-time enrollment: 536; Location: 747 Front Street 3rd Fl.; Private, not-for-profit; Website: www.saybrook.edu; Offers Doctor's degree)
- American College of Traditional Chinese Medicine (Full-time enrollment: 384; Location: 455 Arkansas St; Private, not-for-profit; Website: www.actcm.edu; Offers Doctor's degree)
- Everest College-San Francisco (Full-time enrollment: 372; Location: 814 Mission St Suite 500; Private, for-profit; Website: www.bryman.edu)
- San Francisco Institute of Esthetics and Cosmetology (Full-time enrollment: 262; Location: 1067 Folsom St; Private, for-profit; Website: www.sfiec.edu)
- Cinta Aveda Institute (Full-time enrollment: 190; Location: 305 Kearny Street; Private, for-profit; Website: www.cintaaveda.com)
Other colleges/universities with over 2000 students near San Francisco:
- College of Alameda (about 9 miles; Alameda, CA; Full-time enrollment: 3,071)
- Skyline College (about 10 miles; San Bruno, CA; FT enrollment: 5,824)
- Laney College (about 10 miles; Oakland, CA; FT enrollment: 5,668)
- Berkeley City College (about 12 miles; Berkeley, CA; FT enrollment: 3,146)
- University of California-Berkeley (about 13 miles; Berkeley, CA; FT enrollment: 37,127)
- College of Marin (about 15 miles; Kentfield, CA; FT enrollment: 4,489)
- Merritt College (about 15 miles; Oakland, CA; FT enrollment: 2,842)
Biggest public high schools in San Francisco:
- LOWELL HIGH (Students: 1,926, Location: 1101 EUCALYPTUS DR., Grades: 9-12)
- GALILEO HIGH (Students: 1,436, Location: 1150 FRANCISCO ST., Grades: 9-12)
- BALBOA HIGH (Students: 795, Location: 1000 CAYUGA AVE., Grades: 9-12)
- ASAWA (RUTH) SAN FRANCISCO SCH OF THE ARTS, A PUBL (Students: 625, Location: 555 PORTOLA DR., Grades: 9-12)
- MISSION HIGH (Students: 521, Location: 3750 18TH ST., Grades: 9-12)
- INTERNATIONAL STUDIES ACADEMY (Students: 344, Location: 655 DE HARO ST., Grades: 8-12)
- GATEWAY HIGH (Students: 321, Location: 1430 SCOTT ST., Grades: 9-12, Charter school)
- CITY ARTS AND TECH HIGH (Students: 247, Location: 325 LA GRANDE AVE., Grades: 9-12, Charter school)
- LEADERSHIP HIGH (Students: 158, Location: 241 ONEIDA AVE. #301, Grades: 9-12, Charter school)
- FIVE KEYS ADULT SCHOOL (SF SHERIFF'S) (Students: 154, Location: 70 OAK GROVE, Grades: 9-12, Charter school)
Biggest private high schools in San Francisco:
- ST IGNATIUS COLLEGE PREPARATORY (Students: 1,444, Location: 2001 37TH AVE, Grades: 9-12)
- SACRED HEART CATHEDRAL PREPARATORY (Students: 1,257, Location: 1055 ELLIS ST, Grades: 9-12)
- CORNERSTONE ACADEMY (Students: 1,114, Location: 801 SILVER AVE, Grades: PK-12)
- LYCEE FRANCAIS LA PEROUSE - SAN FRANCISCO CAMPUS (Students: 907, Location: 1201 ORTEGA ST, Grades: PK-12)
- ARCHBISHOP RIORDAN HIGH SCHOOL (Students: 572, Location: 175 PHELAN AVE, Grades: 9-12, Boys only)
- SAN FRANCISCO WALDORF SCHOOL (Students: 453, Location: 2938 WASHINGTON ST, Grades: PK-12)
- LICK-WILMERDING HIGH SCHOOL (Students: 445, Location: 755 OCEAN AVE, Grades: 9-12)
- MERCY HIGH SCHOOL (Students: 442, Location: 3250 19TH AVE, Grades: 9-12, Girls only)
- SAN FRANCISCO UNIVERSITY HIGH SCHOOL (Students: 400, Location: 3065 JACKSON ST, Grades: 9-12)
- THE URBAN SCHOOL OF SAN FRANCISCO (Students: 375, Location: 1563 PAGE ST, Grades: 9-12)
Biggest public elementary/middle schools in San Francisco:
- CARVER (GEORGE WASHINGTON) ELEMENTARY (Students: 1,794, Location: 1360 OAKDALE AVE., Grades: KG-5)
- PRESIDIO MIDDLE (Students: 1,161, Location: 450 30TH AVE., Grades: 6-8)
- APTOS MIDDLE (Students: 961, Location: 105 APTOS AVE., Grades: 6-8)
- MARINA MIDDLE (Students: 894, Location: 3500 FILLMORE ST., Grades: 6-8)
- ROOSEVELT MIDDLE (Students: 710, Location: 460 ARGUELLO BLVD., Grades: 6-8)
- FRANCISCO MIDDLE (Students: 596, Location: 2190 POWELL ST., Grades: 6-8)
- LAWTON ALTERNATIVE ELEMENTARY (Students: 471, Location: 1570 31ST AVE., Grades: KG-8)
- ROOFTOP ELEMENTARY (Students: 442, Location: 443 BURNETT AVE., Grades: KG-8)
- LAKESHORE ALTERNATIVE ELEMENTARY (Students: 380, Location: 220 MIDDLEFIELD DR., Grades: KG-5)
- WEST PORTAL ELEMENTARY (Students: 368, Location: 5 LENOX WAY, Grades: KG-5)
Biggest private elementary/middle schools in San Francisco:
- ST CECILIA SCHOOL (Students: 588, Location: 660 VICENTE ST, Grades: KG-8)
- BRANDEIS-HILLEL DAY SCHOOL (Students: 576, Location: 655 BROTHERHOOD WAY, Grades: KG-8)
- EPIPHANY SCHOOL (Students: 530, Location: 600 ITALY AVE, Grades: KG-8)
- ST GABRIEL ELEMENTARY SCHOOL (Students: 498, Location: 2550 41ST AVE, Grades: KG-8)
- WEST PORTAL LUTHERAN SCHOOL (Students: 489, Location: 200 SLOAT BLVD, Grades: KG-8)
- ST ANNE ELEMENTARY SCHOOL (Students: 449, Location: 1320 14TH AVE, Grades: PK-8)
- SAN FRANCISCO FRIENDS SCHOOL (Students: 424, Location: 250 VALENCIA ST, Grades: KG-8)
- TOWN SCHOOL FOR BOYS (Students: 407, Location: 2750 JACKSON ST, Grades: KG-8, Boys only)
- HAMLIN SCHOOL (Students: 404, Location: 2120 BROADWAY ST, Grades: KG-8, Girls only)
- KATHERINE DELMAR BURKE SCHOOL (Students: 401, Location: 7070 CALIFORNIA ST, Grades: KG-8, Girls only)
Library in San Francisco:
- SAN FRANCISCO PUBLIC LIBRARY (Operating income: $78,699,777; Location: 100 LARKIN ST; 3,008,621 books; 20,706 e-books; 101,598 audio materials; 125,318 video materials; 84 local licensed databases; 1 state licensed databases; 19 other licensed databases; 10,103 print serial subscriptions; 790 electronic serial subscriptions)
User-submitted facts and corrections:
- Golden Gate University\'s websit: www.ggu.edu
- Golden Gate University's websit: www.ggu.edu
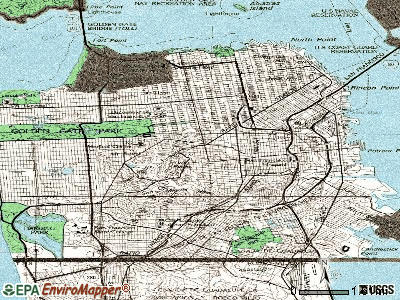
Points of interest:
Notable locations in San Francisco: Southeast Water Pollution Control Plant (A), Northpoint Water Pollution Control Plant (B), Oceanside Water Pollution Control Plant (C), Southern Pacific Station (D), Lobos Creek Water Treatment Plant (E), Municipal Pier (F), Pier 3 (G), Pier 2 (H), Pier 1 (I), San Francisco Port of Embarkation (J), Vista Pier (K), San Francisco Police Pistol Range (L), Richmond-Sunset Sewage Treatment Plant (M), Balboa Park Bay Area Rapid Transit Station (N), Civic Center Bay Area Rapid Transit Station (O), Embaradero Bay Area Rapid Transit Station (P), Glen Park Bay Area Rapid Transit Station (Q), Montgomery Street Bay Area Rapid Transit Station (R), Powell Street Bay Area Rapid Transit Station (S), Sixteenth Street Bay Area Rapid Transit Station (T). Display/hide their locations on the map
Shopping Centers: Yerba Buena Square Shopping Center (1), The Anchorage Shopping Center (2), Stonestown Galleria Shopping Center (3), San Francisco Retail Square Shopping Center (4), San Francisco Centre Shopping Center (5), Pier 39 Shopping Center (6), Petrini Plaza Shopping Center (7), One Union Square Shopping Center (8), Northpoint Centre Shopping Center (9). Display/hide their locations on the map
Main business address in San Francisco include: IEA INCOME FUND X LP (A), METRIC PARTNERS GROWTH SUITE INVESTORS LP (B), DEL MONTE FOODS CO (C), ATEL CAPITAL EQUIPMENT FUND X LLC (D), TEXTAINER EQUIPMENT INCOME FUND III L P (E), COMMERCE ONE INC / DE/ (F), PLUMTREE SOFTWARE INC (G), MARKETWATCH COM INC (H). Display/hide their locations on the map
Churches in San Francisco include: Convent of the Good Shepherd (A), Ma-Tsu Temple (B), Ascension Lutheran Church (C), Baha'i Temple (D), Brahma Kumaris Meditation Center (E), Calvary Presbyterian Church (F), Chapel of Grace (G), Chinese Baptist Church (H), Church of the New Jerusalem (I). Display/hide their locations on the map
Cemetery: San Francisco National Cemetery (1). Display/hide its location on the map
Lakes and reservoirs: Middle Lake (A), Laguna Honda (B), Mountain Lake (C), Stow Lake (D), Spreckels Lake (E), South Lake (F), McNab Lake (G), Lake Merced (H). Display/hide their locations on the map
Creek: Lobos Creek (A). Display/hide its location on the map
Parks in San Francisco include: McKinley Square (1), Alamo Square (2), Alta Plaza (3), Aquatic Park (4), Argonne Playground (5), Mission Park (6), Baker Beach State Park (7), Balboa Park (8), Mount Coppin Square (9). Display/hide their locations on the map
Beach: Baker Beach (A). Display/hide its location on the map
Tourist attractions: California Palace of the Legion of Honor (Museums; Lincoln Park) (1), Aptsjw (Museums; 811 Sacramento Street) (2), African-American Historical Society Fulton St Center (Museums; 762 Fulton Street) (3), Cable Car Museum (1201 Mason Street) (4), California Academy of Sciences (Museums; 875 Howard Street) (5), Cartoon Art Museum (Cultural Attractions- Events- & Facilities; 655 Mission Street) (6), Chinese American National Museum & Learning Center (Cultural Attractions- Events- & Facilities; 965 Clay Street) (7), Canvas Gallery (Art Museums; 1200 9th Ave) (8), Advanced Information Management (Cultural Attractions- Events- & Facilities; 388 Market Street) (9). Display/hide their approximate locations on the map
Hotels: Astoria Hotel (510 Bush St) (1), A-1 Inn Motel (1940 Lombard Street) (2), Best Western Canterbury Hotel (750 Sutter Street) (3), Albergo Verona (317 Leavenworth Street) (4), Air Travel Hotel (655 Ellis Street) (5), Andrews Hotel (624 Post Street) (6), Artists Inn (2231 Pine Street) (7), Ascot Hotel (1657 Market Street) (8), Adante Hotel (610 Geary Street) (9). Display/hide their approximate locations on the map
Courts: Mosk Stanley Justice Supreme Court (455 Golden Gate Avenue) (1), Daniel Burnham Court Garage (1 Daniel Burnham Court Basement) (2), California State - Judicial Performance Commission (101 Howard Street) (3), Federal Transit Administration - Regional Office (201 Mission Street Suite 2210) (4), Kaitlin Court (1501 Leavenworth Street) (5), Imperial Tea Court At The Ferry Bldg (1 Ferry Building) (6), S. F. City & County - Hall Of Justice- County Jails- No. 8 (850 Bryant Suite 475) (7), Potrero Court (2225 23rd Ofc) (8), United States Government - Calls Concerning General Immigration And Citizenshi- Immigration C (550 Kearny Street Suite 800) (9). Display/hide their approximate locations on the map
Birthplace of: Bruce Lee - (1940-1973), Chinese martial artist actor, Brooksley Born - Lawyer, George Pardee - Governor of California, Dian Fossey - Zoologist, Dianne Feinstein - (born 1933), politician, Harry Heilmann - Major League Baseball player, Abigail Folger, Courtney Love - (born 1964), of Hole, Charles Lane (actor) - Centenarian, Chanté Moore - Jazz singer.
Drinking water stations with addresses in San Francisco and their reported violations in the past:
CARA BAY APARTMENTS (Population served: 500, Groundwater):Past monitoring violations:ENCHANTED HILLS (Population served: 200, Surface water):
- Follow-up Or Routine LCR Tap M/R - In OCT-01-2013, Contaminant: Lead and Copper Rule. Follow-up actions: St AO (w/o penalty) issued (JAN-28-2014)
- Initial Tap Sampling for Pb and Cu - In JUL-01-1993, Contaminant: Lead and Copper Rule. Follow-up actions: Fed Compliance achieved (SEP-30-2005)
Past health violations:MOUNTAIN CAMP II (Population served: 140, Groundwater):Past monitoring violations:
- MCL, Acute (TCR) - Between JUL-2008 and SEP-2008, Contaminant: Coliform. Follow-up actions: St Violation/Reminder Notice (OCT-16-2008)
- MCL, Acute (TCR) - Between JUL-2008 and SEP-2008, Contaminant: Coliform. Follow-up actions: St Violation/Reminder Notice (OCT-16-2008)
- 2 routine major monitoring violations
Past monitoring violations:BLACK BUTTE MOBILE H.P. (Population served: 129, Groundwater):
- One routine major monitoring violation
Past monitoring violations:EMERALD PINES RESORT CABINS (Population served: 100, Groundwater):
- Initial Tap Sampling for Pb and Cu - In JUL-01-1993, Contaminant: Lead and Copper Rule. Follow-up actions: Fed Compliance achieved (SEP-30-2005)
Past monitoring violations:GURDJIEFF FOUNDATION (Population served: 90, Groundwater):
- 3 routine major monitoring violations
- One regular monitoring violation
Past health violations:RANCHO LA JOTA (Population served: 50, Groundwater):
- MCL, Monthly (TCR) - In FEB-2009, Contaminant: Coliform. Follow-up actions: St AO (w/o penalty) issued (APR-01-2009)
Past monitoring violations:TAMARACK SPRINGS MUTUAL WATER (Population served: 35, Groundwater):
- 5 routine major monitoring violations
Past health violations:Past monitoring violations:
- MCL, Monthly (TCR) - In SEP-2012, Contaminant: Coliform. Follow-up actions: St Formal NOV issued (OCT-16-2012), St Public Notif issued (OCT-16-2012)
- MCL, Monthly (TCR) - In APR-2012, Contaminant: Coliform. Follow-up actions: St Formal NOV issued (MAY-01-2012), St Public Notif issued (MAY-01-2012)
- MCL, Monthly (TCR) - In JAN-2012, Contaminant: Coliform. Follow-up actions: St Formal NOV issued (JAN-07-2013)
- MCL, Monthly (TCR) - In AUG-2010, Contaminant: Coliform. Follow-up actions: St Formal NOV issued (SEP-10-2010), St Public Notif issued (SEP-10-2010)
- Monitoring, Repeat Major (TCR) - In DEC-2012, Contaminant: Coliform (TCR). Follow-up actions: St Formal NOV issued (JAN-07-2013)
- 6 routine major monitoring violations
- 4 minor monitoring violations
Drinking water stations with addresses in San Francisco that have no violations reported:
- U.S. FOREST SERVICE-OAK FLAT WELL SYSTEM (Population served: 410, Primary Water Source Type: Groundwater)
- EVERGREEN LODGE (Population served: 225, Primary Water Source Type: Groundwater)
- U.S. FOREST SERV.-SUNSET POINT CAMP (Population served: 216, Primary Water Source Type: Groundwater)
- ST FRANCIS YACHT CLUB (Population served: 100, Primary Water Source Type: Groundwater)
- HARMONY RIDGE LODGE WATER SYSTEM (Population served: 30, Primary Water Source Type: Groundwater)
| This city: | 2.3 people |
| California: | 2.9 people |
| This city: | 43.7% |
| Whole state: | 68.7% |
| This city: | 9.3% |
| Whole state: | 7.2% |
Likely homosexual households (counted as self-reported same-sex unmarried-partner households)
- Lesbian couples: 0.8% of all households
- Gay men: 2.2% of all households
People in group quarters in San Francisco in 2010:
- 8,151 people in college/university student housing
- 4,772 people in other noninstitutional facilities
- 2,942 people in nursing facilities/skilled-nursing facilities
- 2,303 people in emergency and transitional shelters (with sleeping facilities) for people experiencing homelessness
- 1,499 people in group homes intended for adults
- 1,210 people in local jails and other municipal confinement facilities
- 1,138 people in residential treatment centers for adults
- 1,008 people in workers' group living quarters and job corps centers
- 377 people in hospitals with patients who have no usual home elsewhere
- 224 people in correctional residential facilities
- 169 people in correctional facilities intended for juveniles
- 139 people in state prisons
- 95 people in mental (psychiatric) hospitals and psychiatric units in other hospitals
- 91 people in residential treatment centers for juveniles (non-correctional)
- 87 people in group homes for juveniles (non-correctional)
- 31 people in maritime/merchant vessels
- 28 people in in-patient hospice facilities
People in group quarters in San Francisco in 2000:
- 5,120 people in other noninstitutional group quarters
- 3,926 people in college dormitories (includes college quarters off campus)
- 2,306 people in other nonhousehold living situations
- 1,685 people in nursing homes
- 1,584 people in other group homes
- 1,232 people in local jails and other confinement facilities (including police lockups)
- 943 people in homes or halfway houses for drug/alcohol abuse
- 619 people in religious group quarters
- 406 people in wards in general hospitals for patients who have no usual home elsewhere
- 389 people in homes for the mentally ill
- 277 people in homes for the mentally retarded
- 223 people in schools, hospitals, or wards for the intellectually disabled
- 183 people in job corps and vocational training facilities
- 174 people in mental (psychiatric) hospitals or wards
- 125 people in short-term care, detention or diagnostic centers for delinquent children
- 96 people in hospitals or wards for drug/alcohol abuse
- 92 people in halfway houses
- 71 people in agriculture workers' dormitories on farms
- 64 people in hospitals/wards and hospices for chronically ill
- 43 people in crews of maritime vessels
- 41 people in other workers' dormitories
- 37 people in other hospitals or wards for chronically ill
- 36 people in federal prisons and detention centers
- 30 people in homes for abused, dependent, and neglected children
- 27 people in hospices or homes for chronically ill
- 22 people in military barracks, etc.
- 21 people in orthopedic wards and institutions for the physically handicapped
- 19 people in homes for the physically handicapped
- 16 people in other types of correctional institutions
- 14 people in military ships
Banks with most branches in San Francisco (2011 data):
- Bank of America, National Association: 45 branches. Info updated 2009/11/18: Bank assets: $1,451,969.3 mil, Deposits: $1,077,176.8 mil, headquarters in Charlotte, NC, positive income, 5782 total offices, Holding Company: Bank Of America Corporation
- Wells Fargo Bank, National Association: 44 branches. Info updated 2011/04/05: Bank assets: $1,161,490.0 mil, Deposits: $905,653.0 mil, headquarters in Sioux Falls, SD, positive income, 6395 total offices, Holding Company: Wells Fargo & Company
- JPMorgan Chase Bank, National Association: 29 branches. Info updated 2011/11/10: Bank assets: $1,811,678.0 mil, Deposits: $1,190,738.0 mil, headquarters in Columbus, OH, positive income, International Specialization, 5577 total offices, Holding Company: Jpmorgan Chase & Co.
- Citibank, National Association: 27 branches. Info updated 2012/01/10: Bank assets: $1,288,658.0 mil, Deposits: $882,541.0 mil, headquarters in Sioux Falls, SD, positive income, International Specialization, 1048 total offices, Holding Company: Citigroup Inc.
- East West Bank: 16 branches. Info updated 2010/06/14: Bank assets: $21,962.4 mil, Deposits: $17,501.8 mil, headquarters in Pasadena, CA, positive income, Commercial Lending Specialization, 131 total offices, Holding Company: East West Bancorp, Inc.
- U.S. Bank National Association: 13 branches. Info updated 2012/01/30: Bank assets: $330,470.8 mil, Deposits: $236,091.5 mil, headquarters in Cincinnati, OH, positive income, 3121 total offices, Holding Company: U.S. Bancorp
- Sterling Bank and Trust, FSB: 13 branches. Info updated 2011/07/21: Bank assets: $762.2 mil, Deposits: $646.8 mil, headquarters in Southfield, MI, positive income, Commercial Lending Specialization, 15 total offices
- First Republic Bank: 11 branches. Info updated 2010/08/03: Bank assets: $27,791.8 mil, Deposits: $22,459.3 mil, local headquarters, positive income, Mortgage Lending Specialization, 60 total offices
- Bank of the West: 8 branches. Info updated 2009/11/16: Bank assets: $62,408.3 mil, Deposits: $43,995.2 mil, local headquarters, positive income, 647 total offices, Holding Company: Bnp Paribas
- 43 other banks with 75 local branches
For population 15 years and over in San Francisco:
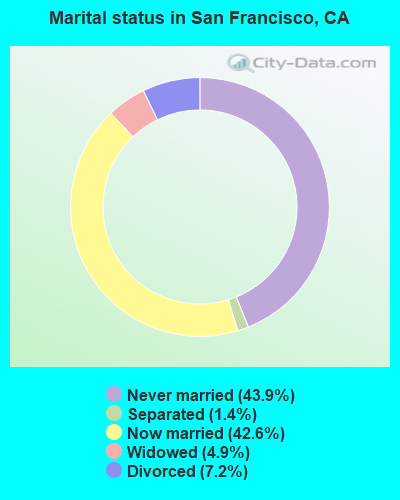
- Never married: 43.9%
- Now married: 42.6%
- Separated: 1.4%
- Widowed: 4.9%
- Divorced: 7.2%
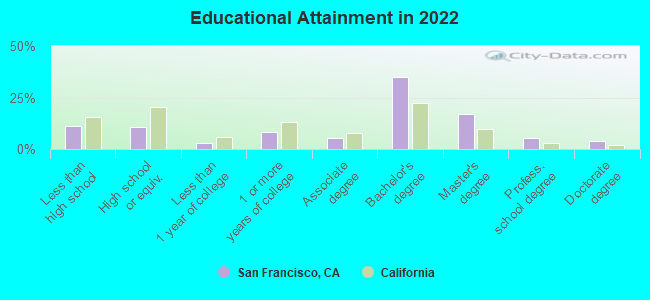
For population 25 years and over in San Francisco:
- High school or higher: 88.9%
- Bachelor's degree or higher: 61.4%
- Graduate or professional degree: 26.2%
- Unemployed: 3.5%
- Mean travel time to work (commute): 19.9 minutes
| Here: | 14.2 |
| California average: | 15.5 |


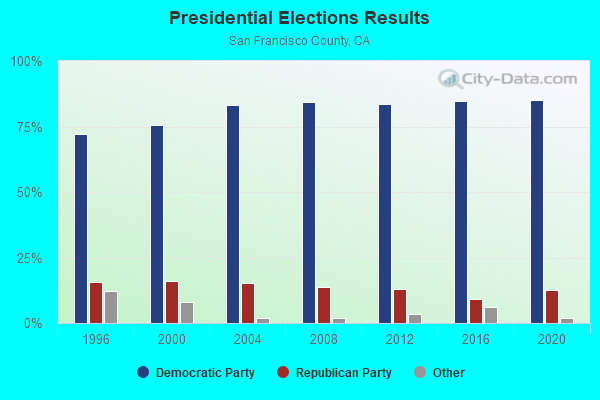
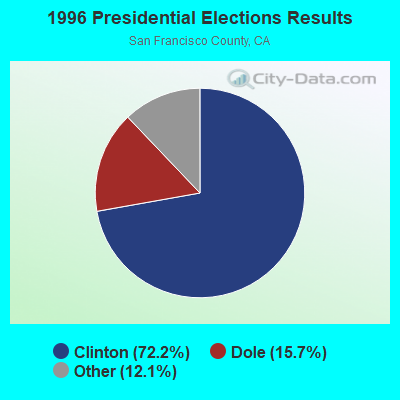
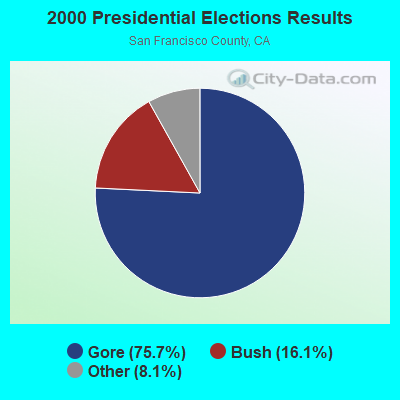
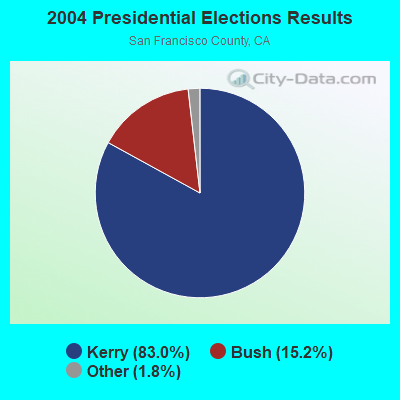
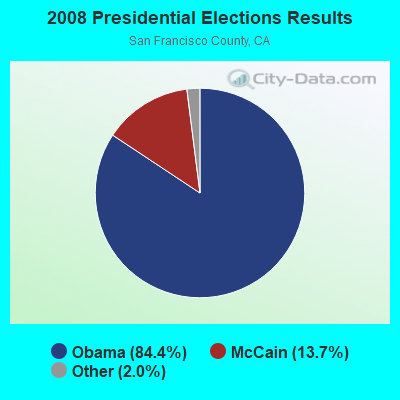
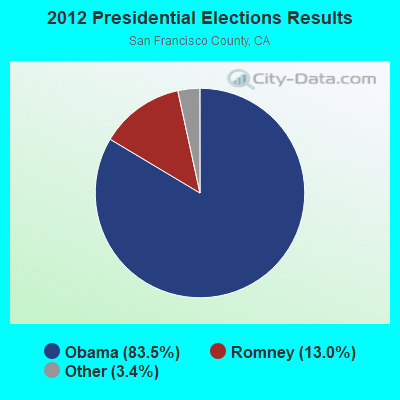
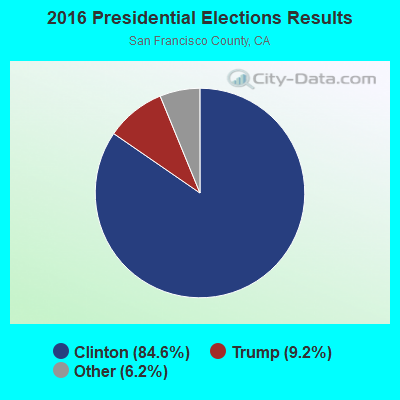
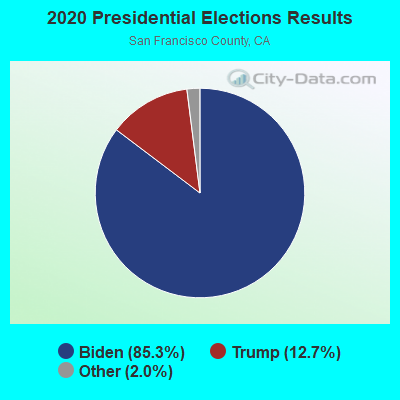
Graphs represent county-level data. Detailed 2008 Election Results
Neighborhoods in San Francisco:
(San Francisco, California Neighborhood Map)- Alamo Square neighborhood
- Anza Vista neighborhood
- Aquatic Park neighborhood
- Baja Noe (Mission Deluxe) neighborhood
- Balboa Park neighborhood
- Balboa Terrace neighborhood
- Bayview District neighborhood
- Bayview Heights neighborhood
- Bernal Heights neighborhood
- Bernal Heights North neighborhood
- Bernal Heights Park neighborhood
- Bernal Heights South neighborhood
- Buena Vista Park neighborhood
- Castro (Eureka Valley) neighborhood
- Cathedral Hill neighborhood
- Cayuga Terrace neighborhood
- Central Richmond neighborhood
- Central Sunset neighborhood
- Chinatown neighborhood
- Civic Center neighborhood
- Clarendon Heights neighborhood
- Cole Valley neighborhood
- Corona Heights neighborhood
- Cow Hollow neighborhood
- Crocker-Amazon neighborhood
- Deco Ghetto neighborhood
- Diamond Heights neighborhood
- Dogpatch neighborhood
- Downtown neighborhood
- Duboce Triangle neighborhood
- Embarcadero neighborhood
- Excelsior neighborhood
- Financial District (FiDi) neighborhood
- Financial District South neighborhood
- Fisherman's Wharf neighborhood
- Forest Hill neighborhood
- Forest Knolls neighborhood
- Fort Mason (Fort Mason Center) neighborhood
- French Quarter neighborhood
- Ghirardelli Square neighborhood
- Glen Park neighborhood
- Golden Gate Heights neighborhood
- Golden Gate Park neighborhood
- Haight-Ashbury neighborhood
- Hayes Valley neighborhood
- Holly Park neighborhood
- Hunters Point neighborhood
- India Basin neighborhood
- Ingleside neighborhood
- Ingleside Heights neighborhood
- Ingleside Terrace neighborhood
- Inner Parkside neighborhood
- Inner Richmond neighborhood
- Inner Sunset neighborhood
- Inset neighborhood
- Intermission neighborhood
- Jackson Square neighborhood
- Japantown neighborhood
- Laguna Honda neighborhood
- Lake neighborhood
- Lake Shore neighborhood
- Lakeside neighborhood
- Laurel Heights (Jordan Park) neighborhood
- Laurel Village neighborhood
- Little Hollywood neighborhood
- Little Russia neighborhood
- Little Saigon neighborhood
- Lone Mountain neighborhood
- Lower Haight neighborhood
- Lower Nob Hill neighborhood
- Lower Pacific Heights neighborhood
- Marina District neighborhood
- Mastro neighborhood
- Merced Heights neighborhood
- Merced Manor neighborhood
- Midtown Terrace neighborhood
- Mint Hill neighborhood
- Miraloma Park neighborhood
- Mission Bay neighborhood
- Mission District (The Mission) neighborhood
- Mission Dolores neighborhood
- Mission Terrace neighborhood
- Monterey Heights neighborhood
- Mount Davidson Manor neighborhood
- NOMA (NoMa) neighborhood
- Nob Hill neighborhood
- Noe Valley neighborhood
- North Beach (NoBe) neighborhood
- North Panhandle (North of Panhandle) neighborhood
- North Waterfront neighborhood
- Oceanview neighborhood
- Outer Mission (Cayuga Terrace) neighborhood
- Outer Parkside neighborhood
- Outer Richmond neighborhood
- Outer Sunset neighborhood
- Outset neighborhood
- Pacific Heights neighborhood
- Park Merced (Parkmerced) neighborhood
- Parkside neighborhood
- Parnassus (Ashbury Heights) neighborhood
- Pier 39 neighborhood
- Pine Lake Park neighborhood
- Polk Gulch neighborhood
- Portola neighborhood
- Potrero Flats neighborhood
- Potrero Hill neighborhood
- Presidio (Crissy Field) neighborhood
- Presidio Heights neighborhood
- Presidio Terrace neighborhood
- Richmond District neighborhood
- Rincon Hill neighborhood
- Russian Hill neighborhood
- SOMISSPO neighborhood
- Saint Francis Wood neighborhood
- Sea Cliff neighborhood
- Sherwood Forest neighborhood
- Showplace Square (Showplace Sq) neighborhood
- Silver Terrace neighborhood
- South Basin neighborhood
- South Beach neighborhood
- South Of Market (SOMA) neighborhood
- South Park neighborhood
- St Marys Square neighborhood
- Stonestown neighborhood
- Sunnydale neighborhood
- Sunnyside neighborhood
- Sunset District neighborhood
- Sutro Heights (Vista Del Mar) neighborhood
- Telegraph Hill neighborhood
- Tenderloin neighborhood
- The Hub (Mid-Market) neighborhood
- Transmission neighborhood
- Treasure Island neighborhood
- Twin Peaks neighborhood
- Twin Peaks West neighborhood
- Union Square neighborhood
- Upper Market neighborhood
- Van Ness neighborhood
- Visitacion Valley neighborhood
- West Portal neighborhood
- West of Twin Peaks neighborhood
- Western Addition neighborhood
- Westwood Highlands neighborhood
- Westwood Park neighborhood
- Yerba Buena Island neighborhood
- Zion District neighborhood
Religion statistics for San Francisco, CA (based on San Francisco County data)
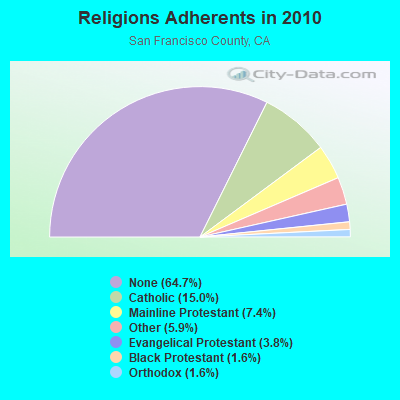
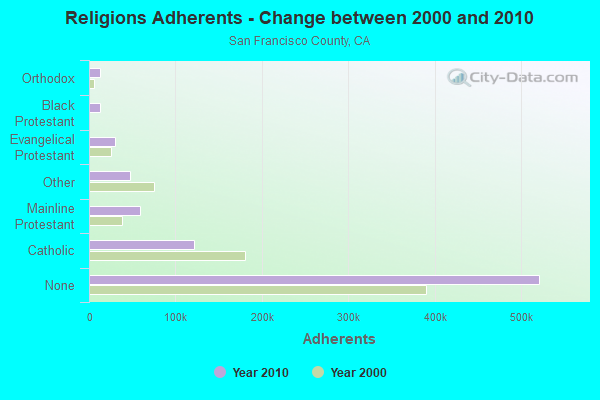
| Religion | Adherents | Congregations |
|---|---|---|
| Catholic | 120,988 | 50 |
| Mainline Protestant | 59,308 | 91 |
| Other | 47,820 | 114 |
| Evangelical Protestant | 30,348 | 199 |
| Black Protestant | 13,176 | 51 |
| Orthodox | 12,670 | 16 |
| None | 520,925 | - |
Food Environment Statistics:
| San Francisco County: | 3.89 / 10,000 pop. |
| State: | 2.14 / 10,000 pop. |
| San Francisco County: | 0.01 / 10,000 pop. |
| California: | 0.04 / 10,000 pop. |
| Here: | 0.59 / 10,000 pop. |
| California: | 0.62 / 10,000 pop. |
| San Francisco County: | 0.81 / 10,000 pop. |
| California: | 1.49 / 10,000 pop. |
| San Francisco County: | 19.77 / 10,000 pop. |
| California: | 7.42 / 10,000 pop. |
| San Francisco County: | 7.4% |
| California: | 7.3% |
| Here: | 16.1% |
| California: | 21.3% |
| This county: | 16.3% |
| California: | 17.9% |
Health and Nutrition:
| Here: | 53.6% |
| California: | 49.4% |
| San Francisco: | 51.6% |
| State: | 48.0% |
| Here: | 27.1 |
| California: | 28.1 |
| San Francisco: | 16.7% |
| State: | 20.2% |
| This city: | 14.0% |
| California: | 11.2% |
| San Francisco: | 6.8 |
| State: | 6.8 |
| This city: | 27.6% |
| California: | 31.5% |
| Here: | 59.3% |
| State: | 56.4% |
| Here: | 82.3% |
| California: | 80.9% |
More about Health and Nutrition of San Francisco, CA Residents
| Local government employment and payroll (March 2022) | |||||
| Function | Full-time employees | Monthly full-time payroll | Average yearly full-time wage | Part-time employees | Monthly part-time payroll |
|---|---|---|---|---|---|
| Transit | 5,255 | $39,781,564 | $90,843 | 0 | $0 |
| Police Protection - Officers | 2,817 | $30,184,550 | $128,582 | 44 | $190,951 |
| Hospitals | 2,482 | $21,954,465 | $106,146 | 2,140 | $12,642,244 |
| Health | 2,214 | $20,521,528 | $111,228 | 687 | $4,126,191 |
| Welfare | 1,958 | $12,872,154 | $78,890 | 424 | $1,533,511 |
| Firefighters | 1,711 | $19,525,393 | $136,940 | 0 | $0 |
| Airports | 1,534 | $11,798,996 | $92,300 | 60 | $200,512 |
| Water Supply | 1,506 | $13,541,485 | $107,900 | 80 | $218,806 |
| Correction | 1,461 | $14,414,835 | $118,397 | 90 | $308,880 |
| Judicial and Legal | 1,386 | $14,486,050 | $125,420 | 45 | $283,390 |
| Streets and Highways | 1,168 | $9,568,485 | $98,306 | 216 | $542,727 |
| Other Government Administration | 1,109 | $8,786,578 | $95,076 | 113 | $197,566 |
| Parks and Recreation | 990 | $5,014,146 | $60,778 | 432 | $637,495 |
| Financial Administration | 791 | $7,177,992 | $108,895 | 46 | $174,708 |
| Sewerage | 458 | $3,850,665 | $100,891 | 33 | $122,817 |
| Local Libraries | 424 | $3,239,853 | $91,694 | 435 | $1,189,910 |
| Solid Waste Management | 373 | $2,378,114 | $76,508 | 83 | $244,340 |
| Other and Unallocable | 334 | $2,580,273 | $92,704 | 53 | $132,356 |
| Police - Other | 325 | $2,580,273 | $95,272 | 0 | $0 |
| Electric Power | 238 | $2,295,232 | $115,726 | 18 | $66,404 |
| Water Transport and Terminals | 226 | $1,408,761 | $74,801 | 12 | $30,379 |
| Housing and Community Development (Local) | 171 | $1,219,387 | $85,571 | 4 | $14,998 |
| Fire - Other | 85 | $907,651 | $128,139 | 5 | $34,073 |
| Elementary and Secondary - Other Total | 15 | $209,997 | $167,998 | 1 | $4,764 |
| Totals for Government | 29,031 | $250,298,427 | $103,461 | 5,021 | $22,897,023 |
San Francisco government finances - Expenditure in 2021 (per resident):
- Assistance and Subsidies - Public Welfare, Cash Assistance Programs - Other: $891,890,000 ($1103.23)
Public Welfare, Federal Categorical Assistance Programs: $70,097,000 ($86.71)
- Construction - Transit Utilities: $512,068,000 ($633.40)
General - Other: $206,782,000 ($255.78)
Regular Highways: $36,122,000 ($44.68)
Parks and Recreation: $28,699,000 ($35.50)
Housing and Community Development: $22,927,000 ($28.36)
Health - Other: $3,715,000 ($4.60)
Police Protection: $900,000 ($1.11)
- Current Operations - Health - Other: $2,544,075,000 ($3146.91)
General - Other: $1,786,610,000 ($2209.96)
Hospitals: $1,192,092,000 ($1474.56)
Transit Utilities: $904,463,000 ($1118.78)
Air Transportation: $654,112,000 ($809.11)
Police Protection: $635,064,000 ($785.55)
Central Staff Services: $470,805,000 ($582.36)
Housing and Community Development: $409,400,000 ($506.41)
Public Welfare - Other: $372,807,000 ($461.15)
Local Fire Protection: $365,831,000 ($452.52)
Electric Utilities: $349,304,000 ($432.07)
Public Welfare, Vendor Payments for Other Purposes: $277,469,000 ($343.22)
Water Utilities: $275,959,000 ($341.35)
Parks and Recreation: $267,651,000 ($331.07)
Correctional Institutions: $228,269,000 ($282.36)
Sewerage: $210,660,000 ($260.58)
Parking Facilities: $209,855,000 ($259.58)
Regular Highways: $201,553,000 ($249.31)
Judicial and Legal Services: $164,919,000 ($204.00)
Libraries: $128,623,000 ($159.10)
Protective Inspection and Regulation - Other: $128,321,000 ($158.73)
Sea and Inland Port Facilities: $110,408,000 ($136.57)
Financial Administration: $73,751,000 ($91.23)
Corrections - Other: $47,242,000 ($58.44)
- Electric Utilities - Interest on Debt: $2,943,000 ($3.64)
- General - Interest on Debt: $689,841,000 ($853.30)
- Intergovernmental to Local - Other - Housing and Community Development: $1,614,000 ($2.00)
- Other Capital Outlay - Transit Utilities: $197,231,000 ($243.97)
General - Other: $36,000 ($0.04)
- Total Salaries and Wages: $1,344,000 ($1.66)
- Transit Utilities - Interest on Debt: $16,587,000 ($20.52)
- Water Utilities - Interest on Debt: $176,823,000 ($218.72)
San Francisco government finances - Revenue in 2021 (per resident):
- Charges - Hospital Public: $1,066,625,000 ($1319.37)
Other: $982,400,000 ($1215.18)
Air Transportation: $544,889,000 ($674.00)
Sewerage: $327,665,000 ($405.31)
Parking Facilities: $174,589,000 ($215.96)
Housing and Community Development: $146,330,000 ($181.00)
Sea and Inland Port Facilities: $94,329,000 ($116.68)
Parks and Recreation: $21,460,000 ($26.55)
Solid Waste Management: $21,399,000 ($26.47)
- Federal Intergovernmental - Other: $622,583,000 ($770.11)
Transit Utilities: $568,878,000 ($703.68)
Air Transportation: $323,834,000 ($400.57)
Housing and Community Development: $49,582,000 ($61.33)
Health and Hospitals: $35,718,000 ($44.18)
Highways: $11,660,000 ($14.42)
Electric Utilities: $2,182,000 ($2.70)
- Local Intergovernmental - Transit Utilities: $603,189,000 ($746.12)
Public Welfare: $17,403,000 ($21.53)
Other: $6,157,000 ($7.62)
Water Utilities: $4,180,000 ($5.17)
- Miscellaneous - General Revenue - Other: $490,582,000 ($606.83)
Rents: $76,313,000 ($94.40)
Fines and Forfeits: $72,938,000 ($90.22)
Special Assessments: $36,964,000 ($45.72)
Interest Earnings: $21,593,000 ($26.71)
Donations From Private Sources: $5,119,000 ($6.33)
Sale of Property: $2,625,000 ($3.25)
- Revenue - Water Utilities: $568,141,000 ($702.76)
Electric Utilities: $309,042,000 ($382.27)
Transit Utilities: $52,416,000 ($64.84)
- State Intergovernmental - Other: $874,370,000 ($1081.56)
Public Welfare: $820,556,000 ($1014.99)
Health and Hospitals: $254,210,000 ($314.45)
Transit Utilities: $163,923,000 ($202.77)
Highways: $56,322,000 ($69.67)
General Local Government Support: $42,492,000 ($52.56)
Water Utilities: $15,004,000 ($18.56)
Housing and Community Development: $1,080,000 ($1.34)
Electric Utilities: $651,000 ($0.81)
- Tax - Property: $3,112,772,000 ($3850.36)
Occupation and Business License - Other: $1,816,535,000 ($2246.97)
General Sales and Gross Receipts: $395,737,000 ($489.51)
Documentary and Stock Transfer: $344,661,000 ($426.33)
Public Utilities Sales: $98,176,000 ($121.44)
Other Selective Sales: $85,253,000 ($105.45)
Other License: $70,226,000 ($86.87)
Motor Vehicle License: $5,514,000 ($6.82)
Amusements License: $182,000 ($0.23)
San Francisco government finances - Debt in 2021 (per resident):
- Long Term Debt - Outstanding Unspecified Public Purpose: $22,337,752,000 ($27630.79)
Beginning Outstanding - Unspecified Public Purpose: $20,776,466,000 ($25699.55)
Issue, Unspecified Public Purpose: $4,336,587,000 ($5364.16)
Retired Unspecified Public Purpose: $3,208,276,000 ($3968.49)
Outstanding Nonguaranteed - Industrial Revenue: $2,304,400,000 ($2850.44)
Beginning Outstanding - Public Debt for Private Purpose: $2,167,300,000 ($2680.85)
Issue, Nonguaranteed - Public Debt for Private Purpose: $150,000,000 ($185.54)
Retired Nonguaranteed - Public Debt for Private Purpose: $12,900,000 ($15.96)
San Francisco government finances - Cash and Securities in 2021 (per resident):
- Bond Funds - Cash and Securities: $449,159,000 ($555.59)
- Other Funds - Cash and Securities: $8,655,948,000 ($10707.02)
- Sinking Funds - Cash and Securities: $3,489,241,000 ($4316.03)
8.02% of this county's 2021 resident taxpayers lived in other counties in 2020 ($134,049 average adjusted gross income)
| Here: | 8.02% |
| California average: | 5.19% |
0.01% of residents moved from foreign countries ($70 average AGI)
San Francisco County: 0.01% California average: 0.03%
Top counties from which taxpayers relocated into this county between 2020 and 2021:
| from San Mateo County, CA | |
| from Alameda County, CA | |
| from Santa Clara County, CA |
12.53% of this county's 2020 resident taxpayers moved to other counties in 2021 ($239,664 average adjusted gross income)
| Here: | 12.53% |
| California average: | 6.14% |
0.01% of residents moved to foreign countries ($137 average AGI)
San Francisco County: 0.01% California average: 0.02%
Top counties to which taxpayers relocated from this county between 2020 and 2021:
| to Alameda County, CA | |
| to San Mateo County, CA | |
| to Los Angeles County, CA |
| Businesses in San Francisco, CA | ||||
| Name | Count | Name | Count | |
|---|---|---|---|---|
| 24 Hour Fitness | 11 | Knights Inn | 1 | |
| 7-Eleven | 12 | Kroger | 3 | |
| ALDO | 6 | Lane Bryant | 1 | |
| AT&T | 11 | Lane Furniture | 1 | |
| Abercrombie & Fitch | 1 | LensCrafters | 3 | |
| Abercrombie Kids | 1 | Levi Strauss & Co. | 3 | |
| Ace Hardware | 12 | Little Caesars Pizza | 1 | |
| Aeropostale | 1 | Lowe's | 1 | |
| Aerosoles | 2 | Macy's | 2 | |
| American Eagle Outfitters | 2 | Marriott | 8 | |
| Ann Taylor | 3 | Marshalls | 1 | |
| Apple Store | 3 | MasterBrand Cabinets | 29 | |
| Arby's | 1 | Mazda | 1 | |
| Audi | 1 | McDonald's | 19 | |
| BMW | 1 | Men's Wearhouse | 1 | |
| Bakers | 1 | Motel 6 | 1 | |
| Bally Total Fitness | 1 | Motherhood Maternity | 3 | |
| Banana Republic | 5 | New Balance | 16 | |
| Baskin-Robbins | 1 | Nike | 47 | |
| Bath & Body Works | 2 | Nissan | 1 | |
| Bebe | 3 | Nordstrom | 3 | |
| Bed Bath & Beyond | 1 | Office Depot | 3 | |
| Ben & Jerry's | 4 | OfficeMax | 2 | |
| Bentleymotors.Com | 1 | Old Navy | 1 | |
| Best Western | 5 | Olive Garden | 1 | |
| Big O Tires | 2 | Pac Sun | 1 | |
| Blockbuster | 5 | Panda Express | 4 | |
| Brooks Brothers | 2 | Panera Bread | 1 | |
| Brookstone | 3 | Papa John's Pizza | 1 | |
| Budget Car Rental | 4 | Payless | 7 | |
| Burger King | 13 | Penske | 1 | |
| Burlington Coat Factory | 1 | Pier 1 Imports | 2 | |
| CVS | 2 | Pizza Hut | 3 | |
| Cache | 1 | Popeyes | 4 | |
| Carl\s Jr. | 2 | Pottery Barn | 2 | |
| Chico's | 3 | Quiznos | 7 | |
| Chipotle | 3 | RadioShack | 18 | |
| Clarks | 1 | Ramada | 1 | |
| Cold Stone Creamery | 2 | Rodeway Inn | 2 | |
| Comfort Inn | 1 | Ryder Rental & Truck Leasing | 1 | |
| Costco | 1 | SAS Shoes | 5 | |
| Crate & Barrel | 1 | Safeway | 15 | |
| Curves | 3 | Saks Fifth Avenue | 2 | |
| DHL | 25 | Sears | 1 | |
| Days Inn | 3 | Sephora | 4 | |
| Decora Cabinetry | 2 | Sheraton | 1 | |
| Dennys | 2 | Skechers USA | 2 | |
| Domino's Pizza | 5 | Sprint Nextel | 9 | |
| DressBarn | 1 | Staples | 2 | |
| Dressbarn | 1 | Starbucks | 79 | |
| Eddie Bauer | 2 | Subway | 43 | |
| Express | 2 | Super 8 | 2 | |
| FedEx | 136 | T-Mobile | 29 | |
| Firestone Complete Auto Care | 3 | T.G.I. Driday's | 1 | |
| Foot Locker | 4 | T.J.Maxx | 1 | |
| Forever 21 | 2 | Taco Bell | 10 | |
| Fredericks Of Hollywood | 1 | Talbots | 1 | |
| GNC | 10 | The Cheesecake Factory | 1 | |
| GameStop | 5 | The Room Place | 1 | |
| Gap | 9 | Torrid | 1 | |
| Gymboree | 3 | Toyota | 1 | |
| H&M | 2 | Toys"R"Us | 1 | |
| H&R Block | 16 | Trader Joe's | 4 | |
| Haagen-Dazs | 2 | Travelodge | 4 | |
| Haworth | 2 | True Value | 8 | |
| Hilton | 6 | U-Haul | 8 | |
| Holiday Inn | 8 | UPS | 110 | |
| Hollister Co. | 1 | Urban Outfitters | 2 | |
| Honda | 1 | Vans | 19 | |
| Hot Topic | 1 | Verizon Wireless | 7 | |
| Hyatt | 4 | Victoria's Secret | 5 | |
| IHOP | 2 | Volkswagen | 1 | |
| J. Jill | 1 | Vons | 15 | |
| J.Crew | 2 | Walgreens | 30 | |
| Jamba Juice | 8 | Westin | 2 | |
| JoS. A. Bank | 2 | Wet Seal | 2 | |
| Johnny Rockets | 2 | Whole Foods Market | 4 | |
| Jones New York | 10 | World Gym | 1 | |
| Juicy Couture | 2 | YMCA | 11 | |
| KFC | 10 | Z Gallerie | 1 | |
Strongest AM radio stations in San Francisco:
- KTRB (860 AM; 50 kW; MODESTO, CA; Owner: PAPPAS RADIO OF CALIFORNIA, A CALIFORNIA LIMITED PARTNERSHIP)
- KSFO (560 AM; 5 kW; SAN FRANCISCO, CA; Owner: KGO-AM RADIO, INC.)
- KIQI (1010 AM; 35 kW; SAN FRANCISCO, CA; Owner: RADIO UNICA OF SAN FRANCISCO LICENSE CORP.)
- KOIT (1260 AM; 5 kW; SAN FRANCISCO, CA; Owner: BONNEVILLE HOLDING COMPANY)
- KNBR (680 AM; 50 kW; SAN FRANCISCO, CA; Owner: KNBR LICO, INC.)
- KNEW (910 AM; 20 kW; OAKLAND, CA; Owner: AMFM RADIO LICENSES, L.L.C.)
- KTCT (1050 AM; 50 kW; SAN MATEO, CA; Owner: SUSQUEHANNA RADIO CORP.)
- KFAX (1100 AM; 50 kW; SAN FRANCISCO, CA; Owner: GOLDEN GATE BROADCASTING CO, INC.)
- KGO (810 AM; 50 kW; SAN FRANCISCO, CA; Owner: KGO-AM RADIO, INC.)
- KYCY (1550 AM; 50 kW; SAN FRANCISCO, CA; Owner: INFINITY BROADCASTING OPERATIONS, INC.)
- KCBS (740 AM; 50 kW; SAN FRANCISCO, CA; Owner: INFINITY BROADCASTING OPERATIONS, INC.)
- KFRC (610 AM; 5 kW; SAN FRANCISCO, CA; Owner: INFINITY BROADCASTING CORPORATION OF LOS ANGELES)
- KEST (1450 AM; 1 kW; SAN FRANCISCO, CA; Owner: MULTICULTURAL RADIO BROADCASTING INC)
Strongest FM radio stations in San Francisco:
- KOIT-FM (96.5 FM; SAN FRANCISCO, CA; Owner: BONNEVILLE HOLDING COMPANY)
- KKSF (103.7 FM; SAN FRANCISCO, CA; Owner: AMFM RADIO LICENSES, L.L.C.)
- KALW (91.7 FM; SAN FRANCISCO, CA; Owner: SAN FRANCISCO UNIFIED SCHOOL DIST.)
- KFOG (104.5 FM; SAN FRANCISCO, CA; Owner: KFFG LICO, INC)
- KSOL (98.9 FM; SAN FRANCISCO, CA; Owner: TMS LICENSE CALIFORNIA, INC)
- KUSF (90.3 FM; SAN FRANCISCO, CA; Owner: UNIVERSITY OF SAN FRANCISCO)
- KYLD (94.9 FM; SAN FRANCISCO, CA; Owner: AMFM RADIO LICENSES, L.L.C.)
- KMEL (106.1 FM; SAN FRANCISCO, CA; Owner: AMFM RADIO LICENSES, L.L.C.)
- KZBR (95.7 FM; SAN FRANCISCO, CA; Owner: BONNEVILLE HOLDING COMPANY)
- KQED-FM (88.5 FM; SAN FRANCISCO, CA; Owner: KQED, INC.)
- KBLX-FM (102.9 FM; BERKELEY, CA; Owner: ICBC BROADCAST HOLDINGS - CA, INC.)
- KSAN (107.7 FM; SAN MATEO, CA; Owner: SUSQUEHANNA RADIO CORP.)
- KFRC-FM (99.7 FM; SAN FRANCISCO, CA; Owner: INFINITY KFRC-FM, INC.)
- KITS (105.3 FM; SAN FRANCISCO, CA; Owner: INFINITY BROADCASTING OPERATIONS, INC.)
- KIOI (101.3 FM; SAN FRANCISCO, CA; Owner: AMFM RADIO LICENSES, L.L.C.)
- KPTI (92.7 FM; ALAMEDA, CA; Owner: KPTI LICENSING, INC.)
- KDFC-FM (102.1 FM; SAN FRANCISCO, CA; Owner: BONNEVILLE HOLDING COMPANY)
- KBAY (93.3 FM; SAN FRANCISCO, CA; Owner: INFINITY BROADCASTING CORP. OF SAN FRANCISCO)
- KISQ (98.1 FM; SAN FRANCISCO, CA; Owner: AMFM RADIO LICENSES, L.L.C.)
- KEAR (106.9 FM; SAN FRANCISCO, CA; Owner: FAMILY STATIONS, INC.)
TV broadcast stations around San Francisco:
- KQED (Channel 9; SAN FRANCISCO, CA; Owner: KQED, INC.)
- KPIX-TV (Channel 5; SAN FRANCISCO, CA; Owner: CBS BROADCASTING INC.)
- KGO-TV (Channel 7; SAN FRANCISCO, CA; Owner: KGO TELEVISION, INC.)
- KTVU (Channel 2; OAKLAND, CA; Owner: KTVU PARTNERSHIP)
- KRON-TV (Channel 4; SAN FRANCISCO, CA; Owner: YOUNG BROADCASTING OF SAN FRANCISCO, INC.)
- KMTP-TV (Channel 32; SAN FRANCISCO, CA; Owner: MINORITY TELEVISION PROJECT)
- KBHK-TV (Channel 44; SAN FRANCISCO, CA; Owner: VIACOM TELEVISION STATIONS GROUP OF SAN FRANCISCO INC.)
- KBWB (Channel 20; SAN FRANCISCO, CA; Owner: KBWB LICENSE, INC.)
- KFSF (Channel 66; VALLEJO, CA; Owner: TELEFUTURA SAN FRANCISCO LLC)
- KCNS (Channel 38; SAN FRANCISCO, CA; Owner: WRAY, INC.)
- KCSM-TV (Channel 60; SAN MATEO, CA; Owner: SAN MATEO COUNTY COMMUNITY COLLEGE DISTRICT)
- KTSF (Channel 26; SAN FRANCISCO, CA; Owner: LINCOLN BROADCASTING COMPANY, A CALIFORNIA LP)
- KOVR (Channel 13; STOCKTON, CA; Owner: SCI - SACRAMENTO LICENSEE, LLC)
- KXTV (Channel 10; SACRAMENTO, CA; Owner: KXTV, INC.)
- KSPX (Channel 29; SACRAMENTO, CA; Owner: PAXSON SACRAMENTO LICENSE, INC.)
- KTXL (Channel 40; SACRAMENTO, CA; Owner: CHANNEL 40, INC.)
- KUVS (Channel 19; MODESTO, CA; Owner: KUVS LICENSE PARTNERSHIP, G.P.)
- KTNC-TV (Channel 42; CONCORD, CA; Owner: KTNC LICENSE, LLC)
Medal of Honor Recipients
Medal of Honor Recipients born in San Francisco: Daniel Judson Callaghan, Harold W. Roberts, John D. Hawk, John J. Clausey, Peter H. Quinn, Phillip C. Katz, Ralph Cheli, Robert Volz, Will C. Barnes.
- National Bridge Inventory (NBI) Statistics
- 358Number of bridges
- 14,222ft / 4,335mTotal length
- $3,359,000Total costs
- 17,990,574Total average daily traffic
- 561,159Total average daily truck traffic
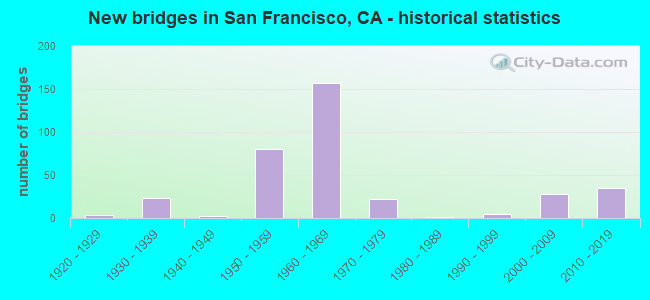
- New bridges - historical statistics
- 11900-1909
- 11910-1919
- 31920-1929
- 231930-1939
- 21940-1949
- 801950-1959
- 1571960-1969
- 221970-1979
- 11980-1989
- 51990-1999
- 282000-2009
- 352010-2019
FCC Registered Antenna Towers: 340 (See the full list of FCC Registered Antenna Towers)
FCC Registered Commercial Land Mobile Towers: 46 (See the full list of FCC Registered Commercial Land Mobile Towers in San Francisco, CA)
FCC Registered Private Land Mobile Towers: 48 (See the full list of FCC Registered Private Land Mobile Towers)
FCC Registered Broadcast Land Mobile Towers: 794 (See the full list of FCC Registered Broadcast Land Mobile Towers)
FCC Registered Microwave Towers: 1,140 (See the full list of FCC Registered Microwave Towers in this town)
FCC Registered Paging Towers: 53 (See the full list of FCC Registered Paging Towers)
FCC Registered Maritime Coast & Aviation Ground Towers: 132 (See the full list of FCC Registered Maritime Coast & Aviation Ground Towers)
FCC Registered Amateur Radio Licenses: 4,100 (See the full list of FCC Registered Amateur Radio Licenses in San Francisco)
FAA Registered Aircraft Manufacturers and Dealers: 9 (See the full list of FAA Registered Manufacturers and Dealers in San Francisco)
FAA Registered Aircraft: 453 (See the full list of FAA Registered Aircraft)
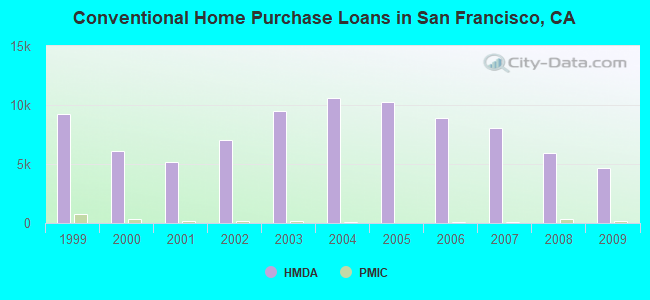
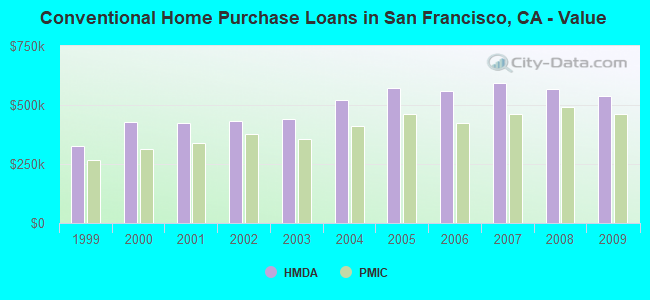
| Home Mortgage Disclosure Act Aggregated Statistics For Year 2009 (Based on 177 full tracts) | ||||||||||||||
| A) FHA, FSA/RHS & VA Home Purchase Loans | B) Conventional Home Purchase Loans | C) Refinancings | D) Home Improvement Loans | E) Loans on Dwellings For 5+ Families | F) Non-occupant Loans on < 5 Family Dwellings (A B C & D) | G) Loans On Manufactured Home Dwelling (A B C & D) | ||||||||
|---|---|---|---|---|---|---|---|---|---|---|---|---|---|---|
| Number | Average Value | Number | Average Value | Number | Average Value | Number | Average Value | Number | Average Value | Number | Average Value | Number | Average Value | |
| LOANS ORIGINATED | 374 | $545,316 | 4,620 | $540,150 | 16,525 | $432,496 | 764 | $313,055 | 186 | $2,158,774 | 1,732 | $431,472 | 4 | $475,500 |
| APPLICATIONS APPROVED, NOT ACCEPTED | 30 | $513,067 | 582 | $520,888 | 2,033 | $444,044 | 62 | $233,742 | 4 | $1,493,000 | 204 | $432,873 | 0 | $0 |
| APPLICATIONS DENIED | 99 | $514,404 | 952 | $505,702 | 5,077 | $489,960 | 328 | $240,372 | 35 | $1,119,200 | 700 | $411,860 | 2 | $107,000 |
| APPLICATIONS WITHDRAWN | 94 | $472,138 | 698 | $528,159 | 2,981 | $464,082 | 200 | $258,340 | 17 | $5,964,235 | 375 | $401,819 | 2 | $394,500 |
| FILES CLOSED FOR INCOMPLETENESS | 17 | $496,647 | 171 | $443,234 | 836 | $454,038 | 64 | $204,484 | 5 | $1,355,200 | 94 | $418,191 | 0 | $0 |
Detailed mortgage data for all 176 tracts in San Francisco, CA
| Private Mortgage Insurance Companies Aggregated Statistics For Year 2009 (Based on 113 full tracts) | ||||||||
| A) Conventional Home Purchase Loans | B) Refinancings | C) Non-occupant Loans on < 5 Family Dwellings (A & B) | D) Loans On Manufactured Home Dwelling (A & B) | |||||
|---|---|---|---|---|---|---|---|---|
| Number | Average Value | Number | Average Value | Number | Average Value | Number | Average Value | |
| LOANS ORIGINATED | 132 | $462,992 | 22 | $469,318 | 2 | $321,500 | 0 | $0 |
| APPLICATIONS APPROVED, NOT ACCEPTED | 77 | $520,727 | 24 | $534,417 | 4 | $368,250 | 0 | $0 |
| APPLICATIONS DENIED | 55 | $501,691 | 25 | $486,720 | 1 | $400,000 | 0 | $0 |
| APPLICATIONS WITHDRAWN | 22 | $327,182 | 17 | $495,059 | 0 | $0 | 3 | $91,667 |
| FILES CLOSED FOR INCOMPLETENESS | 9 | $714,667 | 1 | $514,000 | 2 | $417,000 | 0 | $0 |
2014 - 2018 National Fire Incident Reporting System (NFIRS) incidents
- Fire incident types reported to NFIRS in San Francisco, CA
- 6,33744.4%Outside Fires
- 5,82040.8%Structure Fires
- 1,1428.0%Other
- 9696.8%Mobile Property/Vehicle Fires
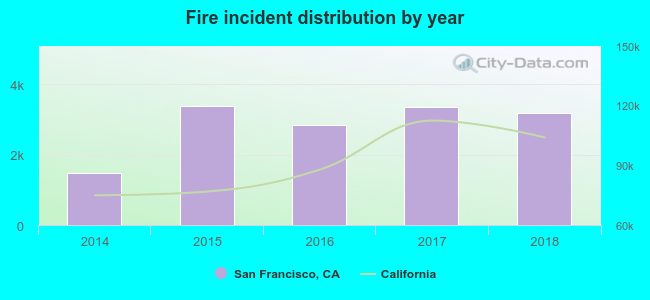 Based on the data from the years 2014 - 2018 the average number of fire incidents per year is 2842. The highest number of reported fire incidents - 3,388 took place in 2015, and the least - 1,471 in 2014. The data has an increasing trend.
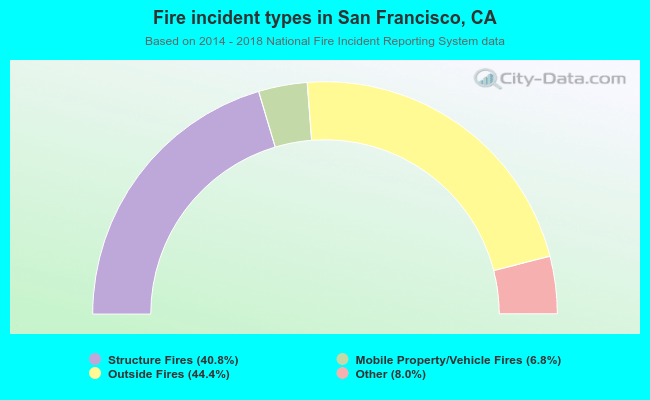 When looking into fire subcategories, the most reports belonged to: Outside Fires (44.4%), and Structure Fires (40.8%).
Fire-safe hotels and motels in San Francisco, California:
- Layne Hotel, 545 Jones St, San Francisco, California 94102 , Phone: (415) 441-9317
- Delbex Hotel, 2126 MSN St, San Francisco, California 94110 , Phone: (415) 626-9406
- Parc 55 Wyndham San Francisco Hotel, 55 Cyril Magnin, San Francisco, California 94102 , Phone: (415) 392-8000, Fax: (415) 392-4734
- Hotel Diva, 440 Geary St, San Francisco, California 94102 , Phone: (415) 885-0200, Fax: (415) 346-6613
- Travelodge At The Presidio, 2755 Lombard St, San Francisco, California 94123 , Phone: (415) 931-8581, Fax: (415) 776-0904
- Royal Motel, 2555 Lombard St, San Francisco, California 94123 , Phone: (415) 921-3105
- Coventry Motor Inn, 1901 Lombard St, San Francisco, California 94123 , Phone: (415) 567-1200, Fax: (415) 921-8745
- Fairmont Hotel San Francisco, 950 Mason St, San Francisco, California 94108 , Phone: (415) 772-5161, Fax: (415) 772-5013
- 108 other hotels and motels
| Most common first names in San Francisco, CA among deceased individuals | ||
| Name | Count | Lived (average) |
|---|---|---|
| John | 6,348 | 72.1 years |
| William | 4,583 | 72.1 years |
| Mary | 4,498 | 80.5 years |
| James | 3,727 | 68.8 years |
| Robert | 3,451 | 66.9 years |
| George | 3,262 | 75.0 years |
| Joseph | 3,118 | 73.8 years |
| Charles | 2,671 | 72.0 years |
| Frank | 2,417 | 75.1 years |
| Helen | 2,100 | 79.5 years |
| Most common last names in San Francisco, CA among deceased individuals | ||
| Last name | Count | Lived (average) |
|---|---|---|
| Wong | 2,350 | 77.1 years |
| Lee | 2,230 | 76.4 years |
| Smith | 1,608 | 72.2 years |
| Johnson | 1,509 | 72.1 years |
| Williams | 1,132 | 71.2 years |
| Chan | 928 | 77.6 years |
| Brown | 913 | 71.6 years |
| Jones | 903 | 71.1 years |
| Davis | 746 | 71.4 years |
| Miller | 740 | 72.9 years |
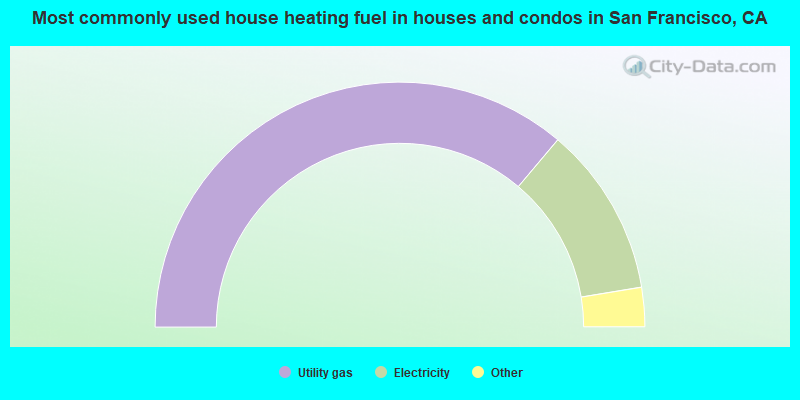
- 72.3%Utility gas
- 22.5%Electricity
- 2.9%No fuel used
- 1.6%Bottled, tank, or LP gas
- 0.4%Solar energy
- 0.2%Other fuel
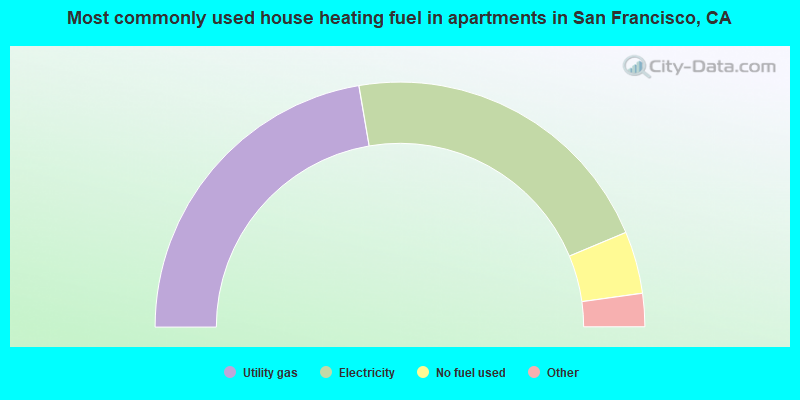
- 44.6%Utility gas
- 42.7%Electricity
- 8.2%No fuel used
- 2.0%Other fuel
- 1.9%Bottled, tank, or LP gas
- 0.3%Solar energy
- 0.1%Fuel oil, kerosene, etc.
San Francisco compared to California state average:
- Median house value above state average.
- Unemployed percentage significantly below state average.
- Hispanic race population percentage below state average.
- Median age above state average.
- Number of rooms per house below state average.
- House age above state average.
- Percentage of population with a bachelor's degree or higher significantly above state average.
San Francisco, CA compared to other similar cities:
San Francisco on our top lists:
- #3 on the list of "Top 101 cities with the largest percentage of likely gay men couples (counted as self-reported male-male unmarried-partner households) (population 50,000+)"
- #3 on the list of "Top 101 cities with the largest percentage of likely homosexual households (counted as self-reported same-sex unmarried-partner households) (population 50,000+)"
- #8 on the list of "Top 101 cities with the smallest temperature differences during a year (population 50,000+)"
- #9 on the list of "Top 101 cities with the smallest differences between daily high and daily low temperatures (population 50,000+)"
- #9 on the list of "Top 101 cities with the biggest local government total salary and wages expenses per resident (population 10,000+)"
- #10 on the list of "Top 101 cities with the most people taking subway or elevated to work (population 5,000+)"
- #10 on the list of "Top 101 cities with the most people taking a bus, a trolley bus, a streetcar, or a trolley car to work (population 5,000+)"
- #12 on the list of "Top 101 cities with the most local government spending on current operations of parking facilities per resident (population 10,000+)"
- #13 on the list of "Top 100 cities with highest ratio of median house value to median household income (pop. 50,000+)"
- #13 on the list of "Top 101 cities with the least people driving a car to work alone (population 5,000+)"
- #14 on the list of "Top 100 cities with smallest houses (pop. 50,000+)"
- #15 on the list of "Top 101 cities with the most residents born in China, excluding Hong Kong and Taiwan (population 500+)"
- #15 on the list of "Top 101 cities with the lowest percentage of family households, population 100,000+"
- #16 on the list of "Top 101 cities with the largest racial income disparity between any two races with at least 2,000 householders"
- #17 on the list of "Top 100 cities with highest median house value (pop. 50,000+)"
- #18 on the list of "Top 100 biggest cities"
- #19 on the list of "Top 101 cities with the largest percentage of likely lesbian couples (counted as self-reported female-female unmarried-partner households) (population 50,000+)"
- #19 on the list of "Top 101 biggest cities in 2013"
- #21 on the list of "Top 101 cities with largest percentage of males in occupations: arts, design, entertainment, sports, and media occupations (population 50,000+)"
- #22 on the list of "Top 101 cities with largest percentage of females in occupations: arts, design, entertainment, sports, and media occupations (population 50,000+)"
- #2 (94111) on the list of "Top 101 zip codes with the largest charity contributions deductions as a percentage of AGI in 2012 (pop 1,000+)"
- #3 (94107) on the list of "Top 101 zip codes with the most Internet business establishments in 2005"
- #6 (94111) on the list of "Top 101 zip codes with the most finance and insurance companies in 2005"
- #6 (94111) on the list of "Top 101 zip codes with the highest 2012 average net capital gain/loss (pop 1,000+)"
- #9 (94108) on the list of "Top 101 zip codes with the most beauty salons in 2005"
- #11 (94123) on the list of "Top 101 zip codes with the highest 2012 average reported profit/loss from business (pop 5,000+)"
- #13 (94111) on the list of "Top 101 zip codes with the highest 2012 average Adjusted Gross Income (AGI) for individuals (pop 1,000+)"
- #13 (94133) on the list of "Top 101 zip codes with the most full service restaurants in 2005"
- #14 (94111) on the list of "Top 101 zip codes with the highest 2012 average taxable interest for individuals (pop 1,000+)"
- #14 (94105) on the list of "Top 101 zip codes with the most big companies in 2005 (at least 1000 employees)"
- #15 (94109) on the list of "Top 101 zip codes with the most alcohol drinking places in 2005"
- #17 (94102) on the list of "Top 101 zip codes with the most hotels or motels in 2005"
- #17 (94108) on the list of "Top 101 zip codes with the most museums in 2005"
- #17 (94105) on the list of "Top 101 zip codes with the most medium-big companies in 2005 (at least 100 employees)"
- #27 (94104) on the list of "Top 101 zip codes with the most offices of lawyers in 2005"
- #43 (94132) on the list of "Top 101 zip codes with the largest percentage of Ukrainian first ancestries (pop 5,000+)"
- #60 (94115) on the list of "Top 101 zip codes with the most offices of physicians in 2005"
- #90 (94133) on the list of "Top 101 zip codes with the largest percentage of Swiss first ancestries (pop 5,000+)"
- #92 (94105) on the list of "Top 101 zip codes with the highest average reported salary/wage in 2012 (pop 1,000+)"
- #1 on the list of "Top 101 counties with the lowest average weight of females"
- #2 on the list of "Top 101 counties with the highest percentage of residents that drank alcohol in the past 30 days"
- #12 on the list of "Top 101 counties with highest percentage of residents voting for Obama (Democrat) in the 2012 Presidential Election (pop. 50,000+)"
- #14 on the list of "Top 101 counties with the lowest lead air pollution readings in 2012 (µg/m3)"
- #16 on the list of "Top 101 counties with the largest decrease in the number of deaths per 1000 residents 2000-2006 to 2007-2013 (pop. 50,000+)"

|
|
Total of 49399 patent applications in 2008-2024.


