San Jacinto, California Submit your own pictures of this city and show them to the world
OSM Map
General Map
Google Map
MSN Map
OSM Map
General Map
Google Map
MSN Map
OSM Map
General Map
Google Map
MSN Map
OSM Map
General Map
Google Map
MSN Map
Please wait while loading the map...
Population in 2022: 55,470 (99% urban, 1% rural). Population change since 2000: +133.3%Males: 27,954 Females: 27,516
March 2022 cost of living index in San Jacinto: 81.6 (low, U.S. average is 100) Percentage of residents living in poverty in 2022: 17.1%for White Non-Hispanic residents , 12.8% for Black residents , 19.3% for Hispanic or Latino residents , 11.0% for American Indian residents , 92.6% for Native Hawaiian and other Pacific Islander residents , 18.1% for other race residents , 19.0% for two or more races residents )
Profiles of local businesses
Business Search - 14 Million verified businesses
Data:
Median household income ($)
Median household income (% change since 2000)
Household income diversity
Ratio of average income to average house value (%)
Ratio of average income to average rent
Median household income ($) - White
Median household income ($) - Black or African American
Median household income ($) - Asian
Median household income ($) - Hispanic or Latino
Median household income ($) - American Indian and Alaska Native
Median household income ($) - Multirace
Median household income ($) - Other Race
Median household income for houses/condos with a mortgage ($)
Median household income for apartments without a mortgage ($)
Races - White alone (%)
Races - White alone (% change since 2000)
Races - Black alone (%)
Races - Black alone (% change since 2000)
Races - American Indian alone (%)
Races - American Indian alone (% change since 2000)
Races - Asian alone (%)
Races - Asian alone (% change since 2000)
Races - Hispanic (%)
Races - Hispanic (% change since 2000)
Races - Native Hawaiian and Other Pacific Islander alone (%)
Races - Native Hawaiian and Other Pacific Islander alone (% change since 2000)
Races - Two or more races (%)
Races - Two or more races (% change since 2000)
Races - Other race alone (%)
Races - Other race alone (% change since 2000)
Racial diversity
Unemployment (%)
Unemployment (% change since 2000)
Unemployment (%) - White
Unemployment (%) - Black or African American
Unemployment (%) - Asian
Unemployment (%) - Hispanic or Latino
Unemployment (%) - American Indian and Alaska Native
Unemployment (%) - Multirace
Unemployment (%) - Other Race
Population density (people per square mile)
Population - Males (%)
Population - Females (%)
Population - Males (%) - White
Population - Males (%) - Black or African American
Population - Males (%) - Asian
Population - Males (%) - Hispanic or Latino
Population - Males (%) - American Indian and Alaska Native
Population - Males (%) - Multirace
Population - Males (%) - Other Race
Population - Females (%) - White
Population - Females (%) - Black or African American
Population - Females (%) - Asian
Population - Females (%) - Hispanic or Latino
Population - Females (%) - American Indian and Alaska Native
Population - Females (%) - Multirace
Population - Females (%) - Other Race
Coronavirus confirmed cases (Apr 25, 2024)
Deaths caused by coronavirus (Apr 25, 2024)
Coronavirus confirmed cases (per 100k population) (Apr 25, 2024)
Deaths caused by coronavirus (per 100k population) (Apr 25, 2024)
Daily increase in number of cases (Apr 25, 2024)
Weekly increase in number of cases (Apr 25, 2024)
Cases doubled (in days) (Apr 25, 2024)
Hospitalized patients (Apr 18, 2022)
Negative test results (Apr 18, 2022)
Total test results (Apr 18, 2022)
COVID Vaccine doses distributed (per 100k population) (Sep 19, 2023)
COVID Vaccine doses administered (per 100k population) (Sep 19, 2023)
COVID Vaccine doses distributed (Sep 19, 2023)
COVID Vaccine doses administered (Sep 19, 2023)
Likely homosexual households (%)
Likely homosexual households (% change since 2000)
Likely homosexual households - Lesbian couples (%)
Likely homosexual households - Lesbian couples (% change since 2000)
Likely homosexual households - Gay men (%)
Likely homosexual households - Gay men (% change since 2000)
Cost of living index
Median gross rent ($)
Median contract rent ($)
Median monthly housing costs ($)
Median house or condo value ($)
Median house or condo value ($ change since 2000)
Mean house or condo value by units in structure - 1, detached ($)
Mean house or condo value by units in structure - 1, attached ($)
Mean house or condo value by units in structure - 2 ($)
Mean house or condo value by units in structure by units in structure - 3 or 4 ($)
Mean house or condo value by units in structure - 5 or more ($)
Mean house or condo value by units in structure - Boat, RV, van, etc. ($)
Mean house or condo value by units in structure - Mobile home ($)
Median house or condo value ($) - White
Median house or condo value ($) - Black or African American
Median house or condo value ($) - Asian
Median house or condo value ($) - Hispanic or Latino
Median house or condo value ($) - American Indian and Alaska Native
Median house or condo value ($) - Multirace
Median house or condo value ($) - Other Race
Median resident age
Resident age diversity
Median resident age - Males
Median resident age - Females
Median resident age - White
Median resident age - Black or African American
Median resident age - Asian
Median resident age - Hispanic or Latino
Median resident age - American Indian and Alaska Native
Median resident age - Multirace
Median resident age - Other Race
Median resident age - Males - White
Median resident age - Males - Black or African American
Median resident age - Males - Asian
Median resident age - Males - Hispanic or Latino
Median resident age - Males - American Indian and Alaska Native
Median resident age - Males - Multirace
Median resident age - Males - Other Race
Median resident age - Females - White
Median resident age - Females - Black or African American
Median resident age - Females - Asian
Median resident age - Females - Hispanic or Latino
Median resident age - Females - American Indian and Alaska Native
Median resident age - Females - Multirace
Median resident age - Females - Other Race
Commute - mean travel time to work (minutes)
Travel time to work - Less than 5 minutes (%)
Travel time to work - Less than 5 minutes (% change since 2000)
Travel time to work - 5 to 9 minutes (%)
Travel time to work - 5 to 9 minutes (% change since 2000)
Travel time to work - 10 to 19 minutes (%)
Travel time to work - 10 to 19 minutes (% change since 2000)
Travel time to work - 20 to 29 minutes (%)
Travel time to work - 20 to 29 minutes (% change since 2000)
Travel time to work - 30 to 39 minutes (%)
Travel time to work - 30 to 39 minutes (% change since 2000)
Travel time to work - 40 to 59 minutes (%)
Travel time to work - 40 to 59 minutes (% change since 2000)
Travel time to work - 60 to 89 minutes (%)
Travel time to work - 60 to 89 minutes (% change since 2000)
Travel time to work - 90 or more minutes (%)
Travel time to work - 90 or more minutes (% change since 2000)
Marital status - Never married (%)
Marital status - Now married (%)
Marital status - Separated (%)
Marital status - Widowed (%)
Marital status - Divorced (%)
Median family income ($)
Median family income (% change since 2000)
Median non-family income ($)
Median non-family income (% change since 2000)
Median per capita income ($)
Median per capita income (% change since 2000)
Median family income ($) - White
Median family income ($) - Black or African American
Median family income ($) - Asian
Median family income ($) - Hispanic or Latino
Median family income ($) - American Indian and Alaska Native
Median family income ($) - Multirace
Median family income ($) - Other Race
Median year house/condo built
Median year apartment built
Year house built - Built 2005 or later (%)
Year house built - Built 2000 to 2004 (%)
Year house built - Built 1990 to 1999 (%)
Year house built - Built 1980 to 1989 (%)
Year house built - Built 1970 to 1979 (%)
Year house built - Built 1960 to 1969 (%)
Year house built - Built 1950 to 1959 (%)
Year house built - Built 1940 to 1949 (%)
Year house built - Built 1939 or earlier (%)
Average household size
Household density (households per square mile)
Average household size - White
Average household size - Black or African American
Average household size - Asian
Average household size - Hispanic or Latino
Average household size - American Indian and Alaska Native
Average household size - Multirace
Average household size - Other Race
Occupied housing units (%)
Vacant housing units (%)
Owner occupied housing units (%)
Renter occupied housing units (%)
Vacancy status - For rent (%)
Vacancy status - For sale only (%)
Vacancy status - Rented or sold, not occupied (%)
Vacancy status - For seasonal, recreational, or occasional use (%)
Vacancy status - For migrant workers (%)
Vacancy status - Other vacant (%)
Residents with income below the poverty level (%)
Residents with income below 50% of the poverty level (%)
Children below poverty level (%)
Poor families by family type - Married-couple family (%)
Poor families by family type - Male, no wife present (%)
Poor families by family type - Female, no husband present (%)
Poverty status for native-born residents (%)
Poverty status for foreign-born residents (%)
Poverty among high school graduates not in families (%)
Poverty among people who did not graduate high school not in families (%)
Residents with income below the poverty level (%) - White
Residents with income below the poverty level (%) - Black or African American
Residents with income below the poverty level (%) - Asian
Residents with income below the poverty level (%) - Hispanic or Latino
Residents with income below the poverty level (%) - American Indian and Alaska Native
Residents with income below the poverty level (%) - Multirace
Residents with income below the poverty level (%) - Other Race
Air pollution - Air Quality Index (AQI)
Air pollution - CO
Air pollution - NO2
Air pollution - SO2
Air pollution - Ozone
Air pollution - PM10
Air pollution - PM25
Air pollution - Pb
Crime - Murders per 100,000 population
Crime - Rapes per 100,000 population
Crime - Robberies per 100,000 population
Crime - Assaults per 100,000 population
Crime - Burglaries per 100,000 population
Crime - Thefts per 100,000 population
Crime - Auto thefts per 100,000 population
Crime - Arson per 100,000 population
Crime - City-data.com crime index
Crime - Violent crime index
Crime - Property crime index
Crime - Murders per 100,000 population (5 year average)
Crime - Rapes per 100,000 population (5 year average)
Crime - Robberies per 100,000 population (5 year average)
Crime - Assaults per 100,000 population (5 year average)
Crime - Burglaries per 100,000 population (5 year average)
Crime - Thefts per 100,000 population (5 year average)
Crime - Auto thefts per 100,000 population (5 year average)
Crime - Arson per 100,000 population (5 year average)
Crime - City-data.com crime index (5 year average)
Crime - Violent crime index (5 year average)
Crime - Property crime index (5 year average)
1996 Presidential Elections Results (%) - Democratic Party (Clinton)
1996 Presidential Elections Results (%) - Republican Party (Dole)
1996 Presidential Elections Results (%) - Other
2000 Presidential Elections Results (%) - Democratic Party (Gore)
2000 Presidential Elections Results (%) - Republican Party (Bush)
2000 Presidential Elections Results (%) - Other
2004 Presidential Elections Results (%) - Democratic Party (Kerry)
2004 Presidential Elections Results (%) - Republican Party (Bush)
2004 Presidential Elections Results (%) - Other
2008 Presidential Elections Results (%) - Democratic Party (Obama)
2008 Presidential Elections Results (%) - Republican Party (McCain)
2008 Presidential Elections Results (%) - Other
2012 Presidential Elections Results (%) - Democratic Party (Obama)
2012 Presidential Elections Results (%) - Republican Party (Romney)
2012 Presidential Elections Results (%) - Other
2016 Presidential Elections Results (%) - Democratic Party (Clinton)
2016 Presidential Elections Results (%) - Republican Party (Trump)
2016 Presidential Elections Results (%) - Other
2020 Presidential Elections Results (%) - Democratic Party (Biden)
2020 Presidential Elections Results (%) - Republican Party (Trump)
2020 Presidential Elections Results (%) - Other
Ancestries Reported - Arab (%)
Ancestries Reported - Czech (%)
Ancestries Reported - Danish (%)
Ancestries Reported - Dutch (%)
Ancestries Reported - English (%)
Ancestries Reported - French (%)
Ancestries Reported - French Canadian (%)
Ancestries Reported - German (%)
Ancestries Reported - Greek (%)
Ancestries Reported - Hungarian (%)
Ancestries Reported - Irish (%)
Ancestries Reported - Italian (%)
Ancestries Reported - Lithuanian (%)
Ancestries Reported - Norwegian (%)
Ancestries Reported - Polish (%)
Ancestries Reported - Portuguese (%)
Ancestries Reported - Russian (%)
Ancestries Reported - Scotch-Irish (%)
Ancestries Reported - Scottish (%)
Ancestries Reported - Slovak (%)
Ancestries Reported - Subsaharan African (%)
Ancestries Reported - Swedish (%)
Ancestries Reported - Swiss (%)
Ancestries Reported - Ukrainian (%)
Ancestries Reported - United States (%)
Ancestries Reported - Welsh (%)
Ancestries Reported - West Indian (%)
Ancestries Reported - Other (%)
Educational Attainment - No schooling completed (%)
Educational Attainment - Less than high school (%)
Educational Attainment - High school or equivalent (%)
Educational Attainment - Less than 1 year of college (%)
Educational Attainment - 1 or more years of college (%)
Educational Attainment - Associate degree (%)
Educational Attainment - Bachelor's degree (%)
Educational Attainment - Master's degree (%)
Educational Attainment - Professional school degree (%)
Educational Attainment - Doctorate degree (%)
School Enrollment - Nursery, preschool (%)
School Enrollment - Kindergarten (%)
School Enrollment - Grade 1 to 4 (%)
School Enrollment - Grade 5 to 8 (%)
School Enrollment - Grade 9 to 12 (%)
School Enrollment - College undergrad (%)
School Enrollment - Graduate or professional (%)
School Enrollment - Not enrolled in school (%)
School enrollment - Public schools (%)
School enrollment - Private schools (%)
School enrollment - Not enrolled (%)
Median number of rooms in houses and condos
Median number of rooms in apartments
Housing units lacking complete plumbing facilities (%)
Housing units lacking complete kitchen facilities (%)
Density of houses
Urban houses (%)
Rural houses (%)
Households with people 60 years and over (%)
Households with people 65 years and over (%)
Households with people 75 years and over (%)
Households with one or more nonrelatives (%)
Households with no nonrelatives (%)
Population in households (%)
Family households (%)
Nonfamily households (%)
Population in families (%)
Family households with own children (%)
Median number of bedrooms in owner occupied houses
Mean number of bedrooms in owner occupied houses
Median number of bedrooms in renter occupied houses
Mean number of bedrooms in renter occupied houses
Median number of vehichles in owner occupied houses
Mean number of vehichles in owner occupied houses
Median number of vehichles in renter occupied houses
Mean number of vehichles in renter occupied houses
Mortgage status - with mortgage (%)
Mortgage status - with second mortgage (%)
Mortgage status - with home equity loan (%)
Mortgage status - with both second mortgage and home equity loan (%)
Mortgage status - without a mortgage (%)
Average family size
Average family size - White
Average family size - Black or African American
Average family size - Asian
Average family size - Hispanic or Latino
Average family size - American Indian and Alaska Native
Average family size - Multirace
Average family size - Other Race
Geographical mobility - Same house 1 year ago (%)
Geographical mobility - Moved within same county (%)
Geographical mobility - Moved from different county within same state (%)
Geographical mobility - Moved from different state (%)
Geographical mobility - Moved from abroad (%)
Place of birth - Born in state of residence (%)
Place of birth - Born in other state (%)
Place of birth - Native, outside of US (%)
Place of birth - Foreign born (%)
Housing units in structures - 1, detached (%)
Housing units in structures - 1, attached (%)
Housing units in structures - 2 (%)
Housing units in structures - 3 or 4 (%)
Housing units in structures - 5 to 9 (%)
Housing units in structures - 10 to 19 (%)
Housing units in structures - 20 to 49 (%)
Housing units in structures - 50 or more (%)
Housing units in structures - Mobile home (%)
Housing units in structures - Boat, RV, van, etc. (%)
House/condo owner moved in on average (years ago)
Renter moved in on average (years ago)
Year householder moved into unit - Moved in 1999 to March 2000 (%)
Year householder moved into unit - Moved in 1995 to 1998 (%)
Year householder moved into unit - Moved in 1990 to 1994 (%)
Year householder moved into unit - Moved in 1980 to 1989 (%)
Year householder moved into unit - Moved in 1970 to 1979 (%)
Year householder moved into unit - Moved in 1969 or earlier (%)
Means of transportation to work - Drove car alone (%)
Means of transportation to work - Carpooled (%)
Means of transportation to work - Public transportation (%)
Means of transportation to work - Bus or trolley bus (%)
Means of transportation to work - Streetcar or trolley car (%)
Means of transportation to work - Subway or elevated (%)
Means of transportation to work - Railroad (%)
Means of transportation to work - Ferryboat (%)
Means of transportation to work - Taxicab (%)
Means of transportation to work - Motorcycle (%)
Means of transportation to work - Bicycle (%)
Means of transportation to work - Walked (%)
Means of transportation to work - Other means (%)
Working at home (%)
Industry diversity
Most Common Industries - Agriculture, forestry, fishing and hunting, and mining (%)
Most Common Industries - Agriculture, forestry, fishing and hunting (%)
Most Common Industries - Mining, quarrying, and oil and gas extraction (%)
Most Common Industries - Construction (%)
Most Common Industries - Manufacturing (%)
Most Common Industries - Wholesale trade (%)
Most Common Industries - Retail trade (%)
Most Common Industries - Transportation and warehousing, and utilities (%)
Most Common Industries - Transportation and warehousing (%)
Most Common Industries - Utilities (%)
Most Common Industries - Information (%)
Most Common Industries - Finance and insurance, and real estate and rental and leasing (%)
Most Common Industries - Finance and insurance (%)
Most Common Industries - Real estate and rental and leasing (%)
Most Common Industries - Professional, scientific, and management, and administrative and waste management services (%)
Most Common Industries - Professional, scientific, and technical services (%)
Most Common Industries - Management of companies and enterprises (%)
Most Common Industries - Administrative and support and waste management services (%)
Most Common Industries - Educational services, and health care and social assistance (%)
Most Common Industries - Educational services (%)
Most Common Industries - Health care and social assistance (%)
Most Common Industries - Arts, entertainment, and recreation, and accommodation and food services (%)
Most Common Industries - Arts, entertainment, and recreation (%)
Most Common Industries - Accommodation and food services (%)
Most Common Industries - Other services, except public administration (%)
Most Common Industries - Public administration (%)
Occupation diversity
Most Common Occupations - Management, business, science, and arts occupations (%)
Most Common Occupations - Management, business, and financial occupations (%)
Most Common Occupations - Management occupations (%)
Most Common Occupations - Business and financial operations occupations (%)
Most Common Occupations - Computer, engineering, and science occupations (%)
Most Common Occupations - Computer and mathematical occupations (%)
Most Common Occupations - Architecture and engineering occupations (%)
Most Common Occupations - Life, physical, and social science occupations (%)
Most Common Occupations - Education, legal, community service, arts, and media occupations (%)
Most Common Occupations - Community and social service occupations (%)
Most Common Occupations - Legal occupations (%)
Most Common Occupations - Education, training, and library occupations (%)
Most Common Occupations - Arts, design, entertainment, sports, and media occupations (%)
Most Common Occupations - Healthcare practitioners and technical occupations (%)
Most Common Occupations - Health diagnosing and treating practitioners and other technical occupations (%)
Most Common Occupations - Health technologists and technicians (%)
Most Common Occupations - Service occupations (%)
Most Common Occupations - Healthcare support occupations (%)
Most Common Occupations - Protective service occupations (%)
Most Common Occupations - Fire fighting and prevention, and other protective service workers including supervisors (%)
Most Common Occupations - Law enforcement workers including supervisors (%)
Most Common Occupations - Food preparation and serving related occupations (%)
Most Common Occupations - Building and grounds cleaning and maintenance occupations (%)
Most Common Occupations - Personal care and service occupations (%)
Most Common Occupations - Sales and office occupations (%)
Most Common Occupations - Sales and related occupations (%)
Most Common Occupations - Office and administrative support occupations (%)
Most Common Occupations - Natural resources, construction, and maintenance occupations (%)
Most Common Occupations - Farming, fishing, and forestry occupations (%)
Most Common Occupations - Construction and extraction occupations (%)
Most Common Occupations - Installation, maintenance, and repair occupations (%)
Most Common Occupations - Production, transportation, and material moving occupations (%)
Most Common Occupations - Production occupations (%)
Most Common Occupations - Transportation occupations (%)
Most Common Occupations - Material moving occupations (%)
People in Group quarters - Institutionalized population (%)
People in Group quarters - Correctional institutions (%)
People in Group quarters - Federal prisons and detention centers (%)
People in Group quarters - Halfway houses (%)
People in Group quarters - Local jails and other confinement facilities (including police lockups) (%)
People in Group quarters - Military disciplinary barracks (%)
People in Group quarters - State prisons (%)
People in Group quarters - Other types of correctional institutions (%)
People in Group quarters - Nursing homes (%)
People in Group quarters - Hospitals/wards, hospices, and schools for the handicapped (%)
People in Group quarters - Hospitals/wards and hospices for chronically ill (%)
People in Group quarters - Hospices or homes for chronically ill (%)
People in Group quarters - Military hospitals or wards for chronically ill (%)
People in Group quarters - Other hospitals or wards for chronically ill (%)
People in Group quarters - Hospitals or wards for drug/alcohol abuse (%)
People in Group quarters - Mental (Psychiatric) hospitals or wards (%)
People in Group quarters - Schools, hospitals, or wards for the mentally retarded (%)
People in Group quarters - Schools, hospitals, or wards for the physically handicapped (%)
People in Group quarters - Institutions for the deaf (%)
People in Group quarters - Institutions for the blind (%)
People in Group quarters - Orthopedic wards and institutions for the physically handicapped (%)
People in Group quarters - Wards in general hospitals for patients who have no usual home elsewhere (%)
People in Group quarters - Wards in military hospitals for patients who have no usual home elsewhere (%)
People in Group quarters - Juvenile institutions (%)
People in Group quarters - Long-term care (%)
People in Group quarters - Homes for abused, dependent, and neglected children (%)
People in Group quarters - Residential treatment centers for emotionally disturbed children (%)
People in Group quarters - Training schools for juvenile delinquents (%)
People in Group quarters - Short-term care, detention or diagnostic centers for delinquent children (%)
People in Group quarters - Type of juvenile institution unknown (%)
People in Group quarters - Noninstitutionalized population (%)
People in Group quarters - College dormitories (includes college quarters off campus) (%)
People in Group quarters - Military quarters (%)
People in Group quarters - On base (%)
People in Group quarters - Barracks, unaccompanied personnel housing (UPH), (Enlisted/Officer), ;and similar group living quarters for military personnel (%)
People in Group quarters - Transient quarters for temporary residents (%)
People in Group quarters - Military ships (%)
People in Group quarters - Group homes (%)
People in Group quarters - Homes or halfway houses for drug/alcohol abuse (%)
People in Group quarters - Homes for the mentally ill (%)
People in Group quarters - Homes for the mentally retarded (%)
People in Group quarters - Homes for the physically handicapped (%)
People in Group quarters - Other group homes (%)
People in Group quarters - Religious group quarters (%)
People in Group quarters - Dormitories (%)
People in Group quarters - Agriculture workers' dormitories on farms (%)
People in Group quarters - Job Corps and vocational training facilities (%)
People in Group quarters - Other workers' dormitories (%)
People in Group quarters - Crews of maritime vessels (%)
People in Group quarters - Other nonhousehold living situations (%)
People in Group quarters - Other noninstitutional group quarters (%)
Residents speaking English at home (%)
Residents speaking English at home - Born in the United States (%)
Residents speaking English at home - Native, born elsewhere (%)
Residents speaking English at home - Foreign born (%)
Residents speaking Spanish at home (%)
Residents speaking Spanish at home - Born in the United States (%)
Residents speaking Spanish at home - Native, born elsewhere (%)
Residents speaking Spanish at home - Foreign born (%)
Residents speaking other language at home (%)
Residents speaking other language at home - Born in the United States (%)
Residents speaking other language at home - Native, born elsewhere (%)
Residents speaking other language at home - Foreign born (%)
Class of Workers - Employee of private company (%)
Class of Workers - Self-employed in own incorporated business (%)
Class of Workers - Private not-for-profit wage and salary workers (%)
Class of Workers - Local government workers (%)
Class of Workers - State government workers (%)
Class of Workers - Federal government workers (%)
Class of Workers - Self-employed workers in own not incorporated business and Unpaid family workers (%)
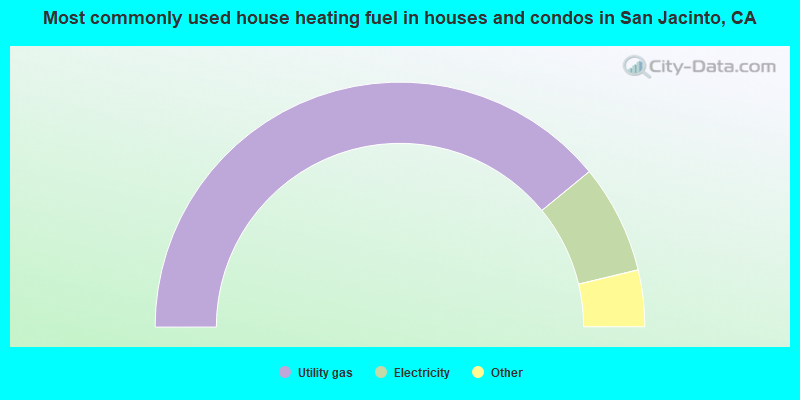
House heating fuel used in houses and condos - Utility gas (%)
House heating fuel used in houses and condos - Bottled, tank, or LP gas (%)
House heating fuel used in houses and condos - Electricity (%)
House heating fuel used in houses and condos - Fuel oil, kerosene, etc. (%)
House heating fuel used in houses and condos - Coal or coke (%)
House heating fuel used in houses and condos - Wood (%)
House heating fuel used in houses and condos - Solar energy (%)
House heating fuel used in houses and condos - Other fuel (%)
House heating fuel used in houses and condos - No fuel used (%)
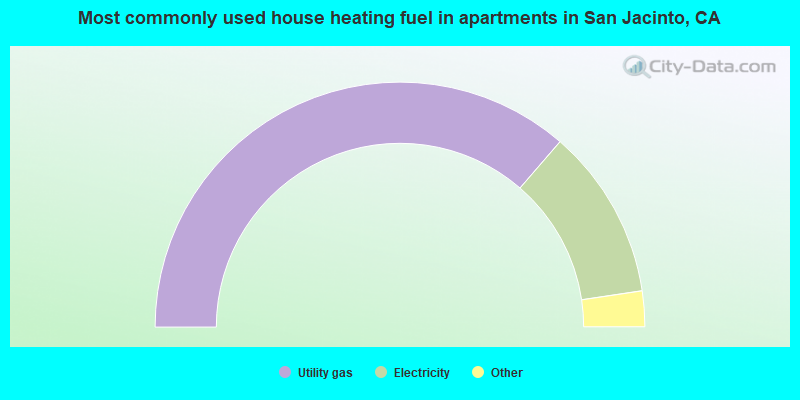
House heating fuel used in apartments - Utility gas (%)
House heating fuel used in apartments - Bottled, tank, or LP gas (%)
House heating fuel used in apartments - Electricity (%)
House heating fuel used in apartments - Fuel oil, kerosene, etc. (%)
House heating fuel used in apartments - Coal or coke (%)
House heating fuel used in apartments - Wood (%)
House heating fuel used in apartments - Solar energy (%)
House heating fuel used in apartments - Other fuel (%)
House heating fuel used in apartments - No fuel used (%)
Armed forces status - In Armed Forces (%)
Armed forces status - Civilian (%)
Armed forces status - Civilian - Veteran (%)
Armed forces status - Civilian - Nonveteran (%)
Fatal accidents locations in years 2005-2021
Fatal accidents locations in 2005
Fatal accidents locations in 2006
Fatal accidents locations in 2007
Fatal accidents locations in 2008
Fatal accidents locations in 2009
Fatal accidents locations in 2010
Fatal accidents locations in 2011
Fatal accidents locations in 2012
Fatal accidents locations in 2013
Fatal accidents locations in 2014
Fatal accidents locations in 2015
Fatal accidents locations in 2016
Fatal accidents locations in 2017
Fatal accidents locations in 2018
Fatal accidents locations in 2019
Fatal accidents locations in 2020
Fatal accidents locations in 2021
Alcohol use - People drinking some alcohol every month (%)
Alcohol use - People not drinking at all (%)
Alcohol use - Average days/month drinking alcohol
Alcohol use - Average drinks/week
Alcohol use - Average days/year people drink much
Audiometry - Average condition of hearing (%)
Audiometry - People that can hear a whisper from across a quiet room (%)
Audiometry - People that can hear normal voice from across a quiet room (%)
Audiometry - Ears ringing, roaring, buzzing (%)
Audiometry - Had a job exposure to loud noise (%)
Audiometry - Had off-work exposure to loud noise (%)
Blood Pressure & Cholesterol - Has high blood pressure (%)
Blood Pressure & Cholesterol - Checking blood pressure at home (%)
Blood Pressure & Cholesterol - Frequently checking blood cholesterol (%)
Blood Pressure & Cholesterol - Has high cholesterol level (%)
Consumer Behavior - Money monthly spent on food at supermarket/grocery store
Consumer Behavior - Money monthly spent on food at other stores
Consumer Behavior - Money monthly spent on eating out
Consumer Behavior - Money monthly spent on carryout/delivered foods
Consumer Behavior - Income spent on food at supermarket/grocery store (%)
Consumer Behavior - Income spent on food at other stores (%)
Consumer Behavior - Income spent on eating out (%)
Consumer Behavior - Income spent on carryout/delivered foods (%)
Current Health Status - General health condition (%)
Current Health Status - Blood donors (%)
Current Health Status - Has blood ever tested for HIV virus (%)
Current Health Status - Left-handed people (%)
Dermatology - People using sunscreen (%)
Diabetes - Diabetics (%)
Diabetes - Had a blood test for high blood sugar (%)
Diabetes - People taking insulin (%)
Diet Behavior & Nutrition - Diet health (%)
Diet Behavior & Nutrition - Milk product consumption (# of products/month)
Diet Behavior & Nutrition - Meals not home prepared (#/week)
Diet Behavior & Nutrition - Meals from fast food or pizza place (#/week)
Diet Behavior & Nutrition - Ready-to-eat foods (#/month)
Diet Behavior & Nutrition - Frozen meals/pizza (#/month)
Drug Use - People that ever used marijuana or hashish (%)
Drug Use - Ever used hard drugs (%)
Drug Use - Ever used any form of cocaine (%)
Drug Use - Ever used heroin (%)
Drug Use - Ever used methamphetamine (%)
Health Insurance - People covered by health insurance (%)
Kidney Conditions-Urology - Avg. # of times urinating at night
Medical Conditions - People with asthma (%)
Medical Conditions - People with anemia (%)
Medical Conditions - People with psoriasis (%)
Medical Conditions - People with overweight (%)
Medical Conditions - Elderly people having difficulties in thinking or remembering (%)
Medical Conditions - People who ever received blood transfusion (%)
Medical Conditions - People having trouble seeing even with glass/contacts (%)
Medical Conditions - People with arthritis (%)
Medical Conditions - People with gout (%)
Medical Conditions - People with congestive heart failure (%)
Medical Conditions - People with coronary heart disease (%)
Medical Conditions - People with angina pectoris (%)
Medical Conditions - People who ever had heart attack (%)
Medical Conditions - People who ever had stroke (%)
Medical Conditions - People with emphysema (%)
Medical Conditions - People with thyroid problem (%)
Medical Conditions - People with chronic bronchitis (%)
Medical Conditions - People with any liver condition (%)
Medical Conditions - People who ever had cancer or malignancy (%)
Mental Health - People who have little interest in doing things (%)
Mental Health - People feeling down, depressed, or hopeless (%)
Mental Health - People who have trouble sleeping or sleeping too much (%)
Mental Health - People feeling tired or having little energy (%)
Mental Health - People with poor appetite or overeating (%)
Mental Health - People feeling bad about themself (%)
Mental Health - People who have trouble concentrating on things (%)
Mental Health - People moving or speaking slowly or too fast (%)
Mental Health - People having thoughts they would be better off dead (%)
Oral Health - Average years since last visit a dentist
Oral Health - People embarrassed because of mouth (%)
Oral Health - People with gum disease (%)
Oral Health - General health of teeth and gums (%)
Oral Health - Average days a week using dental floss/device
Oral Health - Average days a week using mouthwash for dental problem
Oral Health - Average number of teeth
Pesticide Use - Households using pesticides to control insects (%)
Pesticide Use - Households using pesticides to kill weeds (%)
Physical Activity - People doing vigorous-intensity work activities (%)
Physical Activity - People doing moderate-intensity work activities (%)
Physical Activity - People walking or bicycling (%)
Physical Activity - People doing vigorous-intensity recreational activities (%)
Physical Activity - People doing moderate-intensity recreational activities (%)
Physical Activity - Average hours a day doing sedentary activities
Physical Activity - Average hours a day watching TV or videos
Physical Activity - Average hours a day using computer
Physical Functioning - People having limitations keeping them from working (%)
Physical Functioning - People limited in amount of work they can do (%)
Physical Functioning - People that need special equipment to walk (%)
Physical Functioning - People experiencing confusion/memory problems (%)
Physical Functioning - People requiring special healthcare equipment (%)
Prescription Medications - Average number of prescription medicines taking
Preventive Aspirin Use - Adults 40+ taking low-dose aspirin (%)
Reproductive Health - Vaginal deliveries (%)
Reproductive Health - Cesarean deliveries (%)
Reproductive Health - Deliveries resulted in a live birth (%)
Reproductive Health - Pregnancies resulted in a delivery (%)
Reproductive Health - Women breastfeeding newborns (%)
Reproductive Health - Women that had a hysterectomy (%)
Reproductive Health - Women that had both ovaries removed (%)
Reproductive Health - Women that have ever taken birth control pills (%)
Reproductive Health - Women taking birth control pills (%)
Reproductive Health - Women that have ever used Depo-Provera or injectables (%)
Reproductive Health - Women that have ever used female hormones (%)
Sexual Behavior - People 18+ that ever had sex (vaginal, anal, or oral) (%)
Sexual Behavior - Males 18+ that ever had vaginal sex with a woman (%)
Sexual Behavior - Males 18+ that ever performed oral sex on a woman (%)
Sexual Behavior - Males 18+ that ever had anal sex with a woman (%)
Sexual Behavior - Males 18+ that ever had any sex with a man (%)
Sexual Behavior - Females 18+ that ever had vaginal sex with a man (%)
Sexual Behavior - Females 18+ that ever performed oral sex on a man (%)
Sexual Behavior - Females 18+ that ever had anal sex with a man (%)
Sexual Behavior - Females 18+ that ever had any kind of sex with a woman (%)
Sexual Behavior - Average age people first had sex
Sexual Behavior - Average number of female sex partners in lifetime (males 18+)
Sexual Behavior - Average number of female vaginal sex partners in lifetime (males 18+)
Sexual Behavior - Average age people first performed oral sex on a woman (18+)
Sexual Behavior - Average number of woman performed oral sex on in lifetime (18+)
Sexual Behavior - Average number of male sex partners in lifetime (males 18+)
Sexual Behavior - Average number of male anal sex partners in lifetime (males 18+)
Sexual Behavior - Average age people first performed oral sex on a man (18+)
Sexual Behavior - Average number of male oral sex partners in lifetime (18+)
Sexual Behavior - People using protection when performing oral sex (%)
Sexual Behavior - Average number of times people have vaginal or anal sex a year
Sexual Behavior - People having sex without condom (%)
Sexual Behavior - Average number of male sex partners in lifetime (females 18+)
Sexual Behavior - Average number of male vaginal sex partners in lifetime (females 18+)
Sexual Behavior - Average number of female sex partners in lifetime (females 18+)
Sexual Behavior - Circumcised males 18+ (%)
Sleep Disorders - Average hours sleeping at night
Sleep Disorders - People that has trouble sleeping (%)
Smoking-Cigarette Use - People smoking cigarettes (%)
Taste & Smell - People 40+ having problems with smell (%)
Taste & Smell - People 40+ having problems with taste (%)
Taste & Smell - People 40+ that ever had wisdom teeth removed (%)
Taste & Smell - People 40+ that ever had tonsils teeth removed (%)
Taste & Smell - People 40+ that ever had a loss of consciousness because of a head injury (%)
Taste & Smell - People 40+ that ever had a broken nose or other serious injury to face or skull (%)
Taste & Smell - People 40+ that ever had two or more sinus infections (%)
Weight - Average height (inches)
Weight - Average weight (pounds)
Weight - Average BMI
Weight - People that are obese (%)
Weight - People that ever were obese (%)
Weight - People trying to lose weight (%)
34,558 62.8% Hispanic 12,521 22.7% White alone 4,090 7.4% Black alone 1,692 3.1% Asian alone 1,648 3.0% Two or more races 421 0.8% Native Hawaiian and Other 335 0.6% Other race alone 122 0.2% American Indian alone
The City-Data.com crime index weighs serious crimes and violent crimes more heavily. Higher means more crime, U.S. average is 246.1. It adjusts for the number of visitors and daily workers commuting into cities.
- means the value is smaller than the state average.
- means the value is about the same as the state average.
- means the value is bigger than the state average.
- means the value is much bigger than the state average.
Crime rate in San Jacinto detailed stats: murders, rapes, robberies, assaults, burglaries, thefts, arson Officers per 1,000 residents here:
0.02California average:
1.98
Latest news from San Jacinto, CA collected exclusively by city-data.com from local newspapers, TV, and radio stations
Ancestries: American (3.8%), Irish (2.7%), German (2.1%), English (1.1%).
Current Local Time:
Land area: 24.9 square miles.
Population density: 2,227 people per square mile (low).
9,677 residents are foreign born (14.0% Latin America , 2.3% Asia ).
This city:
17.6%California:
26.5%
Median real estate property taxes paid for housing units with mortgages in 2022: $4,008 (0.9%)Median real estate property taxes paid for housing units with no mortgage in 2022: $2,069 (0.7%)
Nearest city with pop. 50,000+: Hemet, CA
Nearest city with pop. 200,000+: Riverside, CA
Nearest city with pop. 1,000,000+: San Diego, CA
Nearest cities:
Latitude: 33.79 N, Longitude: 116.97 W
Daytime population change due to commuting: -11,191 (-20.3%)Workers who live and work in this city: 5,180 (23.2%)
Single-family new house construction building permits:
2022: 214 buildings , average cost: $400,0002021: 123 buildings , average cost: $175,6002020: 126 buildings , average cost: $175,6002019: 147 buildings , average cost: $131,9002018: 158 buildings , average cost: $147,9002017: 158 buildings , average cost: $144,8002016: 146 buildings , average cost: $150,3002015: 113 buildings , average cost: $154,9002014: 56 buildings , average cost: $163,2002013: 35 buildings , average cost: $161,0002012: 43 buildings , average cost: $175,9002011: 13 buildings , average cost: $139,3002010: 38 buildings , average cost: $133,6002009: 9 buildings , average cost: $134,3002008: 14 buildings , average cost: $154,8002007: 276 buildings , average cost: $174,6002006: 991 buildings , average cost: $206,2002005: 1968 buildings , average cost: $189,4002004: 857 buildings , average cost: $171,5002003: 431 buildings , average cost: $147,0002002: 342 buildings , average cost: $134,4002001: 229 buildings , average cost: $118,8002000: 153 buildings , average cost: $112,9001999: 346 buildings , average cost: $102,9001998: 183 buildings , average cost: $133,4001997: 65 buildings , average cost: $98,500Unemployment in December 2023:
Population change in the 1990s: +5,825 (+32.4%).
Most common occupations in San Jacinto, CA (%)
Both Males Females
Building and grounds cleaning and maintenance occupations (5.4%)
Secretaries and administrative assistants (3.9%)
Driver/sales workers and truck drivers (3.8%)
Other management occupations, except farmers and farm managers (3.8%)
Other sales and related occupations, including supervisors (3.7%)
Preschool, kindergarten, elementary, and middle school teachers (3.2%)
Other production occupations, including supervisors (2.9%)
Building and grounds cleaning and maintenance occupations (8.2%)
Driver/sales workers and truck drivers (6.6%)
Construction laborers (4.3%)
Agricultural workers, including supervisors (4.2%)
Electrical equipment mechanics and other installation, maintenance, and repair workers, including supervisors (4.1%)
Metal workers and plastic workers (3.9%)
Other sales and related occupations, including supervisors (3.8%)
Secretaries and administrative assistants (8.1%)
Registered nurses (5.0%)
Other office and administrative support workers, including supervisors (4.3%)
Preschool, kindergarten, elementary, and middle school teachers (4.1%)
Supervisors and other personal care and service workers, except child care workers (4.1%)
Other management occupations, except farmers and farm managers (4.1%)
Nursing, psychiatric, and home health aides (3.9%)
Earthquake activity:
San Jacinto-area historical earthquake activity is significantly above California state average. It is 7098% greater than the overall U.S. average. On 6/28/1992 at 11:57:34, a magnitude 7.6 (6.2 MB, 7.6 MS, 7.3 MW, Depth: 0.7 mi, Class: Major, Intensity: VIII - XII) earthquake occurred 37.1 miles away from the city center, causing 3 deaths ( 1 shaking deaths, 2 other deaths) and 400 injuries, causing $100,000,000 total damage and $40,000,000 insured lossesOn 10/16/1999 at 09:46:44, a magnitude 7.4 (6.3 MB, 7.4 MS, 7.2 MW, 7.3 ML) earthquake occurred 58.8 miles away from the city center On 7/21/1952 at 11:52:14, a magnitude 7.7 (7.7 UK) earthquake occurred 143.2 miles away from the city center, causing $50,000,000 total damage On 5/19/1940 at 04:36:40, a magnitude 7.2 (7.2 UK) earthquake occurred 83.0 miles away from San Jacinto center, causing $33,000,000 total damage On 6/28/1992 at 15:05:30, a magnitude 6.9 (6.3 MB, 6.7 MS, 6.5 MW, 6.9 ME, Depth: 3.1 mi, Class: Strong, Intensity: VII - IX) earthquake occurred 35.8 miles away from San Jacinto center On 4/21/1918 at 22:32:30, a magnitude 6.8 (6.8 UK) earthquake occurred 27.3 miles away from the city center Magnitude types: body-wave magnitude (MB), energy magnitude (ME), local magnitude (ML), surface-wave magnitude (MS), moment magnitude (MW) Natural disasters: The number of natural disasters in Riverside County (46) is a lot greater than the US average (15).Major Disasters (Presidential) Declared: 27Emergencies Declared: 1Fires: 22, Floods: 20, Storms: 8, Winter Storms: 8, Landslides: 6, Mudslides: 5, Heavy Rains: 2, Earthquake: 1, Flash Flood: 1, Freeze: 1, Hurricane: 1, Tornado: 1, Tropical Storm: 1, Other: 1 (Note: some incidents may be assigned to more than one category). Hospitals and medical centers in San Jacinto: THE BRADLEY GARDENS (980 WEST SEVENTH STREET)
Other hospitals and medical centers near San Jacinto: HEMET VALLEY MEDICAL CENTER (about 3 miles away; HEMET, CA)
HEMET HEALTHCARE SURGICENTER (Hospital, about 3 miles away; HEMET, CA)
DEVONSHIRE CARE CENTER (Nursing Home, about 3 miles away; HEMET, CA)
SAN JACINTO HEALTHCARE (Nursing Home, about 3 miles away; HEMET, CA)
DAVITA-DIAMOND VALLEY DIALYSIS CENTER (Dialysis Facility, about 3 miles away; HEMET, CA)
HEMET HOME HEALTH CARE (Home Health Center, about 4 miles away; HEMET, CA)
THE VILLAGE HEALTHCARE CENTER (Nursing Home, about 4 miles away; HEMET, CA)
Amtrak stations near San Jacinto: 4 miles: HEMET (COCOS REST., 3246 FLORIDA AVE.) - Bus Station 10 miles: BEAUMONT (550 BEAUMONT AVE.) - Bus Station Services: fully wheelchair accessible, public restrooms, full-service food facilities, free short-term parking.
15 miles: PERRIS (B.W. PERRIS INN, 480 REDLANDS AVE.) - Bus Station
Colleges/Universities in San Jacinto: Mt San Jacinto Community College District Full-time enrollment: 8,426; Location: 1499 N. State St.; Public; Website: www.msjc.edu)
Advance Beauty Techs Academy Full-time enrollment: 64; Location: 641 N State St Ste 1; Private, for-profit; Website: WWW.ABT-ACADEMY.NET)
Other colleges/universities with over 2000 students near San Jacinto:
Moreno Valley College (about 16 miles; Moreno Valley, CA ; Full-time enrollment: 4,650)
Crafton Hills College (about 20 miles; Yucaipa, CA ; FT enrollment: 3,222)
University of Redlands (about 23 miles; Redlands, CA ; FT enrollment: 4,854)
University of California-Riverside (about 25 miles; Riverside, CA ; FT enrollment: 20,647)
Loma Linda University (about 25 miles; Loma Linda, CA ; FT enrollment: 2,839)
The Art Institute of California-Argosy University Inland Empire (about 27 miles; San Bernardino, CA ; FT enrollment: 2,238)
Riverside City College (about 27 miles; Riverside, CA ; FT enrollment: 10,661)
Public high schools in San Jacinto: SAN JACINTO HIGH Students: 1,568, Location: 500 IDYLLWILD DR., Grades: 9-12)SAN JACINTO VALLEY ACADEMY Students: 347, Location: 480 N. SAN JACINTO AVE., Grades: KG-12, Charter school )MOUNTAIN VIEW HIGH Students: 17, Location: 1000 RAMONA BLVD., Grades: 9-12)MOUNTAIN HEIGHTS ACADEMY Location: 1000 RAMONA BLVD., Grades: KG-12)
NOLI SCHOOL Location: 24330 SOBABA RD, Grades: 6-12)
Biggest public elementary/middle schools in San Jacinto: NORTH MOUNTAIN MIDDLE Students: 918, Location: 1202 E. SEVENTH ST., Grades: 6-8)MONTE VISTA MIDDLE Students: 896, Location: 181 N. RAMONA BLVD., Grades: 6-8)PARK HILL ELEMENTARY Students: 512, Location: 1157 E. COMMONWEALTH AVE., Grades: KG-5)ESTUDILLO ELEMENTARY Students: 379, Location: 900 LAS ROSAS DR., Grades: KG-5)CLAYTON A. RECORD, JR., ELEMENTARY Students: 378, Location: 1600 MALAGA DR., Grades: KG-5)SAN JACINTO ELEMENTARY Students: 302, Location: 136 N. RAMONA BLVD., Grades: KG-5)HYATT ELEMENTARY Location: 400 E. SHAVER ST., Grades: KG-5)
DE ANZA ELEMENTARY Location: 1089 DEANZA DR., Grades: KG-5)
MEGAN COPE ELEMENTARY Location: 2550 VIA LA SIERRA LN., Grades: KG-5)SAN JACINTO LEADERSHIP ACADEMY - MAGNET Location: 1599 MALAGA DR., Grades: 6-8)
Private elementary/middle schools in San Jacinto: ST HYACINTH ACADEMY Students: 272, Location: 275 S VICTORIA AVE, Grades: PK-8)
ST JUDE SCHOOL Students: 21, Location: 23600 SOBOBA RD, Grades: KG-4)
See full list of schools located in San Jacinto
Notable locations in San Jacinto: (A) , Soboba Springs Country Club (B) , American Medical Response San Jacinto (C) , San Jacinto Community Center (D) , San Jacinto Branch Riverside City and County Public Library (E) , San Jacinto City Hall (F) , San Jacinto City Administration Building (G) , Riverside County Fire Department Station 78 San Jacinto (H) , Riverside County Fire Department Station 25 San Jacinto (I) . Display/hide their locations on the map
Shopping Centers: (1) , San Jacinto Shopping Center (2) , Old Town Plaza Shopping Center (3) , Farmers Corner Shopping Center (4) , Esplanada Plaza Shopping Center (5) . Display/hide their locations on the map
Church in San Jacinto: (A) . Display/hide its location on the map
Cemetery: (1) . Display/hide its location on the map
Reservoirs: (A) , San Jacinto Reservoir (B) . Display/hide their locations on the map
Streams, rivers, and creeks: (A) . Display/hide its location on the map
Parks in San Jacinto include: (1) , Mistletoe Park (2) , Rancho Park (3) , Salee Park (4) , Valley Wide Regional Park (5) . Display/hide their locations on the map
Birthplace of: Jake Newton (ice hockey) - Ice hockey defenceman.
Riverside County has a predicted average indoor radon screening level between 2 and 4 pCi/L (pico curies per liter) - Moderate Potential Average household size: This city:
3.3 peopleCalifornia:
2.9 people
Percentage of family households: This city:
75.9%Whole state:
68.7%
Percentage of households with unmarried partners: This city:
8.0%Whole state:
7.2%
Likely homosexual households (counted as self-reported same-sex unmarried-partner households)
Lesbian couples: 0.5% of all households Gay men: 0.4% of all households
People in group quarters in San Jacinto in 2010:
89 people in workers' group living quarters and job corps centers
63 people in group homes intended for adults
43 people in nursing facilities/skilled-nursing facilities
16 people in residential treatment centers for adults
9 people in group homes for juveniles (non-correctional)
7 people in residential treatment centers for juveniles (non-correctional)
People in group quarters in San Jacinto in 2000:
71 people in other noninstitutional group quarters
44 people in other group homes
30 people in nursing homes
28 people in homes or halfway houses for drug/alcohol abuse
11 people in agriculture workers' dormitories on farms
3 people in homes for the mentally ill
2 people in homes for the mentally retarded
Banks with branches in San Jacinto (2011 data):
JPMorgan Chase Bank, National Association: San Jacinto Stater Bros Bakning Cent at 1271 North Stater Street, branch established on 2010/03/08; Esplanade & San Jacinto Banking Cent at 1579 South San Jacinto Avenue, branch established on 2011/04/19. Info updated 2011/11/10: Bank assets: $1,811,678.0 mil, Deposits: $1,190,738.0 mil, headquarters in Columbus, OH, positive income , International Specialization, 5577 total offices , Holding Company: Jpmorgan Chase & Co.
The Bank of Hemet: San Jacinto Branch at 1891 South San Jacinto Avenue, Suite A, branch established on 1989/06/30. Info updated 2009/12/28: Bank assets: $439.8 mil, Deposits: $386.3 mil, headquarters in Riverside, CA, positive income , Commercial Lending Specialization, 6 total offices , Holding Company: Hemet Bancorp
U.S. Bank National Association: San Jacinto Branch at 1251 N. State St, branch established on 2007/08/20. Info updated 2012/01/30: Bank assets: $330,470.8 mil, Deposits: $236,091.5 mil, headquarters in Cincinnati, OH, positive income , 3121 total offices , Holding Company: U.S. Bancorp
For population 15 years and over in San Jacinto:
Never married: 39.6%Now married: 44.5%Separated: 2.3%Widowed: 4.1%Divorced: 9.6% For population 25 years and over in San Jacinto:
High school or higher: 78.5%Bachelor's degree or higher: 13.0%Graduate or professional degree: 4.0%Unemployed: 11.6%Mean travel time to work (commute): 37.4 minutes
Education Gini index (Inequality in education) Here:
14.5California average:
15.5
Religion statistics for San Jacinto, CA (based on Riverside County data)
Religion Adherents Congregations Catholic 602,765 51 Evangelical Protestant 240,306 741 Other 77,581 194 Mainline Protestant 29,535 103 Black Protestant 19,170 40 Orthodox 3,647 11 None 1,216,637 -
Source: Clifford Grammich, Kirk Hadaway, Richard Houseal, Dale E.Jones, Alexei Krindatch, Richie Stanley and Richard H.Taylor. 2012. 2010 U.S.Religion Census: Religious Congregations & Membership Study. Association of Statisticians of American Religious Bodies. Jones, Dale E., et al. 2002. Congregations and Membership in the United States 2000. Nashville, TN: Glenmary Research Center. Graphs represent county-level data
Food Environment Statistics: Number of grocery stores : 330Riverside County :
1.60 / 10,000 pop.California :
2.14 / 10,000 pop.
Number of supercenters and club stores : 11Riverside County :
0.05 / 10,000 pop.State :
0.04 / 10,000 pop.
Number of convenience stores (no gas) : 91Here :
0.44 / 10,000 pop.California :
0.62 / 10,000 pop.
Number of convenience stores (with gas) : 311Here :
1.51 / 10,000 pop.California :
1.49 / 10,000 pop.
Number of full-service restaurants : 1,125Riverside County :
5.45 / 10,000 pop.State :
7.42 / 10,000 pop.
Adult diabetes rate : This county :
7.7%California :
7.3%
Adult obesity rate : Riverside County :
24.5%California :
21.3%
Low-income preschool obesity rate : Riverside County :
15.2%California :
17.9%
Health and Nutrition: Healthy diet rate : San Jacinto:
48.4%California:
49.4%
Average overall health of teeth and gums : This city:
45.9%California:
48.0%
Average BMI : This city:
28.6California:
28.1
People feeling badly about themselves : Here:
22.3%California:
20.2%
People not drinking alcohol at all : San Jacinto:
11.1%California:
11.2%
Average hours sleeping at night : Overweight people : San Jacinto:
33.3%State:
31.5%
General health condition : This city:
53.8%State:
56.4%
Average condition of hearing : Here:
78.3%California:
80.9%
More about Health and Nutrition of San Jacinto, CA Residents
Local government employment and payroll (March 2022)
Function
Full-time employees
Monthly full-time payroll
Average yearly full-time wage
Part-time employees
Monthly part-time payroll
Other Government Administration
14 $63,280 $54,240 8 $4,444 Other and Unallocable
11 $82,199 $89,672 0 $0 Financial Administration
11 $82,132 $89,599 0 $0 Water Supply
8 $58,041 $87,062 0 $0 Parks and Recreation
6 $37,669 $75,338 0 $0 Sewerage
4 $29,751 $89,253 0 $0 Streets and Highways
3 $15,626 $62,504 7 $15,998 Natural Resources
3 $17,059 $68,236 0 $0 Housing and Community Development (Local)
1 $10,567 $126,804 0 $0
Totals for Government
61 $396,324 $77,965 15 $20,442
San Jacinto government finances - Expenditure in 2017 (per resident):
Construction - Housing and Community Development: $718,000 ($12.94)
Central Staff Services: $650,000 ($11.72)Regular Highways: $335,000 ($6.04)Current Operations - Police Protection: $10,265,000 ($185.05)
Regular Highways: $5,839,000 ($105.26)Water Utilities: $3,855,000 ($69.50)Central Staff Services: $3,705,000 ($66.79)Local Fire Protection: $2,975,000 ($53.63)Protective Inspection and Regulation - Other: $1,340,000 ($24.16)Sewerage: $737,000 ($13.29)Financial Administration: $711,000 ($12.82)Parks and Recreation: $310,000 ($5.59)Solid Waste Management: $127,000 ($2.29)Health - Other: $7,000 ($0.13)Housing and Community Development: $3,000 ($0.05)General - Interest on Debt: $434,000 ($7.82)
Other Capital Outlay - Regular Highways: $123,000 ($2.22)
Police Protection: $103,000 ($1.86)General - Other: $91,000 ($1.64)Water Utilities: $29,000 ($0.52)Parks and Recreation: $13,000 ($0.23)Financial Administration: $8,000 ($0.14)Water Utilities - Interest on Debt: $709,000 ($12.78)
San Jacinto government finances - Revenue in 2017 (per resident):
Charges - Other: $3,323,000 ($59.91)
Sewerage: $936,000 ($16.87)Regular Highways: $14,000 ($0.25)Federal Intergovernmental - Housing and Community Development: $487,000 ($8.78)
Other: $118,000 ($2.13)Miscellaneous - General Revenue - Other: $3,742,000 ($67.46)
Fines and Forfeits: $677,000 ($12.20)Special Assessments: $300,000 ($5.41)Rents: $74,000 ($1.33)Sale of Property: $8,000 ($0.14)Donations From Private Sources: $4,000 ($0.07)Revenue - Water Utilities: $3,821,000 ($68.88)
State Intergovernmental - Other: $1,040,000 ($18.75)
Highways: $910,000 ($16.41)General Local Government Support: $20,000 ($0.36)Tax - Property: $9,960,000 ($179.56)
General Sales and Gross Receipts: $3,629,000 ($65.42)Public Utilities Sales: $1,833,000 ($33.04)Other License: $1,041,000 ($18.77)Occupation and Business License - Other: $198,000 ($3.57)Documentary and Stock Transfer: $171,000 ($3.08)Other Selective Sales: $38,000 ($0.69)
San Jacinto government finances - Debt in 2017 (per resident):
Long Term Debt - Beginning Outstanding - Unspecified Public Purpose: $28,577,000 ($515.18)
Outstanding Unspecified Public Purpose: $26,222,000 ($472.72)Retired Unspecified Public Purpose: $2,355,000 ($42.46)
San Jacinto government finances - Cash and Securities in 2017 (per resident):
Bond Funds - Cash and Securities: $7,574,000 ($136.54)
Other Funds - Cash and Securities: $35,937,000 ($647.86)
7.19% of this county's 2021 resident taxpayers lived in other counties in 2020 ($71,521 average adjusted gross income )
Here:
7.19%California average:
5.19%
0.03% of residents moved from foreign countries ($210 average AGI )Riverside County:
0.03%California average:
0.03%
Top counties from which taxpayers relocated into this county between 2020 and 2021:
6.28% of this county's 2020 resident taxpayers moved to other counties in 2021 ($64,593 average adjusted gross income )
Here:
6.28%California average:
6.14%
0.02% of residents moved to foreign countries ($200 average AGI )Riverside County:
0.02%California average:
0.02%
Top counties to which taxpayers relocated from this county between 2020 and 2021:
Businesses in San Jacinto, CA
Name Count Name Count
7-Eleven 2 Penske 1 AT&T 1 Pizza Hut 1 AutoZone 1 Rite Aid 2 Burger King 1 Starbucks 2 CVS 1 Subway 3 Carl\s Jr. 1 T-Mobile 1 Dennys 1 Taco Bell 1 El Pollo Loco 1 True Value 1 FedEx 5 U-Haul 2 GNC 1 UPS 4 GameStop 1 Walgreens 3 H&R Block 1 Walmart 1 McDonald's 2 Wendy's 1 Panda Express 1
Strongest AM radio stations in San Jacinto:
KSDT (1320 AM; 1 kW; HEMET, CA; Owner: RUDEX BROADCASTING LIMITED)
KPLS (830 AM; 50 kW; ORANGE, CA; Owner: CRN LICENSES, LLC)
KLAC (570 AM; 50 kW; LOS ANGELES, CA; Owner: AMFM RADIO LICENSES, L.L.C.)
KFI (640 AM; 50 kW; LOS ANGELES, CA; Owner: CAPSTAR TX LIMITED PARTNERSHIP)
KHPY (1670 AM; 10 kW; MORENO VALLEY, CA; Owner: DELBERT L. VAN VOORHIS)
KFMB (760 AM; 50 kW; SAN DIEGO, CA; Owner: MIDWEST TELEVISION, INC.)
KTNQ (1020 AM; 50 kW; LOS ANGELES, CA; Owner: KTNQ-AM LICENSE CORP.)
KXTA (1150 AM; 50 kW; LOS ANGELES, CA; Owner: CITICASTERS LICENSES, L.P.)
KDIS (1110 AM; 50 kW; PASADENA, CA; Owner: ABC,INC.)
KNWQ (1140 AM; 10 kW; PALM SPRINGS, CA; Owner: MCC RADIO, LLC)
KCBQ (1170 AM; 50 kW; SAN DIEGO, CA; Owner: RADIO 1210, INC.)
KFWB (980 AM; 50 kW; LOS ANGELES, CA; Owner: INFINITY BROADCASTING OPERATIONS, INC.)
KSPN (710 AM; 50 kW; LOS ANGELES, CA; Owner: KABC-AM RADIO, INC.)
Strongest FM radio stations in San Jacinto:
KWRP (96.1 FM; SAN JACINTO, CA; Owner: MAGIC BROADCASTING, INC.)
KPLM-FM2 (106.1 FM; SAN JACINTO, CA; Owner: RM BROADCASTING L.L.C.)
KLRD (90.1 FM; YUCAIPA, CA; Owner: EDUCATIONAL MEDIA FOUNDATION)
KXRS (105.7 FM; HEMET, CA; Owner: LAZER BROADCASTING CORPORATION)
KATY-FM (101.3 FM; IDYLLWILD, CA; Owner: ALL PRO BROADCASTING, INC.)
KRTM (88.9 FM; TEMECULA, CA; Owner: PENFOLD COMMUNICATIONS, INC.)
K201AR (88.1 FM; BANNING, CA; Owner: KSGN, INC.)
K232CX (94.3 FM; DESERT HOT SPRINGS, CA; Owner: MCC RADIO, LLC)
KUOR-FM (89.1 FM; REDLANDS, CA; Owner: UNIVERSITY OF REDLANDS)
KOLA (99.9 FM; SAN BERNARDINO, CA; Owner: INLAND EMPIRE BROADCASTING CORP.)
KAEH (100.9 FM; BEAUMONT, CA; Owner: MOON BROADCASTING RIVERSIDE, LLC)
KVCR (91.9 FM; SAN BERNARDINO, CA; Owner: SAN BERNARDINO COMMUNITY COLLEGE DISTRICT)
KUCR (88.3 FM; RIVERSIDE, CA; Owner: THE REGENTS OF THE UNIV. OF CA)
KWVE (107.9 FM; SAN CLEMENTE, CA; Owner: CALVARY CHAPEL OF COSTA MESA)
KCXX (103.9 FM; LAKE ARROWHEAD, CA; Owner: ALL-PRO BROADCASTING, INC.)
KXFG (92.9 FM; SUN CITY, CA; Owner: INFINITY RADIO OPERATIONS INC.)
KGGI (99.1 FM; RIVERSIDE, CA; Owner: AMFM RADIO LICENSES, L.L.C.)
KLYY (97.5 FM; RIVERSIDE, CA; Owner: ENTRAVISION HOLDINGS, LLC)
K201CD (88.1 FM; VICTORVILLE, CA; Owner: SAN BERNARDINO COMMNTY COLLEGE DIST.)
K295AI (106.9 FM; MUSCOY, CA; Owner: ASSOCIATION FOR COMMUNITY EDUCATION, INC.)
TV broadcast stations around San Jacinto:
KTRO-LP (Channel 50; LANCASTER, CA; Owner: ROBERT D. ADELMAN)
KHIZ (Channel 64; BARSTOW, CA; Owner: SUNBELT TELEVISION, INC.)
KESQ-TV (Channel 42; PALM SPRINGS, CA; Owner: GULF-CALIFORNIA BROADCAST COMPANY)
KHEM-LP (Channel 53; HEMET, CA; Owner: LA VERTA W. AND VICTOR W. PAGE)
National Bridge Inventory (NBI) Statistics 7 Number of bridges197ft / 59.5m Total length40,355 Total average daily traffic569 Total average daily truck traffic64,720 Total future (year 2037) average daily traffic
Home Mortgage Disclosure Act Aggregated Statistics For Year 2009(Based on 1 full and 7 partial tracts) A) FHA, FSA/RHS & VA B) Conventional C) Refinancings D) Home Improvement Loans E) Loans on Dwellings For 5+ Families F) Non-occupant Loans on G) Loans On Manufactured Number Average Value Number Average Value Number Average Value Number Average Value Number Average Value Number Average Value Number Average Value
LOANS ORIGINATED 457 $140,796 218 $107,033 155 $165,253 6 $33,570 1 $2,233,000 110 $94,347 9 $103,919 APPLICATIONS APPROVED, NOT ACCEPTED 36 $147,231 29 $130,211 30 $165,272 3 $48,043 0 $0 16 $112,139 3 $91,047 APPLICATIONS DENIED 82 $145,913 66 $119,308 129 $159,882 20 $53,416 1 $1,089,950 39 $109,008 11 $80,842 APPLICATIONS WITHDRAWN 48 $145,095 43 $110,408 65 $170,773 7 $51,414 0 $0 22 $105,181 2 $124,260 FILES CLOSED FOR INCOMPLETENESS 14 $153,776 10 $112,846 16 $190,469 1 $69,440 0 $0 3 $139,517 1 $59,160
Aggregated Statistics For Year 2008(Based on 1 full and 7 partial tracts) A) FHA, FSA/RHS & VA B) Conventional C) Refinancings D) Home Improvement Loans E) Loans on Dwellings For 5+ Families F) Non-occupant Loans on G) Loans On Manufactured Number Average Value Number Average Value Number Average Value Number Average Value Number Average Value Number Average Value Number Average Value
LOANS ORIGINATED 319 $186,417 242 $141,493 144 $181,688 22 $51,666 1 $1,350,000 105 $134,536 19 $92,777 APPLICATIONS APPROVED, NOT ACCEPTED 19 $189,900 55 $142,963 62 $188,879 6 $66,332 0 $0 19 $140,708 14 $72,236 APPLICATIONS DENIED 83 $200,280 133 $171,738 326 $246,334 49 $105,597 0 $0 50 $164,721 21 $95,322 APPLICATIONS WITHDRAWN 47 $193,383 62 $163,715 77 $215,314 6 $96,405 0 $0 30 $182,442 2 $75,455 FILES CLOSED FOR INCOMPLETENESS 7 $229,967 14 $215,879 28 $257,065 7 $74,891 0 $0 8 $200,880 0 $0
Aggregated Statistics For Year 2007(Based on 1 full and 7 partial tracts) A) FHA, FSA/RHS & VA B) Conventional C) Refinancings D) Home Improvement Loans E) Loans on Dwellings For 5+ Families F) Non-occupant Loans on G) Loans On Manufactured Number Average Value Number Average Value Number Average Value Number Average Value Number Average Value Number Average Value Number Average Value
LOANS ORIGINATED 31 $293,919 571 $215,933 728 $216,821 116 $112,434 4 $609,495 157 $215,369 32 $119,679 APPLICATIONS APPROVED, NOT ACCEPTED 1 $192,010 173 $203,006 270 $235,333 42 $100,101 0 $0 54 $215,555 17 $79,646 APPLICATIONS DENIED 10 $284,805 331 $236,797 979 $263,294 158 $128,100 3 $2,809,090 143 $238,018 31 $75,162 APPLICATIONS WITHDRAWN 13 $306,481 179 $214,082 372 $256,078 34 $135,996 1 $781,380 48 $217,386 7 $143,317 FILES CLOSED FOR INCOMPLETENESS 2 $203,050 41 $227,230 127 $282,659 9 $162,956 0 $0 10 $224,439 1 $114,280
Aggregated Statistics For Year 2006(Based on 1 full and 7 partial tracts) A) FHA, FSA/RHS & VA B) Conventional C) Refinancings D) Home Improvement Loans E) Loans on Dwellings For 5+ Families F) Non-occupant Loans on G) Loans On Manufactured Number Average Value Number Average Value Number Average Value Number Average Value Number Average Value Number Average Value Number Average Value
LOANS ORIGINATED 21 $314,261 2,210 $200,647 1,305 $220,835 184 $116,357 3 $560,667 295 $207,192 33 $132,017 APPLICATIONS APPROVED, NOT ACCEPTED 3 $238,987 443 $207,675 340 $233,363 57 $110,705 0 $0 67 $210,082 20 $77,476 APPLICATIONS DENIED 6 $298,090 734 $204,805 954 $248,669 192 $108,809 1 $405,200 140 $226,067 32 $109,867 APPLICATIONS WITHDRAWN 4 $262,620 661 $215,606 636 $240,403 57 $130,293 1 $1,400,000 70 $201,215 3 $150,167 FILES CLOSED FOR INCOMPLETENESS 0 $0 115 $196,335 152 $254,601 8 $174,536 0 $0 30 $212,818 2 $169,375
Aggregated Statistics For Year 2005(Based on 1 full and 7 partial tracts) A) FHA, FSA/RHS & VA B) Conventional C) Refinancings D) Home Improvement Loans E) Loans on Dwellings For 5+ Families F) Non-occupant Loans on G) Loans On Manufactured Number Average Value Number Average Value Number Average Value Number Average Value Number Average Value Number Average Value Number Average Value
LOANS ORIGINATED 62 $258,774 2,155 $181,550 1,435 $201,109 203 $116,715 3 $1,483,197 358 $190,317 42 $94,218 APPLICATIONS APPROVED, NOT ACCEPTED 2 $280,360 429 $187,136 270 $196,054 43 $112,895 1 $9,188,000 62 $197,265 18 $78,062 APPLICATIONS DENIED 7 $210,236 667 $187,205 741 $212,867 173 $87,256 1 $816,180 109 $200,133 33 $94,767 APPLICATIONS WITHDRAWN 6 $246,197 461 $199,284 569 $214,504 96 $138,712 3 $496,293 77 $194,110 14 $101,198 FILES CLOSED FOR INCOMPLETENESS 2 $201,860 97 $204,603 180 $215,586 14 $104,959 0 $0 17 $225,207 3 $213,390
Aggregated Statistics For Year 2004(Based on 1 full and 7 partial tracts) A) FHA, FSA/RHS & VA B) Conventional C) Refinancings D) Home Improvement Loans E) Loans on Dwellings For 5+ Families F) Non-occupant Loans on G) Loans On Manufactured Number Average Value Number Average Value Number Average Value Number Average Value Number Average Value Number Average Value Number Average Value
LOANS ORIGINATED 62 $199,684 1,362 $158,592 1,368 $164,947 159 $104,167 5 $828,524 369 $154,910 34 $110,047 APPLICATIONS APPROVED, NOT ACCEPTED 4 $181,358 214 $156,852 282 $158,706 19 $92,628 0 $0 58 $141,154 14 $78,264 APPLICATIONS DENIED 14 $201,369 325 $155,328 530 $162,183 128 $77,242 3 $415,210 81 $150,632 30 $77,820 APPLICATIONS WITHDRAWN 11 $186,512 207 $167,130 418 $164,726 70 $101,453 0 $0 57 $154,734 9 $75,429 FILES CLOSED FOR INCOMPLETENESS 2 $184,775 50 $158,504 140 $169,231 12 $100,891 1 $320,000 22 $111,523 3 $104,263
Aggregated Statistics For Year 2003(Based on 1 full and 7 partial tracts) A) FHA, FSA/RHS & VA B) Conventional C) Refinancings D) Home Improvement Loans E) Loans on Dwellings For 5+ Families F) Non-occupant Loans on Number Average Value Number Average Value Number Average Value Number Average Value Number Average Value Number Average Value
LOANS ORIGINATED 189 $161,600 717 $119,823 1,513 $119,847 38 $52,949 4 $2,856,552 227 $108,650 APPLICATIONS APPROVED, NOT ACCEPTED 15 $176,776 118 $123,109 261 $124,834 19 $47,792 0 $0 34 $124,131 APPLICATIONS DENIED 22 $148,986 169 $107,881 558 $115,332 67 $33,988 0 $0 75 $113,542 APPLICATIONS WITHDRAWN 14 $153,511 94 $122,004 395 $128,715 31 $56,196 0 $0 25 $130,079 FILES CLOSED FOR INCOMPLETENESS 6 $147,757 21 $122,180 58 $128,849 8 $59,754 0 $0 7 $108,201
Aggregated Statistics For Year 2002(Based on 1 full tract) A) FHA, FSA/RHS & VA B) Conventional C) Refinancings D) Home Improvement Loans E) Loans on Dwellings For 5+ Families F) Non-occupant Loans on Number Average Value Number Average Value Number Average Value Number Average Value Number Average Value Number Average Value
LOANS ORIGINATED 49 $93,878 106 $81,387 130 $76,631 6 $28,333 5 $184,000 54 $80,796 APPLICATIONS APPROVED, NOT ACCEPTED 4 $115,750 12 $85,583 23 $77,957 2 $16,000 0 $0 2 $64,000 APPLICATIONS DENIED 5 $141,400 30 $80,833 92 $76,957 17 $25,118 2 $191,500 7 $83,857 APPLICATIONS WITHDRAWN 2 $146,000 18 $90,389 45 $84,933 3 $42,333 0 $0 13 $94,231 FILES CLOSED FOR INCOMPLETENESS 2 $80,500 6 $113,167 14 $83,786 0 $0 0 $0 3 $79,333
Aggregated Statistics For Year 2001(Based on 1 full tract) A) FHA, FSA/RHS & VA B) Conventional C) Refinancings D) Home Improvement Loans E) Loans on Dwellings For 5+ Families F) Non-occupant Loans on Number Average Value Number Average Value Number Average Value Number Average Value Number Average Value Number Average Value
LOANS ORIGINATED 46 $92,391 39 $63,462 89 $66,978 7 $25,714 4 $1,108,000 19 $63,789 APPLICATIONS APPROVED, NOT ACCEPTED 3 $79,333 12 $61,250 16 $70,375 1 $37,000 0 $0 8 $42,875 APPLICATIONS DENIED 9 $76,444 22 $57,227 83 $59,289 12 $18,750 1 $120,000 17 $63,412 APPLICATIONS WITHDRAWN 5 $103,400 10 $69,700 52 $70,596 5 $16,600 0 $0 7 $67,714 FILES CLOSED FOR INCOMPLETENESS 1 $146,000 1 $79,000 6 $113,667 1 $85,000 0 $0 0 $0
Aggregated Statistics For Year 2000(Based on 1 full tract) A) FHA, FSA/RHS & VA B) Conventional C) Refinancings D) Home Improvement Loans E) Loans on Dwellings For 5+ Families F) Non-occupant Loans on Number Average Value Number Average Value Number Average Value Number Average Value Number Average Value Number Average Value
LOANS ORIGINATED 55 $75,273 30 $55,233 35 $55,457 6 $27,833 1 $72,000 14 $65,429 APPLICATIONS APPROVED, NOT ACCEPTED 4 $55,000 4 $62,000 9 $65,778 7 $21,714 0 $0 1 $57,000 APPLICATIONS DENIED 8 $74,125 18 $50,444 73 $73,452 15 $24,467 0 $0 9 $74,667 APPLICATIONS WITHDRAWN 0 $0 6 $49,167 21 $93,714 2 $20,000 0 $0 2 $35,500 FILES CLOSED FOR INCOMPLETENESS 0 $0 0 $0 8 $68,125 0 $0 0 $0 1 $67,000
Aggregated Statistics For Year 1999(Based on 1 full and 2 partial tracts) A) FHA, FSA/RHS & VA B) Conventional C) Refinancings D) Home Improvement Loans E) Loans on Dwellings For 5+ Families F) Non-occupant Loans on Number Average Value Number Average Value Number Average Value Number Average Value Number Average Value Number Average Value
LOANS ORIGINATED 181 $92,511 174 $67,026 167 $76,830 34 $26,711 5 $1,792,894 42 $69,855 APPLICATIONS APPROVED, NOT ACCEPTED 9 $97,236 18 $60,927 44 $74,196 22 $24,380 1 $76,080 5 $58,036 APPLICATIONS DENIED 21 $112,102 96 $57,453 167 $72,636 56 $22,559 2 $445,965 20 $69,174 APPLICATIONS WITHDRAWN 36 $99,061 45 $69,431 76 $76,436 7 $24,726 2 $107,735 8 $88,180 FILES CLOSED FOR INCOMPLETENESS 1 $128,770 3 $65,537 35 $79,941 0 $0 0 $0 3 $39,500
Detailed HMDA statistics for the following Tracts:
0427.21
, 0435.06 , 0435.07 , 0435.08 , 0435.09 , 0435.10 , 0435.11 , 0436.00
Private Mortgage Insurance Companies Aggregated Statistics For Year 2009(Based on 1 full and 6 partial tracts) A) Conventional B) Refinancings C) Non-occupant Loans on Number Average Value Number Average Value Number Average Value
LOANS ORIGINATED 19 $131,565 0 $0 1 $174,370 APPLICATIONS APPROVED, NOT ACCEPTED 10 $151,301 2 $186,510 0 $0 APPLICATIONS DENIED 8 $122,755 0 $0 0 $0 APPLICATIONS WITHDRAWN 4 $105,555 0 $0 0 $0 FILES CLOSED FOR INCOMPLETENESS 1 $295,490 0 $0 0 $0
Aggregated Statistics For Year 2008(Based on 1 full and 7 partial tracts) A) Conventional B) Refinancings C) Non-occupant Loans on Number Average Value Number Average Value Number Average Value
LOANS ORIGINATED 90 $192,494 25 $283,526 12 $168,907 APPLICATIONS APPROVED, NOT ACCEPTED 48 $238,020 47 $301,972 2 $213,475 APPLICATIONS DENIED 21 $178,771 5 $283,350 7 $171,911 APPLICATIONS WITHDRAWN 7 $229,630 2 $271,885 0 $0 FILES CLOSED FOR INCOMPLETENESS 4 $243,875 4 $269,002 1 $278,950
Aggregated Statistics For Year 2007(Based on 1 full and 7 partial tracts) A) Conventional B) Refinancings C) Non-occupant Loans on Number Average Value Number Average Value Number Average Value
LOANS ORIGINATED 94 $290,375 63 $309,628 6 $295,505 APPLICATIONS APPROVED, NOT ACCEPTED 18 $302,066 27 $333,576 1 $340,270 APPLICATIONS DENIED 1 $507,350 6 $240,365 2 $241,350 APPLICATIONS WITHDRAWN 7 $300,537 7 $345,461 2 $189,240 FILES CLOSED FOR INCOMPLETENESS 1 $405,990 1 $308,130 0 $0
Aggregated Statistics For Year 2006(Based on 1 full and 7 partial tracts) A) Conventional B) Refinancings C) Non-occupant Loans on D) Loans On Manufactured Number Average Value Number Average Value Number Average Value Number Average Value
LOANS ORIGINATED 49 $323,645 36 $302,695 4 $252,412 1 $180,470 APPLICATIONS APPROVED, NOT ACCEPTED 15 $344,359 18 $319,567 1 $406,300 0 $0 APPLICATIONS DENIED 8 $333,165 1 $323,910 2 $444,310 0 $0 APPLICATIONS WITHDRAWN 5 $352,658 3 $340,913 1 $234,000 0 $0 FILES CLOSED FOR INCOMPLETENESS 1 $340,560 0 $0 0 $0 0 $0
Aggregated Statistics For Year 2005(Based on 1 full and 7 partial tracts) A) Conventional B) Refinancings C) Non-occupant Loans on D) Loans On Manufactured Number Average Value Number Average Value Number Average Value Number Average Value
LOANS ORIGINATED 59 $268,629 32 $263,136 8 $298,998 1 $166,530 APPLICATIONS APPROVED, NOT ACCEPTED 12 $291,015 6 $253,190 5 $331,828 0 $0 APPLICATIONS DENIED 0 $0 1 $342,110 0 $0 0 $0 APPLICATIONS WITHDRAWN 7 $247,154 4 $285,352 3 $272,493 0 $0 FILES CLOSED FOR INCOMPLETENESS 0 $0 0 $0 0 $0 0 $0
Aggregated Statistics For Year 2004(Based on 1 full and 7 partial tracts) A) Conventional B) Refinancings C) Non-occupant Loans on Number Average Value Number Average Value Number Average Value
LOANS ORIGINATED 100 $207,444 40 $209,798 28 $176,344 APPLICATIONS APPROVED, NOT ACCEPTED 33 $204,580 23 $192,147 4 $112,620 APPLICATIONS DENIED 2 $165,365 2 $200,480 1 $182,730 APPLICATIONS WITHDRAWN 6 $179,690 4 $203,705 2 $226,075 FILES CLOSED FOR INCOMPLETENESS 1 $92,430 0 $0 0 $0
Aggregated Statistics For Year 2003(Based on 1 full and 7 partial tracts) A) Conventional B) Refinancings C) Non-occupant Loans on Number Average Value Number Average Value Number Average Value
LOANS ORIGINATED 115 $162,361 87 $151,066 19 $136,176 APPLICATIONS APPROVED, NOT ACCEPTED 18 $151,919 39 $136,448 3 $171,773 APPLICATIONS DENIED 5 $171,384 1 $292,100 2 $102,965 APPLICATIONS WITHDRAWN 5 $142,506 3 $159,390 0 $0 FILES CLOSED FOR INCOMPLETENESS 1 $116,420 0 $0 1 $75,900
Aggregated Statistics For Year 2002(Based on 1 full tract) A) Conventional B) Refinancings C) Non-occupant Loans on Number Average Value Number Average Value Number Average Value
LOANS ORIGINATED 28 $95,607 9 $96,444 9 $109,778 APPLICATIONS APPROVED, NOT ACCEPTED 3 $72,000 2 $75,500 2 $82,000 APPLICATIONS DENIED 0 $0 0 $0 0 $0 APPLICATIONS WITHDRAWN 2 $81,500 0 $0 1 $86,000 FILES CLOSED FOR INCOMPLETENESS 0 $0 0 $0 0 $0
Aggregated Statistics For Year 2001(Based on 1 full tract) A) Conventional B) Refinancings C) Non-occupant Loans on Number Average Value Number Average Value Number Average Value
LOANS ORIGINATED 9 $77,667 7 $76,714 2 $39,000 APPLICATIONS APPROVED, NOT ACCEPTED 3 $71,000 2 $99,000 0 $0 APPLICATIONS DENIED 0 $0 0 $0 0 $0 APPLICATIONS WITHDRAWN 0 $0 1 $94,000 0 $0 FILES CLOSED FOR INCOMPLETENESS 0 $0 0 $0 0 $0
Aggregated Statistics For Year 2000(Based on 1 full tract) A) Conventional B) Refinancings C) Non-occupant Loans on Number Average Value Number Average Value Number Average Value
LOANS ORIGINATED 13 $62,846 2 $66,500 1 $52,000 APPLICATIONS APPROVED, NOT ACCEPTED 3 $77,000 3 $56,667 1 $99,000 APPLICATIONS DENIED 0 $0 0 $0 0 $0 APPLICATIONS WITHDRAWN 0 $0 0 $0 0 $0 FILES CLOSED FOR INCOMPLETENESS 0 $0 0 $0 0 $0
Aggregated Statistics For Year 1999(Based on 1 full and 2 partial tracts) A) Conventional B) Refinancings C) Non-occupant Loans on Number Average Value Number Average Value Number Average Value
LOANS ORIGINATED 31 $86,264 16 $112,118 3 $58,353 APPLICATIONS APPROVED, NOT ACCEPTED 4 $90,972 3 $100,617 1 $64,400 APPLICATIONS DENIED 2 $49,585 1 $200,030 1 $27,710 APPLICATIONS WITHDRAWN 0 $0 0 $0 0 $0 FILES CLOSED FOR INCOMPLETENESS 1 $41,840 0 $0 0 $0
Detailed PMIC statistics for the following Tracts:
0427.21
, 0435.06 , 0435.07 , 0435.08 , 0435.09 , 0435.10 , 0435.11 , 0436.00
Most common first names in San Jacinto, CA among deceased individuals Name Count Lived (average)
Robert 114 74.9 years James 96 74.0 years John 88 77.3 years William 81 77.0 years Mary 75 79.6 years Dorothy 60 81.7 years Richard 57 71.2 years Donald 43 74.8 years Charles 42 76.8 years George 41 76.8 years
Most common last names in San Jacinto, CA among deceased individuals Last name Count Lived (average)
Smith 41 77.9 years Jones 32 74.1 years Johnson 25 77.0 years Davis 19 79.3 years White 19 79.7 years Brown 18 78.7 years Martin 18 73.6 years Miller 18 72.7 years Wilson 17 76.2 years Baker 16 74.9 years
San Jacinto compared to California state average:
Median house value below state average. Black race population percentage significantly above state average. Hispanic race population percentage significantly above state average. Foreign-born population percentage above state average. House age significantly below state average. Percentage of population with a bachelor's degree or higher below state average. San Jacinto on our top lists :
#73 on the list of "Top 101 cities with the largest city-data.com crime index per police officer (population 5,000+)"
#3 on the list of "Top 101 counties with the highest lead air pollution readings in 2012 (µg/m3 )"
#4 on the list of "Top 101 counties with the highest ground withdrawal of fresh water for public supply"
#11 on the list of "Top 101 counties with the most Catholic adherents"
#11 on the list of "Top 101 counties with the highest total withdrawal of fresh water for public supply"
#12 on the list of "Top 101 counties with the highest carbon monoxide air pollution readings in 2012 (ppm)"
Top Patent Applicants
Oswaldo Gonzalez (8)
Mark A. Calkins (4)
Hua Chung (3)
Edna M. Hutchinson (1)
Ronald Lee (1)
Benard W. Sandoval (1)
Johna Nicole Bowden (1)
David Hilker (1)
Kenneth Saunders (1)
Andrew Jones (1)
Total of 25 patent applications in 2008-2024.
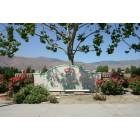
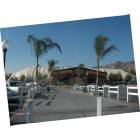
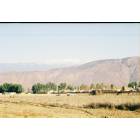
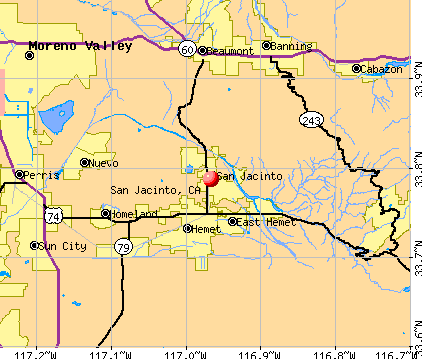


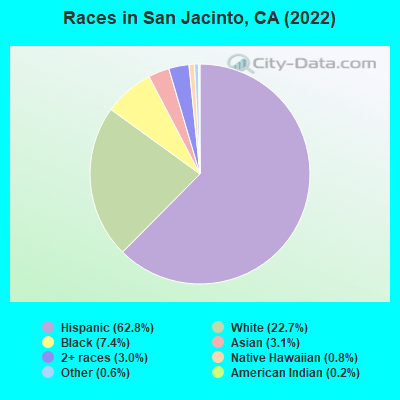
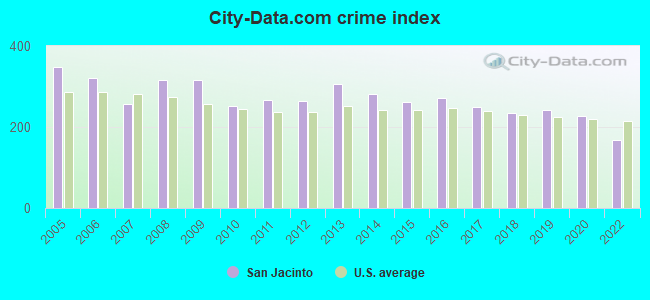
 Recent articles from our blog. Our writers, many of them Ph.D. graduates or candidates, create easy-to-read articles on a wide variety of topics.

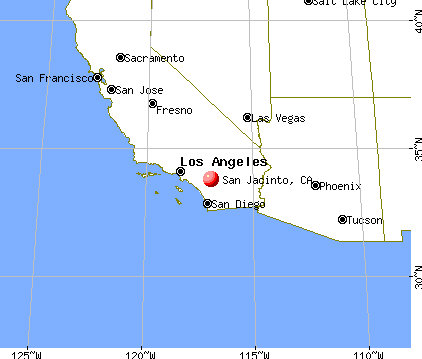
 (3.3 miles
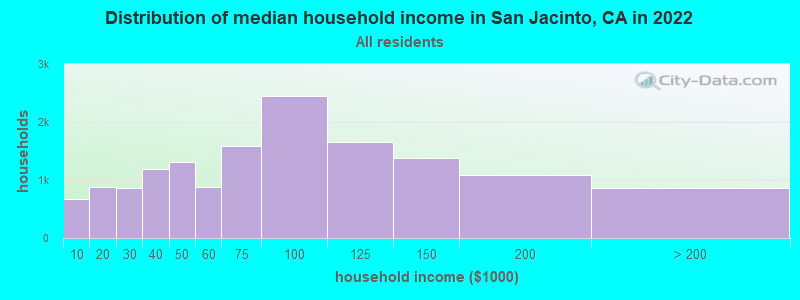
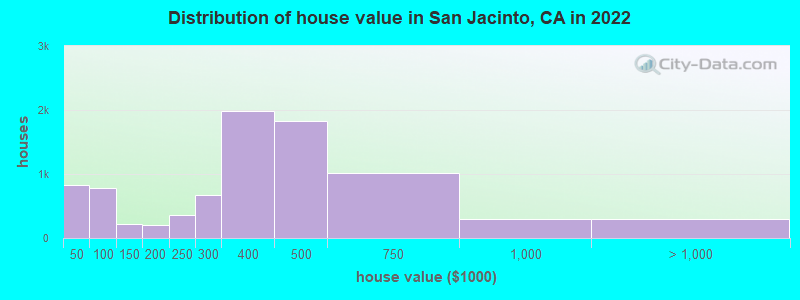
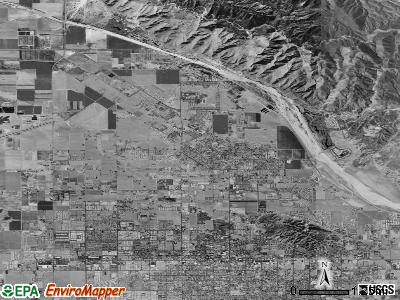
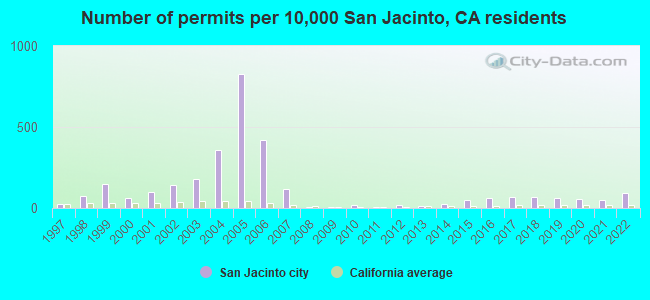
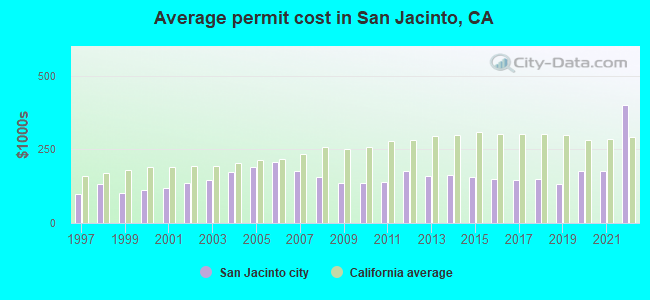
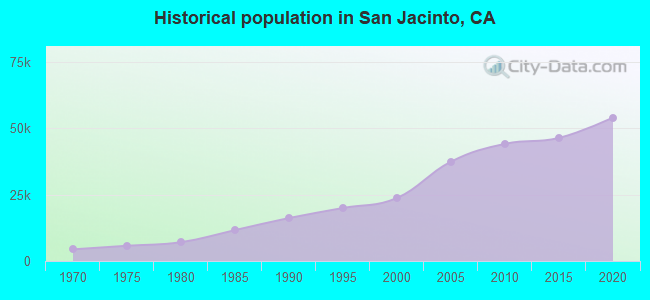
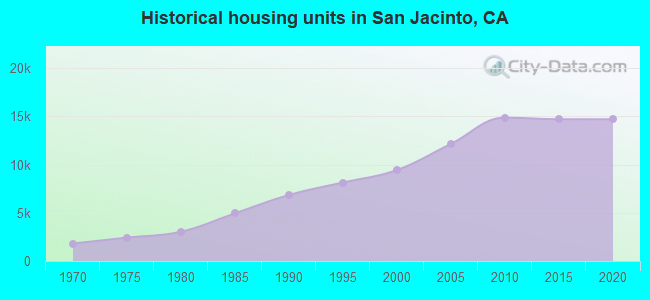
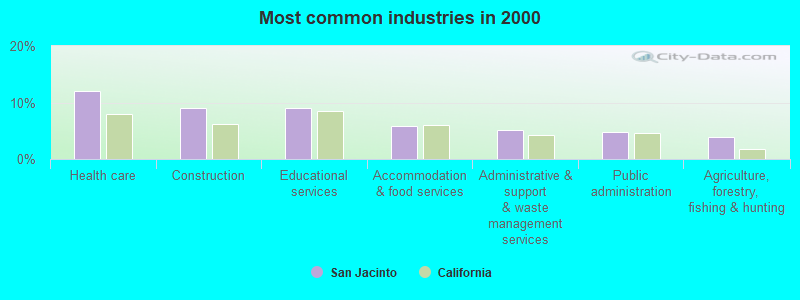
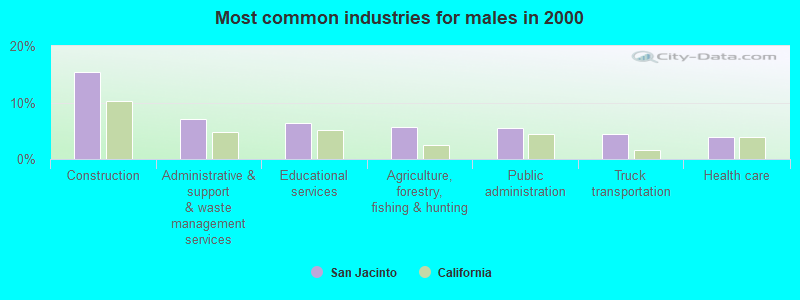
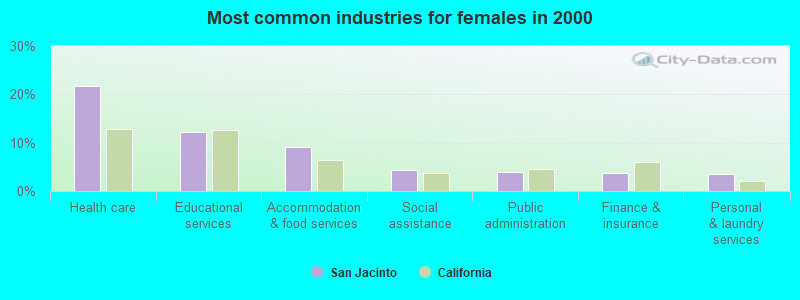
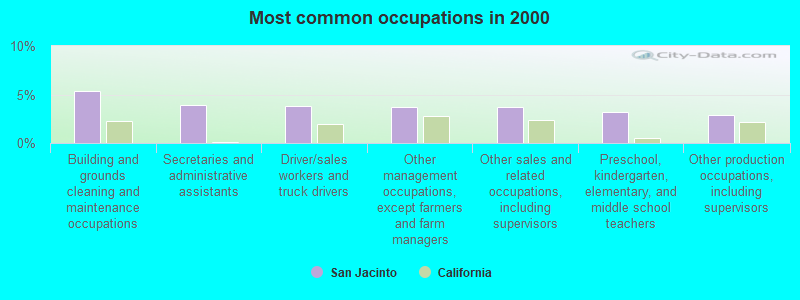
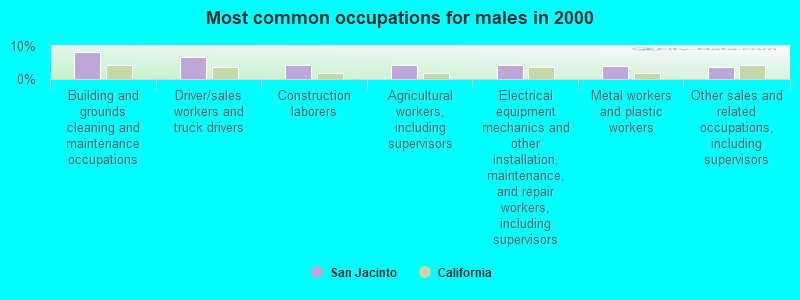
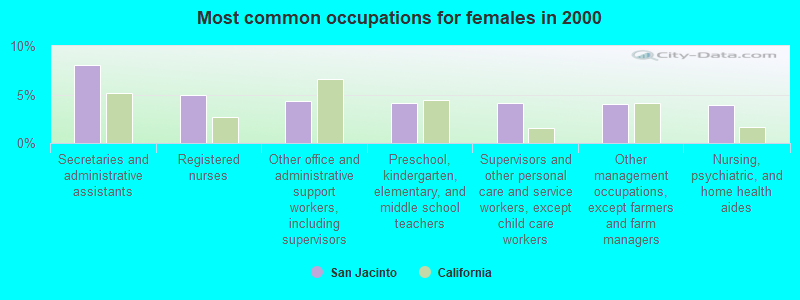
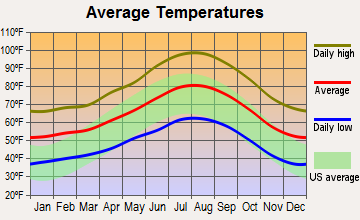
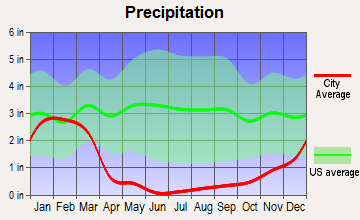
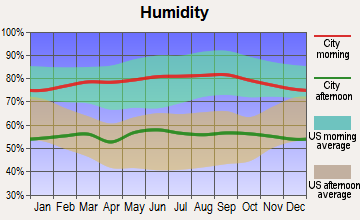
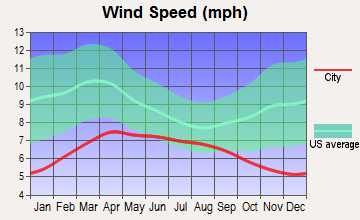
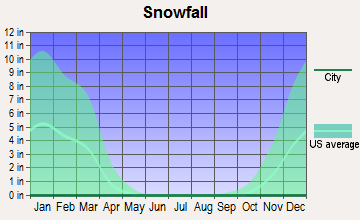
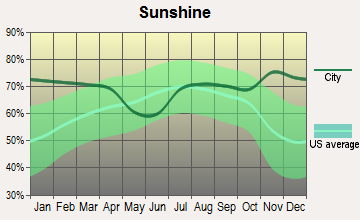
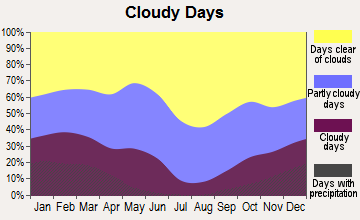
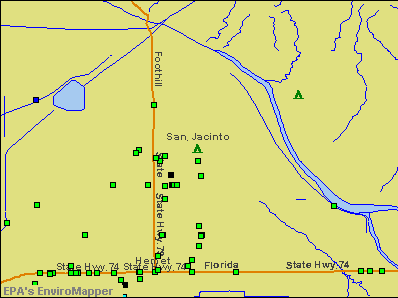

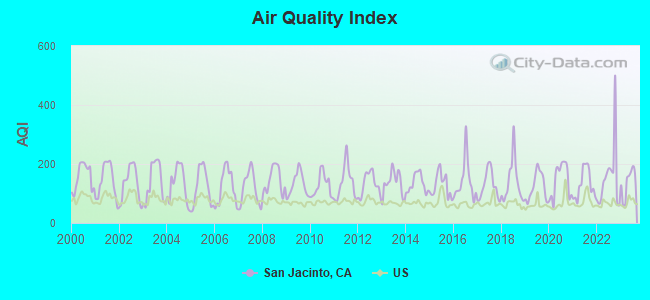
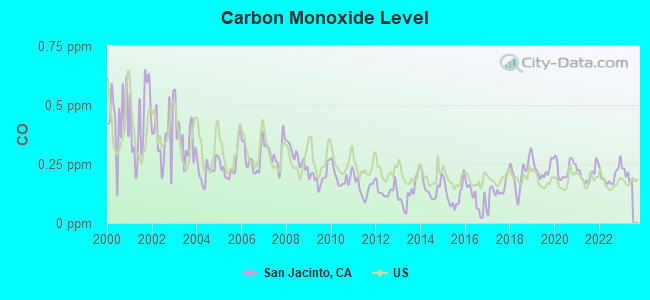
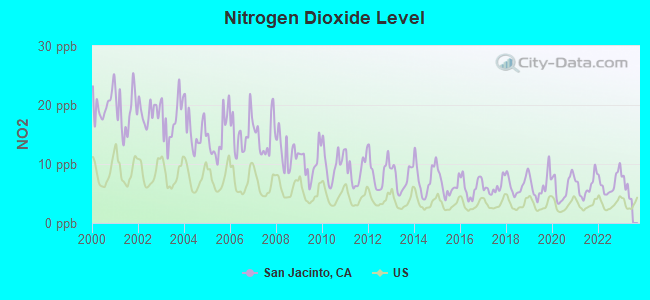
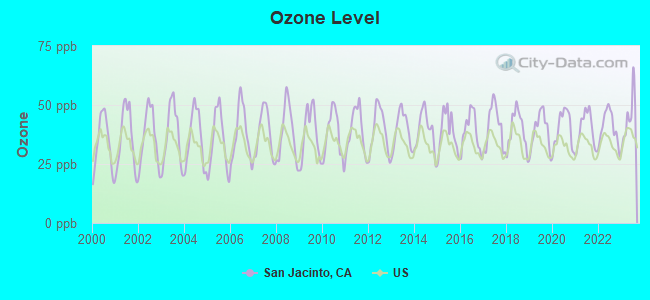
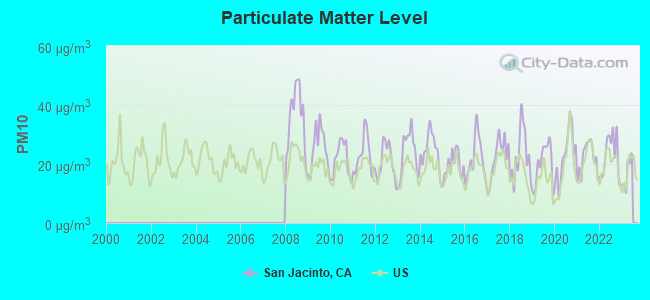
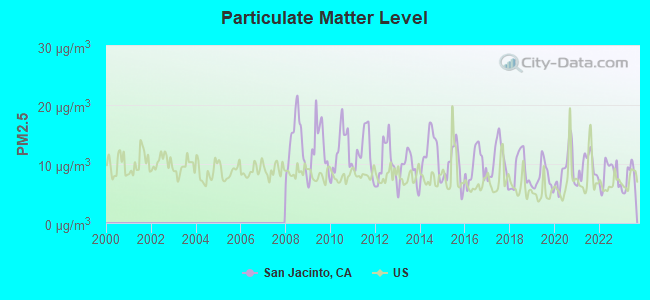
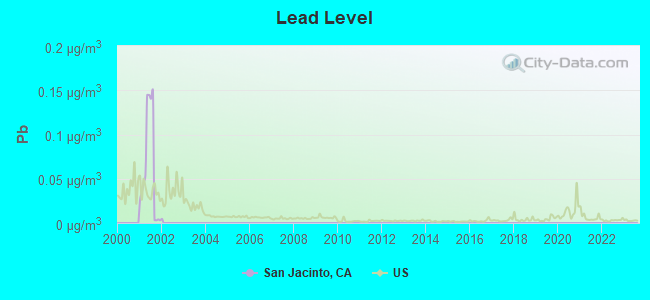

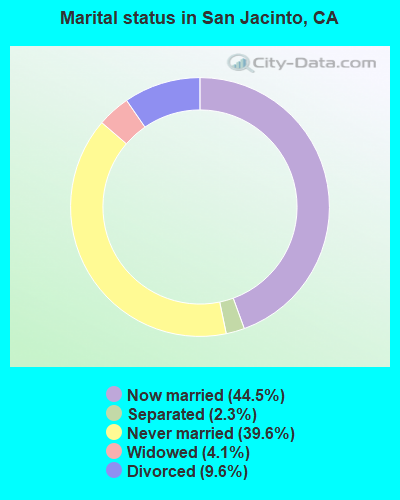
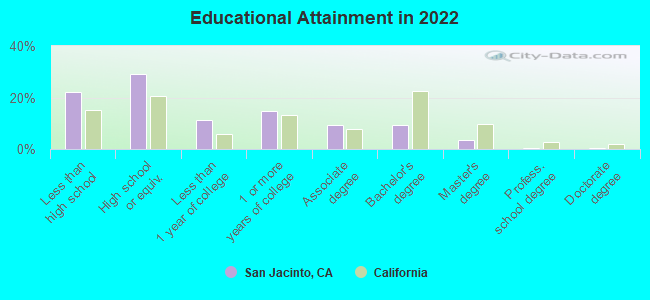
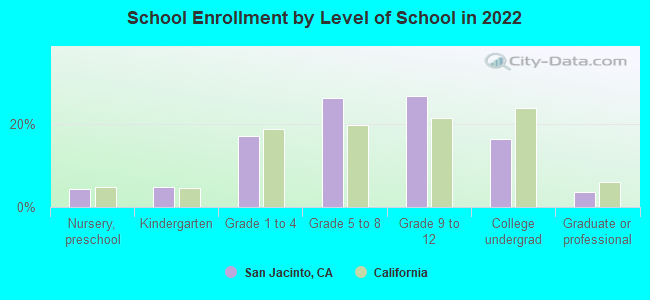
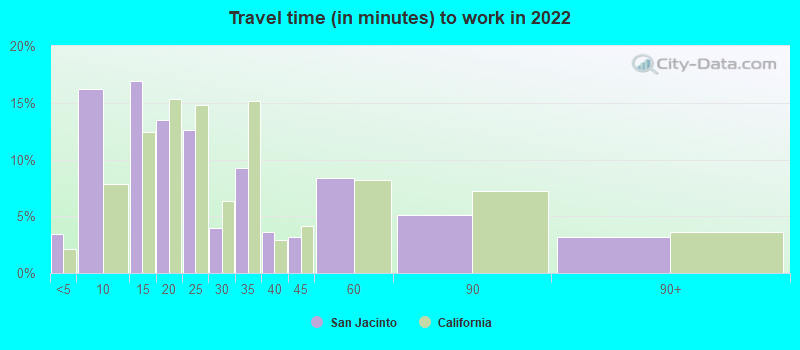
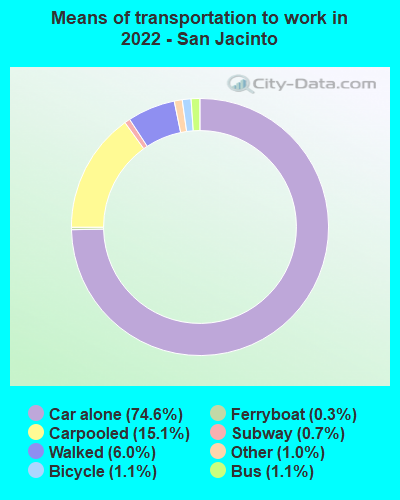


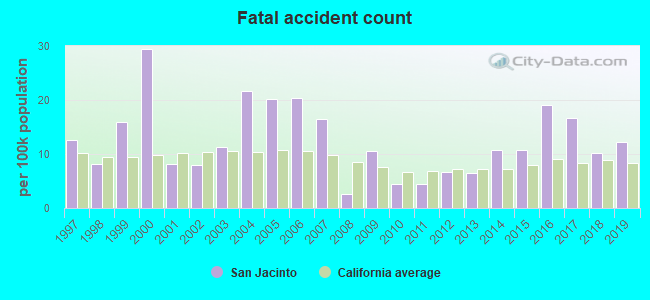
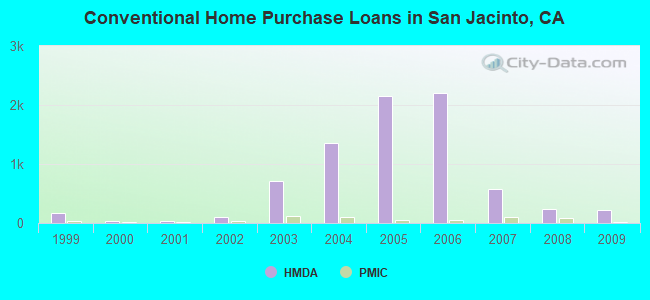
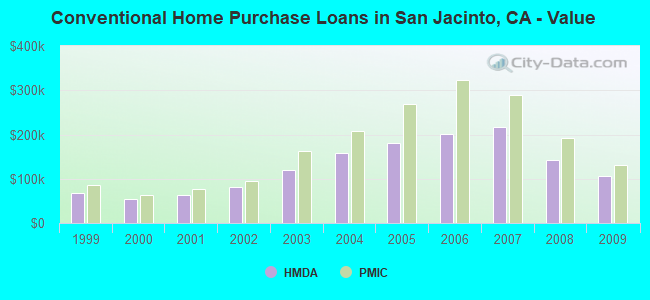
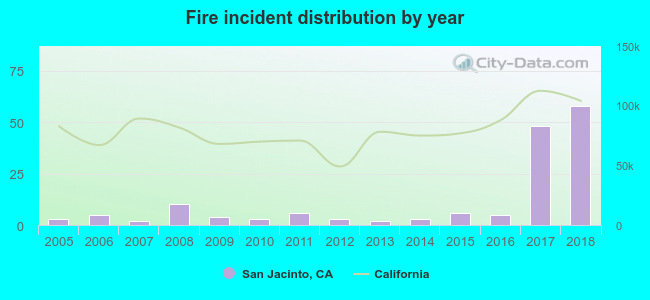 According to the data from the years 2005 - 2018 the average number of fire incidents per year is 11. The highest number of fires - 58 took place in 2018, and the least - 2 in 2007. The data has a rising trend.
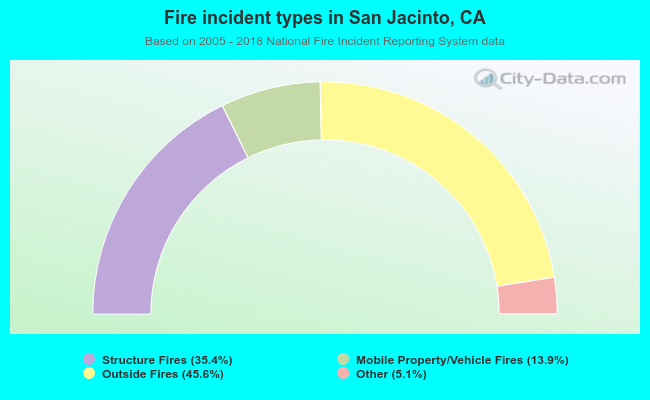 When looking into fire subcategories, the most reports belonged to: Outside Fires (45.6%), and Structure Fires (35.4%).