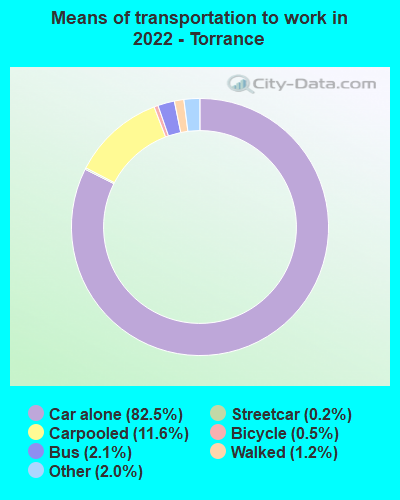
Torrance, California
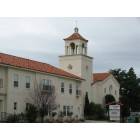
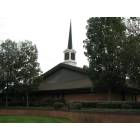
Torrance: Beautiful old First Baptist Church on Carson Street.
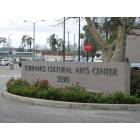
Torrance: Cultural Arts Center - Arts, Crafts, Music, Dance, Martial Arts, and more!
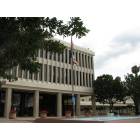
Torrance: Torrance City Hall
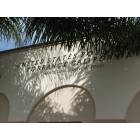
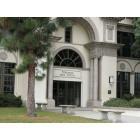
Torrance: Historic Site - Old Post Office on Marcelina Ave., Old Torrance.
Torrance: L.D.S. Church on Artesia Blvd.
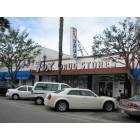
Torrance: Not a historic site, but should be. Fox Drugs has been here forever, unchanged.
Torrance: Torrance High School, the site of Beverly Hills 90210 T.V. show.
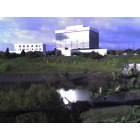
Torrance: Across from Target on Plaza Del Amo Blvd is this huge reservoir or well or big dig. I don't know what is really. Tell me!
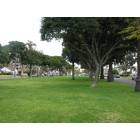
Torrance: Grassy, wide center median strip on Arlington Ave., Old Torrance
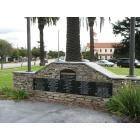
Torrance: Ted Tanoye Memorial at Torrance High School - Medal of Valor Recipient
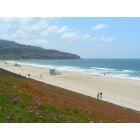
Torrance: Torrance Beach
- see
20
more - add
your
Submit your own pictures of this city and show them to the world
- OSM Map
- General Map
- Google Map
- MSN Map
Population change since 2000: +2.3%
 |
| Males: 69,094 | |
| Females: 72,032 |
| Median resident age: | 44.3 years |
| California median age: | 37.9 years |
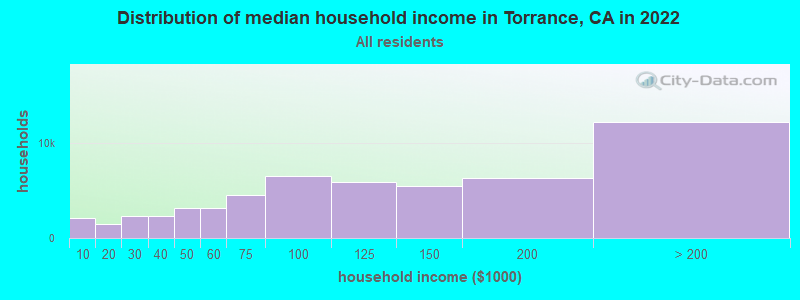
| Torrance: | $108,406 |
| CA: | $91,551 |
Estimated per capita income in 2022: $53,753 (it was $28,144 in 2000)
Torrance city income, earnings, and wages data
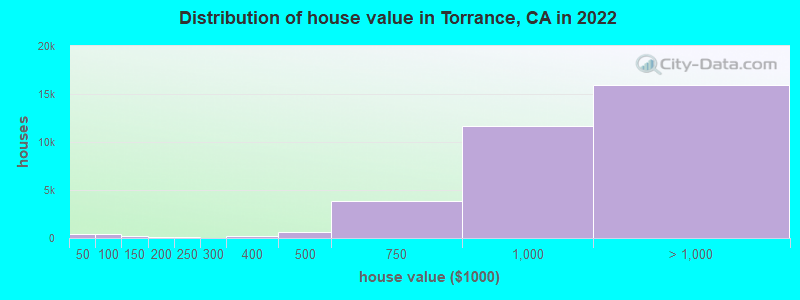
Estimated median house or condo value in 2022: over $1,000,000 (it was $308,600 in 2000)
| Torrance: | over $1,000,000 |
| CA: | $715,900 |
Mean prices in 2022: all housing units: over $1,000,000; detached houses: over $1,000,000; townhouses or other attached units: $795,087; in 2-unit structures: $794,853; in 3-to-4-unit structures: $588,289; in 5-or-more-unit structures: $587,126; mobile homes: $260,217; occupied boats, rvs, vans, etc.: over $1,000,000
Median gross rent in 2022: $2,086.
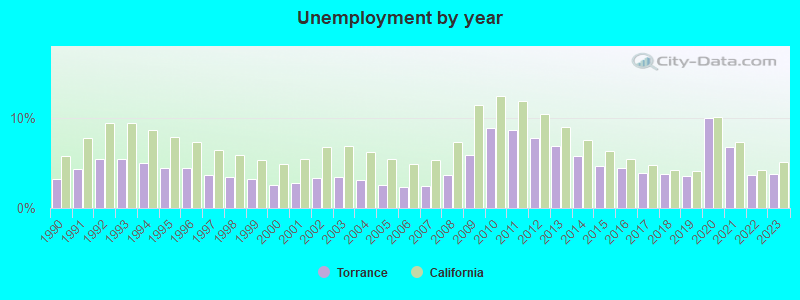
(5.6% for White Non-Hispanic residents, 11.4% for Black residents, 7.4% for Hispanic or Latino residents, 1.1% for American Indian residents, 2.6% for Native Hawaiian and other Pacific Islander residents, 8.5% for other race residents, 8.2% for two or more races residents)
Detailed information about poverty and poor residents in Torrance, CA


Compare current foreclosures in Torrance, CA:
| Photo | Address | Area | Beds / Baths | Price | Details |
|---|---|---|---|---|---|

|
#1
W 233rd St
Torrance, CA 90501
|
1,350 sq. feet
|
2 baths 2 beds |
$15,199
|
show details |

|
#2
Entradero Ave
Torrance, CA 90503
|
2,128 sq. feet
|
2 baths 4 beds |
show details | |

|
#3
S Vermont Ave Unit 8
Torrance, CA 90502
|
1,064 sq. feet
|
2 baths 3 beds |
show details | |

|
#4
Eastwood Ave
Torrance, CA 90504
|
1,217 sq. feet
|
2 baths 2 beds |
show details | |

|
#5
Eastwood Ave
Torrance, CA 90504
|
1,217 sq. feet
|
2 baths 2 beds |
show details | |

|
#6
W 178th St
Torrance, CA 90504
|
1,231 sq. feet
|
2 baths 3 beds |
show details | |

|
#7
Michelle Dr
Torrance, CA 90503
|
1,526 sq. feet
|
2 baths 4 beds |
show details | |

|
#8
W 235th St
Torrance, CA 90501
|
1,131 sq. feet
|
1 baths 3 beds |
show details | |

|
#9
W 223rd St
Torrance, CA 90501
|
1,008 sq. feet
|
1 baths 2 beds |
show details | |

|
#10
Regina Ave
Torrance, CA 90504
|
1,783 sq. feet
|
3 baths 5 beds |
show details |
| Photo | Address | Area | Beds / Baths | Price | Details |
|---|---|---|---|---|---|

|
#11
Regina Ave
Torrance, CA 90504
|
1,783 sq. feet
|
3 baths 5 beds |
show details | |

|
#12
S Vermont Ave Unit 3
Torrance, CA 90502
|
1,549 sq. feet
|
3 baths 3 beds |
show details | |

|
#13
Calle Mayor
Torrance, CA 90505
|
1,383 sq. feet
|
2 baths 3 beds |
show details | |

|
#14
Plaza Del Amo Unit 219
Torrance, CA 90503
|
1,058 sq. feet
|
2 baths 2 beds |
show details | |

|
#15
Bulova St
Torrance, CA 90503
|
1,722 sq. feet
|
2 baths 4 beds |
show details | |

|
#16
S Vermont Ave Unit 3
Torrance, CA 90502
|
1,549 sq. feet
|
3 baths 3 beds |
show details | |

|
#17
Crenshaw Blvd
Torrance, CA 90501
|
1,778 sq. feet
|
2 baths 4 beds |
show details | |

|
#18
Denker Ave
Torrance, CA 90501
|
1,480 sq. feet
|
2 baths 4 beds |
show details | |

|
#19
Linda Dr
Torrance, CA 90505
|
1,074 sq. feet
|
1 baths 2 beds |
show details | |

|
#20
W 177th St
Torrance, CA 90504
|
1,298 sq. feet
|
2 baths 4 beds |
show details |
| Photo | Address | Area | Beds / Baths | Price | Details |
|---|---|---|---|---|---|

|
#21
W 228th St
Torrance, CA 90502
|
3,428 sq. feet
|
5 baths 7 beds |
show details | |

|
#22
Cota Ave
Torrance, CA 90501
|
1,835 sq. feet
|
2 baths 3 beds |
show details | |

|
#23
W 214th St
Torrance, CA 90502
|
1,386 sq. feet
|
2 baths 3 beds |
show details | |

|
#24
S Van Deene Ave
Torrance, CA 90502
|
1,586 sq. feet
|
2 baths 4 beds |
show details | |

|
#25
Sepulveda Blvd Apt 206
Torrance, CA 90505
|
1,212 sq. feet
|
3 baths 2 beds |
show details | |

|
#26
Del Amo Blvd
Torrance, CA 90501
|
1,537 sq. feet
|
2 baths 4 beds |
show details | |

|
#27
W 222nd St
Torrance, CA 90501
|
1,008 sq. feet
|
1 baths 3 beds |
show details | |

|
#28
Greenhedge St
Torrance, CA 90502
|
1,059 sq. feet
|
1 baths 3 beds |
show details | |

|
#29
Normallin St
Torrance, CA 90505
|
876 sq. feet
|
1 baths 2 beds |
show details | |

|
#30
Newton St
Torrance, CA 90505
|
1,681 sq. feet
|
4 baths 6 beds |
show details |
| Photo | Address | Area | Beds / Baths | Price | Details |
|---|---|---|---|---|---|

|
#31
Winlock Rd
Torrance, CA 90505
|
1,207 sq. feet
|
2 baths 3 beds |
show details | |

|
#32
Flower Ave
Torrance, CA 90503
|
2,347 sq. feet
|
3 baths 3 beds |
show details | |

|
#33
W 230th St
Torrance, CA 90505
|
1,281 sq. feet
|
2 baths 3 beds |
show details | |

|
#34
Romano Pl
Torrance, CA 90505
|
1,694 sq. feet
|
2 baths 3 beds |
show details | |

|
#35
Torrance Blvd
Torrance, CA 90503
|
3,322 sq. feet
|
4 baths 4 beds |
show details | |

|
#36
Van Ness Ave
Torrance, CA 90504
|
1,093 sq. feet
|
2 baths 3 beds |
show details | |

|
#37
S Vermont Ave # 9
Torrance, CA 90502
|
- sq. feet
|
- baths - beds |
show details | |

|
#38
Maricopa St # 9
Torrance, CA 90503
|
- sq. feet
|
- baths - beds |
show details | |

|
#39
W 224th St
Torrance, CA 90501
|
- sq. feet
|
- baths - beds |
show details | |

|
#40
Lincoln Ave # 5
Torrance, CA 90501
|
- sq. feet
|
- baths - beds |
show details |
| Photo | Address | Area | Beds / Baths | Price | Details |
|---|---|---|---|---|---|

|
#41
Arlington Ave
Torrance, CA 90501
|
- sq. feet
|
- baths - beds |
show details | |

|
#42
W 249th Street, # 21
Torrance, CA 90501
|
- sq. feet
|
- baths - beds |
show details | |

|
#43
Merrill Dr Apt 5
Torrance, CA 90503
|
- sq. feet
|
- baths - beds |
show details | |

|
#44
S Vermont Av 3
Torrance, CA 90502
|
- sq. feet
|
- baths - beds |
show details | |

|
#45
Neece Ave
Torrance, CA 90505
|
- sq. feet
|
- baths - beds |
show details | |

|
#46
S Western Ave Ste 208
Torrance, CA 90501
|
- sq. feet
|
- baths - beds |
show details | |

|
#47
W 226th St Apt 30
Torrance, CA 90505
|
- sq. feet
|
- baths - beds |
show details | |

|
#48
W 207th St
Torrance, CA 90501
|
- sq. feet
|
- baths - beds |
show details | |

|
#49
Pacific Coast Hwy Apt N101
Torrance, CA 90505
|
- sq. feet
|
- baths - beds |
show details | |

|
Check over 1 million property listings on Foreclosure.com!
|
browse all offers | |||


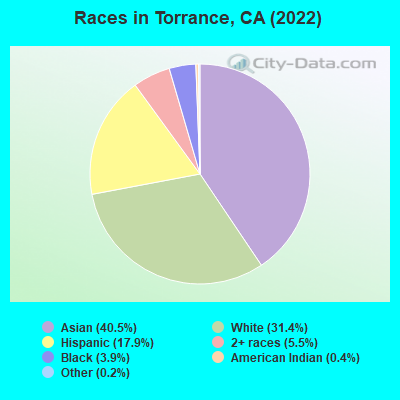
- 57,22340.5%Asian alone
- 44,34731.4%White alone
- 25,32217.9%Hispanic
- 7,7505.5%Two or more races
- 5,4443.9%Black alone
- 5530.4%American Indian alone
- 3510.2%Other race alone
- 1370.10%Native Hawaiian and Other
Pacific Islander alone
According to our research of California and other state lists, there were 114 registered sex offenders living in Torrance, California as of April 18, 2024.
The ratio of all residents to sex offenders in Torrance is 1,291 to 1.
The ratio of registered sex offenders to all residents in this city is lower than the state average.
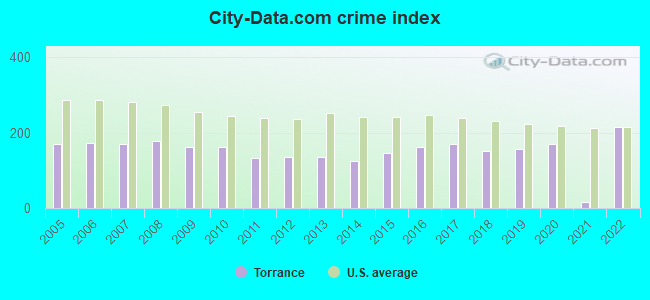
The City-Data.com crime index weighs serious crimes and violent crimes more heavily. Higher means more crime, U.S. average is 246.1. It adjusts for the number of visitors and daily workers commuting into cities.
- means the value is smaller than the state average.- means the value is about the same as the state average.
- means the value is bigger than the state average.
- means the value is much bigger than the state average.
Crime rate in Torrance detailed stats: murders, rapes, robberies, assaults, burglaries, thefts, arson
Full-time law enforcement employees in 2021, including police officers: 345 (208 officers - 196 male; 12 female).
| Officers per 1,000 residents here: | 1.47 |
| California average: | 2.30 |
 Recent articles from our blog. Our writers, many of them Ph.D. graduates or candidates, create easy-to-read articles on a wide variety of topics.


Latest news from Torrance, CA collected exclusively by city-data.com from local newspapers, TV, and radio stations
Ancestries: American (3.2%), Irish (2.8%), English (2.7%), German (2.2%), Italian (2.0%), European (1.3%).
Current Local Time: PST time zone
Elevation: 84 feet
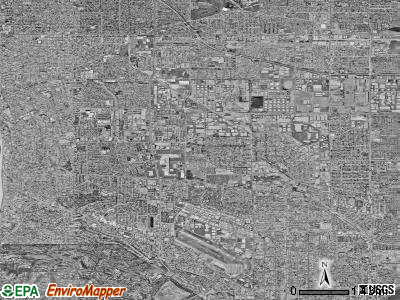
Land area: 20.5 square miles.
Population density: 6,870 people per square mile (high).
43,027 residents are foreign born (22.0% Asia, 5.4% Latin America).
| This city: | 30.2% |
| California: | 26.5% |
Median real estate property taxes paid for housing units with mortgages in 2022: $7,215 (0.7%)
Median real estate property taxes paid for housing units with no mortgage in 2022: $3,985 (0.4%)
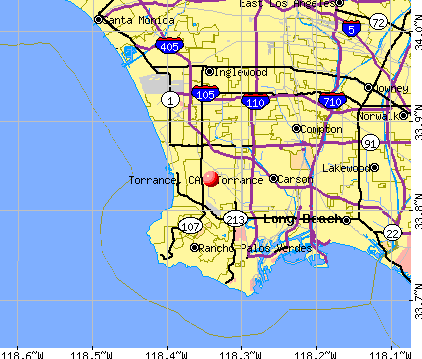
Nearest city with pop. 200,000+: Long Beach, CA  (10.7 miles , pop. 461,522).
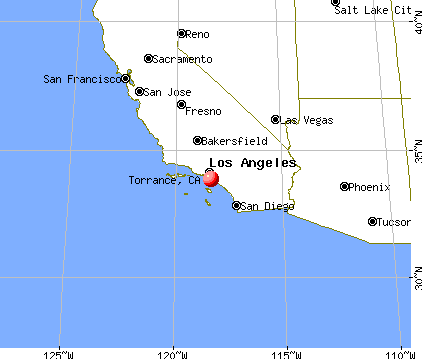
Nearest city with pop. 1,000,000+: Los Angeles, CA (17.5 miles , pop. 3,694,820).
Nearest cities:
Latitude: 33.83 N, Longitude: 118.34 W
Daytime population change due to commuting: +29,106 (+20.6%)
Workers who live and work in this city: 26,188 (37.3%)
Area code: 310
Property values in Torrance, CA
Torrance tourist attractions:
Torrance, California accommodation & food services, waste management - Economy and Business Data
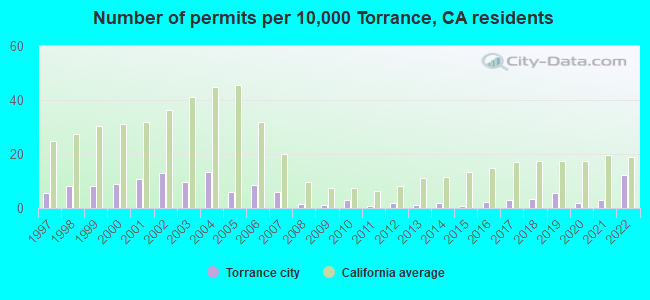
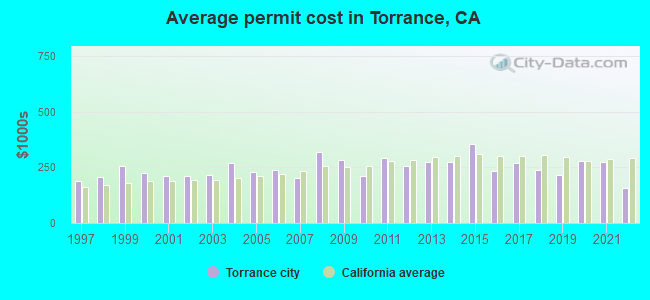
Single-family new house construction building permits:
- 2022: 170 buildings, average cost: $157,600
- 2021: 40 buildings, average cost: $275,300
- 2020: 27 buildings, average cost: $277,700
- 2019: 78 buildings, average cost: $213,600
- 2018: 44 buildings, average cost: $238,500
- 2017: 40 buildings, average cost: $267,200
- 2016: 32 buildings, average cost: $233,700
- 2015: 12 buildings, average cost: $353,500
- 2014: 27 buildings, average cost: $273,200
- 2013: 13 buildings, average cost: $272,600
- 2012: 24 buildings, average cost: $255,700
- 2011: 8 buildings, average cost: $291,100
- 2010: 41 buildings, average cost: $210,900
- 2009: 15 buildings, average cost: $283,900
- 2008: 22 buildings, average cost: $319,400
- 2007: 81 buildings, average cost: $203,300
- 2006: 115 buildings, average cost: $237,100
- 2005: 84 buildings, average cost: $230,700
- 2004: 185 buildings, average cost: $267,400
- 2003: 134 buildings, average cost: $216,900
- 2002: 181 buildings, average cost: $213,000
- 2001: 150 buildings, average cost: $211,700
- 2000: 124 buildings, average cost: $225,800
- 1999: 110 buildings, average cost: $255,300
- 1998: 112 buildings, average cost: $205,600
- 1997: 76 buildings, average cost: $189,500
| Here: | 3.8% |
| California: | 5.1% |
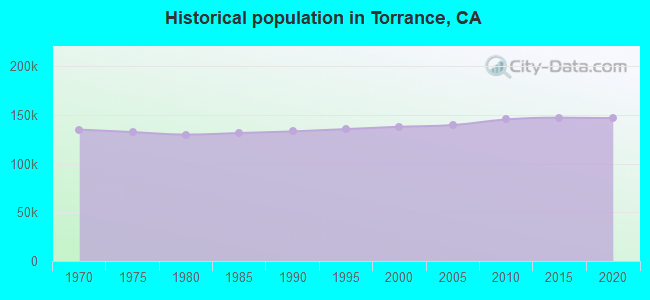
Population change in the 1990s: +4,516 (+3.4%).
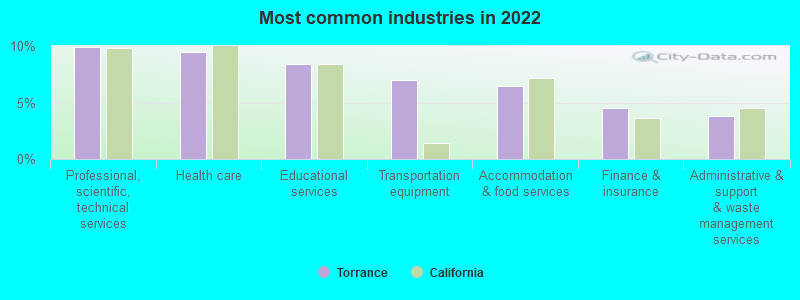
- Professional, scientific, technical services (9.9%)
- Health care (9.5%)
- Educational services (8.4%)
- Transportation equipment (7.0%)
- Accommodation & food services (6.4%)
- Finance & insurance (4.5%)
- Administrative & support & waste management services (3.8%)
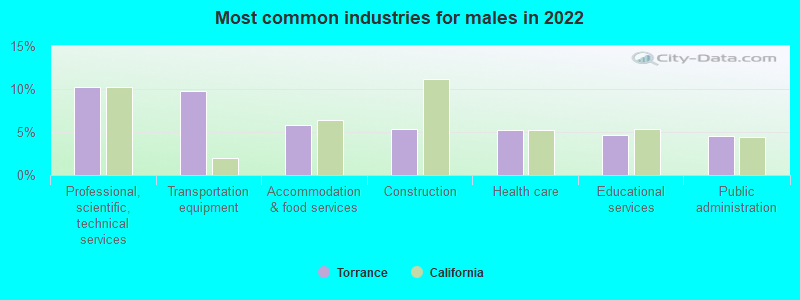
- Professional, scientific, technical services (10.2%)
- Transportation equipment (9.7%)
- Accommodation & food services (5.8%)
- Construction (5.3%)
- Health care (5.3%)
- Educational services (4.7%)
- Public administration (4.5%)
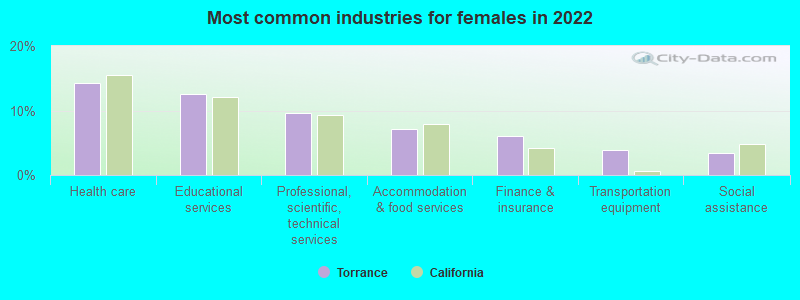
- Health care (14.3%)
- Educational services (12.6%)
- Professional, scientific, technical services (9.5%)
- Accommodation & food services (7.2%)
- Finance & insurance (6.0%)
- Transportation equipment (3.9%)
- Social assistance (3.5%)
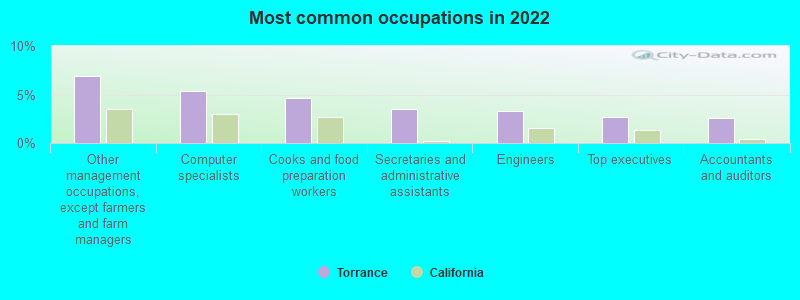
- Other management occupations, except farmers and farm managers (6.9%)
- Computer specialists (5.4%)
- Cooks and food preparation workers (4.6%)
- Secretaries and administrative assistants (3.5%)
- Engineers (3.3%)
- Top executives (2.7%)
- Accountants and auditors (2.6%)
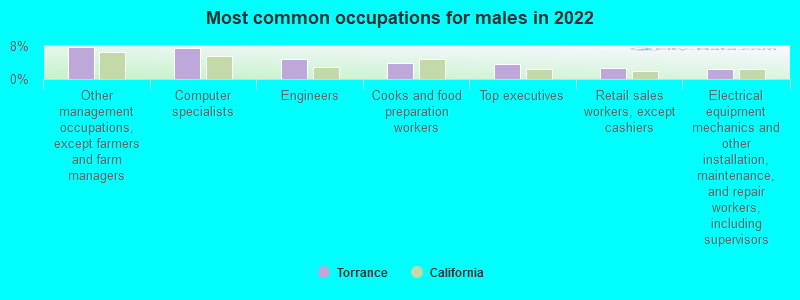
- Other management occupations, except farmers and farm managers (7.9%)
- Computer specialists (7.5%)
- Engineers (4.9%)
- Cooks and food preparation workers (4.0%)
- Top executives (3.6%)
- Retail sales workers, except cashiers (2.7%)
- Electrical equipment mechanics and other installation, maintenance, and repair workers, including supervisors (2.4%)
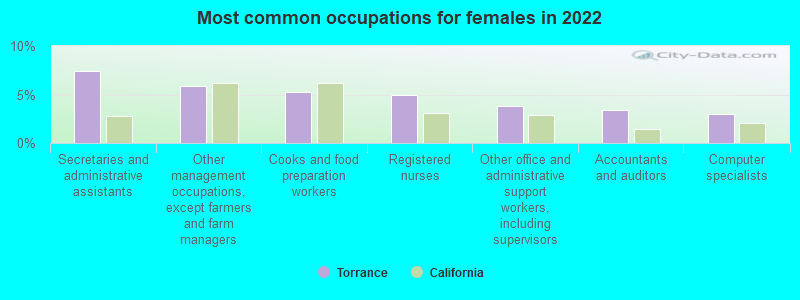
- Secretaries and administrative assistants (7.4%)
- Other management occupations, except farmers and farm managers (5.8%)
- Cooks and food preparation workers (5.3%)
- Registered nurses (5.0%)
- Other office and administrative support workers, including supervisors (3.8%)
- Accountants and auditors (3.4%)
- Computer specialists (3.0%)
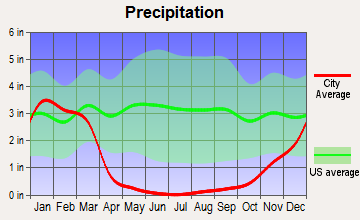
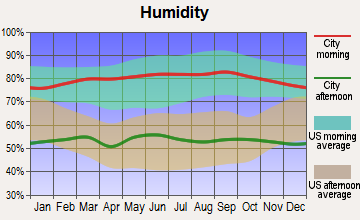
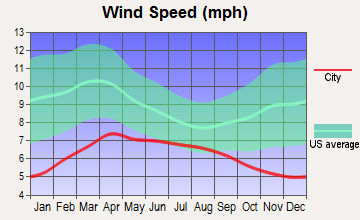
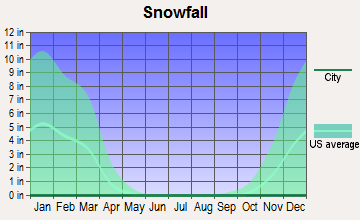
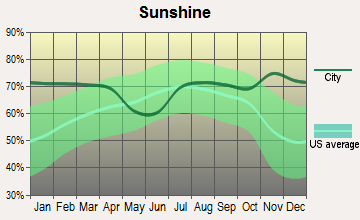
Average climate in Torrance, California
Based on data reported by over 4,000 weather stations


|
|

(lower is better)
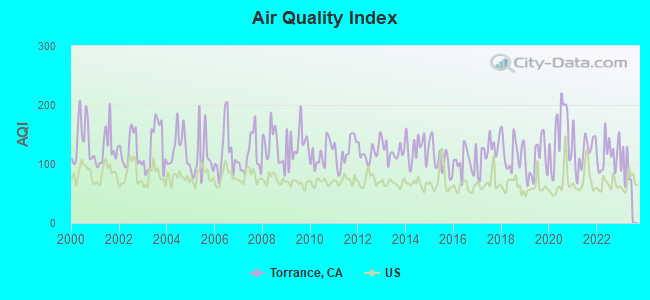
Air Quality Index (AQI) level in 2022 was 116. This is significantly worse than average.
| City: | 116 |
| U.S.: | 73 |
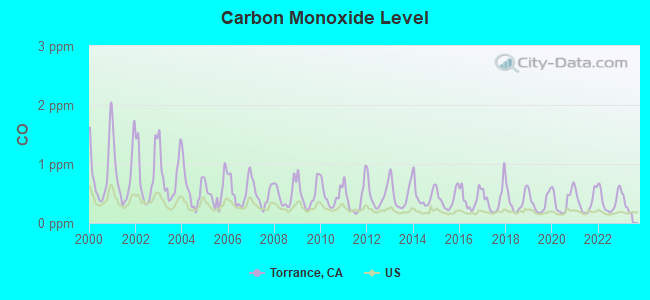
Carbon Monoxide (CO) [ppm] level in 2022 was 0.378. This is significantly worse than average. Closest monitor was 6.3 miles away from the city center.
| City: | 0.378 |
| U.S.: | 0.251 |
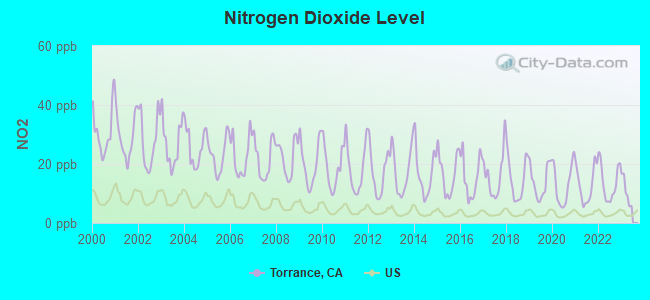
Nitrogen Dioxide (NO2) [ppb] level in 2022 was 13.7. This is significantly worse than average. Closest monitor was 0.9 miles away from the city center.
| City: | 13.7 |
| U.S.: | 5.1 |
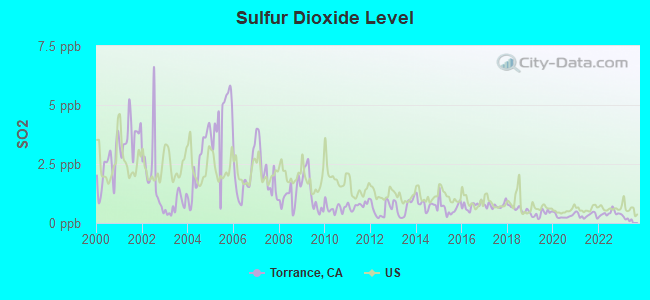
Sulfur Dioxide (SO2) [ppb] level in 2022 was 0.413. This is significantly better than average. Closest monitor was 0.9 miles away from the city center.
| City: | 0.413 |
| U.S.: | 1.515 |
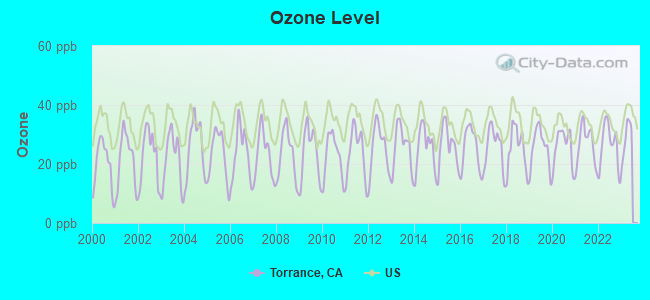
Ozone [ppb] level in 2022 was 26.3. This is better than average. Closest monitor was 6.3 miles away from the city center.
| City: | 26.3 |
| U.S.: | 33.3 |
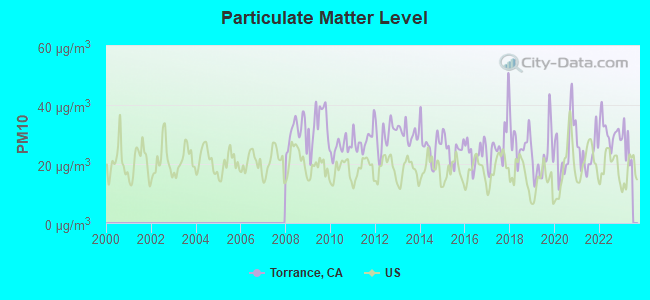
Particulate Matter (PM10) [µg/m3] level in 2022 was 31.1. This is significantly worse than average. Closest monitor was 6.3 miles away from the city center.
| City: | 31.1 |
| U.S.: | 19.2 |
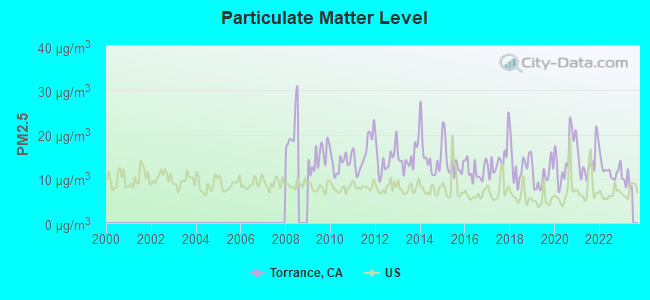
Particulate Matter (PM2.5) [µg/m3] level in 2022 was 12.0. This is significantly worse than average. Closest monitor was 8.3 miles away from the city center.
| City: | 12.0 |
| U.S.: | 8.1 |
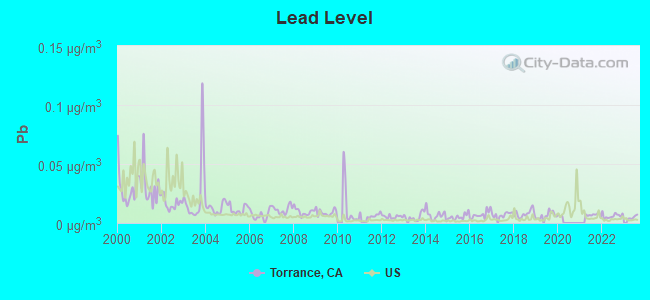
Lead (Pb) [µg/m3] level in 2022 was 0.00604. This is significantly better than average. Closest monitor was 0.9 miles away from the city center.
| City: | 0.00604 |
| U.S.: | 0.00931 |
Earthquake activity:
Torrance-area historical earthquake activity is significantly above California state average. It is 6716% greater than the overall U.S. average.On 7/21/1952 at 11:52:14, a magnitude 7.7 (7.7 UK, Class: Major, Intensity: VIII - XII) earthquake occurred 88.9 miles away from Torrance center, causing $50,000,000 total damage
On 6/28/1992 at 11:57:34, a magnitude 7.6 (6.2 MB, 7.6 MS, 7.3 MW, Depth: 0.7 mi) earthquake occurred 106.5 miles away from Torrance center, causing 3 deaths (1 shaking deaths, 2 other deaths) and 400 injuries, causing $100,000,000 total damage and $40,000,000 insured losses
On 10/16/1999 at 09:46:44, a magnitude 7.4 (6.3 MB, 7.4 MS, 7.2 MW, 7.3 ML) earthquake occurred 118.8 miles away from Torrance center
On 11/4/1927 at 13:51:53, a magnitude 7.5 (7.5 UK) earthquake occurred 170.8 miles away from the city center
On 1/17/1994 at 12:30:55, a magnitude 6.8 (6.4 MB, 6.8 MS, 6.7 MW, Depth: 11.4 mi, Class: Strong, Intensity: VII - IX) earthquake occurred 25.9 miles away from Torrance center, causing 60 deaths (60 shaking deaths) and 7000 injuries
On 4/21/1918 at 22:32:30, a magnitude 6.8 (6.8 UK) earthquake occurred 51.8 miles away from the city center
Magnitude types: body-wave magnitude (MB), local magnitude (ML), surface-wave magnitude (MS), moment magnitude (MW)
Natural disasters:
The number of natural disasters in Los Angeles County (57) is a lot greater than the US average (15).Major Disasters (Presidential) Declared: 27
Emergencies Declared: 3
Causes of natural disasters: Fires: 37, Floods: 16, Storms: 9, Winter Storms: 6, Landslides: 5, Mudslides: 5, Earthquakes: 3, Freeze: 1, Heavy Rain: 1, Hurricane: 1, Snow: 1, Tornado: 1, Wind: 1, Other: 1 (Note: some incidents may be assigned to more than one category).
Main business address for: FARMER BROTHERS CO (MISCELLANEOUS FOOD PREPARATIONS & KINDRED PRODUCTS), SUMMA INDUSTRIES/ (PLASTICS PRODUCTS, NEC), PC MALL INC (RETAIL-CATALOG & MAIL-ORDER HOUSES), VIRCO MFG CORPORATION (PUBLIC BUILDING AND RELATED FURNITURE), TOYOTA MOTOR CREDIT CORP (PERSONAL CREDIT INSTITUTIONS), EDELBROCK CORP (MOTOR VEHICLE PARTS & ACCESSORIES), ENOVA SYSTEMS INC (ELECTRONIC COMPONENTS & ACCESSORIES), MOTORCAR PARTS AMERICA INC (MISCELLANEOUS ELECTRICAL MACHINERY, EQUIPMENT & SUPPLIES) and 2 other public companies.
Hospitals in Torrance:
- DEL AMO HOSPITAL (3270 W LOMITA BLVD)
- HARBOR UCLA MEDICAL FOUNDATION INC (21840 S NORMANDIE)
- LAC/HARBOR-UCLA MED CENTER (Government - Local, provides emergency services, 1000 W CARSON ST)
- MILESTONE HOSPICE, INC (1500 CRENSHAW BLVD SUITE 200)
- PECK HOUSE (2630 DALEMEAD STREET)
- PEREGRINE HOSPICE, INC (3440 W CARSON STREET SUITE 301)
- PROVIDENCE LITTLE COMPANY OF MARY MED CTR TORRANCE (Voluntary non-profit - Church, provides emergency services, 4101 TORRANCE BLVD)
- SUNCREST HOSPITAL OF SOUTH BAY (4025 W 226TH ST)
- TORRANCE MEMORIAL MEDICAL CENTER (Voluntary non-profit - Other, 3330 LOMITA BLVD)
- TRINITYCARE HOSPICE (2601 AIRPORT DR, SUITE 230)
- UNITED LIFE HOSPICE INC (20705 SOUTH WESTERN AVENUE SUITE 112)
Airports and heliports located in Torrance:
- Zamperini Field Airport (TOA) (Runways: 3, Air Taxi Ops: 245, Itinerant Ops: 94,903, Local Ops: 76,405, Military Ops: 1,474)
- Toyota Helistop Heliport (3CL8)
Amtrak stations near Torrance:
- 8 miles: SAN PEDRO (CATALINA TERMINAL, BERTH 95) - Bus Station . Services: partially wheelchair accessible, enclosed waiting area, public restrooms, public payphones, snack bar, paid short-term parking, paid long-term parking, call for taxi service.
- 10 miles: LONG BEACH (601 N. LONG BEACH BLVD.) - Bus Station . Services: fully wheelchair accessible, public restrooms, public payphones, full-service food facilities, paid short-term parking, paid long-term parking, call for taxi service, public transit connection.
- 17 miles: LOS ANGELES (800 N. ALAMEDA ST.) . Services: ticket office, fully wheelchair accessible, enclosed waiting area, public restrooms, public payphones, snack bar, free short-term parking, paid long-term parking, car rental agency, taxi stand, public transit connection.
Colleges/Universities in Torrance:
- El Camino Community College District (Full-time enrollment: 13,952; Location: 16007 Crenshaw Blvd; Public; Website: www.elcamino.edu)
- Westwood College-South Bay (Full-time enrollment: 906; Location: 19700 S. Vermont Avenue, Suite 100; Private, for-profit; Website: www.westwood.edu)
- ITT Technical Institute-Torrance (Full-time enrollment: 522; Location: 20050 S. Vermont Ave; Private, for-profit; Website: www.itt-tech.edu)
- Everest College-Torrance (Full-time enrollment: 302; Location: 1231 Cabrillo Ave, Suite 201; Private, for-profit; Website: www.everest.edu/campus/torrance)
- Homestead Schools (Full-time enrollment: 210; Location: 23800 Hawthorne Blvd.; Private, not-for-profit; Website: www.homesteadschools.com)
Other colleges/universities with over 2000 students near Torrance:
- Los Angeles Harbor College (about 5 miles; Wilmington, CA; Full-time enrollment: 5,285)
- California State University-Dominguez Hills (about 6 miles; Carson, CA; FT enrollment: 9,862)
- Los Angeles Southwest College (about 7 miles; Los Angeles, CA; FT enrollment: 3,247)
- Wyotech-Long Beach (about 8 miles; Long Beach, CA; FT enrollment: 2,453)
- El Camino College-Compton Center (about 9 miles; Compton, CA; FT enrollment: 4,506)
- Loyola Marymount University (about 11 miles; Los Angeles, CA; FT enrollment: 7,720)
- Long Beach City College (about 12 miles; Long Beach, CA; FT enrollment: 15,602)
Public high schools in Torrance:
- TORRANCE HIGH (Students: 1,554, Location: 2200 CARSON ST., Grades: 9-12)
- SHERY (KURT T.) HIGH (CONTINUATION) (Students: 46, Location: 2600 VINE ST., Grades: 9-12)
- GENE DREVNO COMMUNITY DAY (Students: 11, Location: 2291 W. WASHINGTON AVE., Grades: 7-12)
- SOUTHERN CALIFORNIA ROC (Location: 2300 CRENSHAW BLVD., Grades: 10-12)
- NORTH HIGH (Location: 3620 W. 182ND ST., Grades: 9-12)
- SOUTH HIGH (Location: 4801 PACIFIC COAST HWY., Grades: 9-12)
- WEST HIGH (Location: 20401 VICTOR ST., Grades: 9-12)
Private high schools in Torrance:
- BISHOP MONTGOMERY HIGH SCHOOL (Students: 1,035, Location: 5430 TORRANCE BLVD, Grades: 9-12)
- SOUTH BAY JUNIOR ACADEMY (Students: 203, Location: 4400 DEL AMO BLVD, Grades: KG-10)
- SWITZER LEARNING CENTER (Students: 82, Location: 2201 AMAPOLA CT, Grades: 5-12)
- PACIFIC LUTHERAN HIGH SCHOOL (Students: 70, Location: 2150 SEPULVEDA BLVD, Grades: 9-12)
- SOUTH BAY HIGH SCHOOL (Students: 52, Location: 4025 W 226TH ST, Grades: 7-12)
- CENTER FOR LEARNING UNLIMITED (Students: 24, Location: 2785 PACIFIC COAST HWY STE G, Grades: 1-12)
- FREEMAN ENRICHMENT CENTER (Students: 12, Location: 19401 SOUTH VERMONT AVENUE #E100, Grades: 9-11)
- LOS ANGELES INTERNATIONAL SCHOOL (Students: 3, Location: 23800 HAWTHORNE BLVD, Grades: 12)
Biggest public elementary/middle schools in Torrance:
- CALLE MAYOR MIDDLE (Students: 781, Location: 4800 CALLE MAYOR, Grades: 6-8)
- BERT M. LYNN MIDDLE (Students: 751, Location: 5038 HALISON ST., Grades: 6-8)
- PHILIP MAGRUDER MIDDLE (Students: 744, Location: 4100 W. 185TH ST., Grades: 6-8)
- MADRONA MIDDLE (Students: 717, Location: 21364 MADRONA AVE., Grades: 6-8)
- EDWARD J. RICHARDSON MIDDLE (Students: 686, Location: 23751 NANCY LEE LN., Grades: 6-8)
- CASIMIR MIDDLE (Students: 681, Location: 17220 CASIMIR AVE., Grades: 6-8)
- VICTOR ELEMENTARY (Students: 658, Location: 4820 SPENCER ST., Grades: KG-5)
- JEFFERSON MIDDLE (Students: 594, Location: 21717 TALISMAN ST., Grades: 6-8)
- MEYLER STREET ELEMENTARY (Students: 585, Location: 1123 W. 223RD ST., Grades: KG-5)
- J. H. HULL MIDDLE (Students: 568, Location: 2080 W. 231ST ST., Grades: 6-8)
Private elementary/middle schools in Torrance:
- ST CATHERINE LABOURE SCHOOL (Students: 429, Location: 3846 REDONDO BEACH BLVD, Grades: PK-8)
- FIRST LUTHERAN SCHOOL (Students: 380, Location: 2900 W CARSON ST, Grades: KG-8)
- ST JAMES ELEMENTARY SCHOOL (Students: 327, Location: 4625 GARNET ST, Grades: KG-8)
- NATIVITY SCHOOL (Students: 239, Location: 2371 W CARSON ST, Grades: KG-8)
- HICKORY TREE SCHOOL (Students: 211, Location: 21720 MADRONA AVE, Grades: PK-5)
- ASCENSION LUTHERAN SCHOOL (Students: 136, Location: 17910 PRAIRIE AVE, Grades: PK-8)
- ABC PLAYHOUSE (Students: 93, Location: 18213 PRAIRIE AVE, Grades: PK-1)
- THE CHLDREN'S PLACE (Students: 13, Location: 1625 CRENSHAW BLVD, Grades: 1-5)
- ZION LUTHERAN SCHOOL (Students: 12, Location: 1001 W 223RD ST, Grades: 2-8)
User-submitted facts and corrections:
- biggest private primary/middle schools: First Lutheran School at 390 students
- Radios: one of the most important and unusual FM radio stations in the Los Angeles area, which has the most powerful transmitter (118,000 watts effective radiated signal power) west of the Mississippi: non-commercial listener-supported Pacifica Foundation station KPFK, 90.7 FM.
- Zip codes 90506, 90507, 90508, 90509 and 90510 are also Torrance Zip codes
Points of interest:
Notable locations in Torrance: Del Amo Fashion Center (A), South Bay Industrial Park (B), Las Canchas Raquet Club (C), Del Amo Financial Center (D), Walteria Branch Torrance Public Library (E), Torrance Public Library (F), Torrance Cultural Arts Center (G), Torrance City Hall (H), Southeast Branch Torrance Public Library (I), North Torrance Branch Torrance Public Library (J), Isabel Henderson Branch Torrance Public Library (K), El Retiro Branch Torrance Public Library (L), Gerber Ambulance Service (M), Mobile Oil Refinery Fire Department (N), Torrance Fire Department Fire Station 6 (O), Torrance Fire Department Fire Station 4 (P), Torrance Fire Department Fire Station 5 (Q), Torrance Fire Department Fire Station 3 (R), Torrance Fire Department Fire Station 2 (S), Torrance Fire Department Fire Station 1 Headquarters (T). Display/hide their locations on the map
Shopping Centers: Rolling Hills Plaza Shopping Center (1), Village Del Amo Shopping Center (2), Torrance Promenade Shopping Center (3), Plaza Del Amo Shopping Center (4), Pacific Plaza Shopping Center (5), North Torrance Shopping Center (6), Eastgate Plaza Shopping Center (7), Crossroads Shopping Center (8), Crenshaw Shopping Center (9). Display/hide their locations on the map
Main business address in Torrance include: SUMMA INDUSTRIES/ (A), PC MALL INC (B), VIRCO MFG CORPORATION (C), TOYOTA MOTOR CREDIT CORP (D), EDELBROCK CORP (E), MOTORCAR PARTS AMERICA INC (F). Display/hide their locations on the map
Churches in Torrance include: First Baptist Church (A), First United Methodist Church (B), Nativity Catholic Church (C), Saint Andrews Episcopal Church (D), Walteria United Methodist Church (E), Riviera Methodist Church (F), South Bay Church of God (G), Saint Catherine Laboure Catholic Church (H), Christian United Methodist Church (I). Display/hide their locations on the map
Reservoir: Dominguez Reservoir (A). Display/hide its location on the map
Parks in Torrance include: Wilson Park (1), El Prado Park (2), Entradero Park (3), Guenser Park (4), McMaster Park (5), Sea-Aire Park (6), Victor Park (7), Walteria Park (8), El Nido Park (9). Display/hide their locations on the map
Beach: Torrance County Beach (A). Display/hide its location on the map
Tourist attractions: Church of Jesus Christ of Latter-Day Saints - Family History Centers-Genealogy Libra (Cultural Attractions- Events- & Facilities; 22605 Kent Avenue) (1), Calif Looseleaf Search & Seizure Handbook (Cultural Attractions- Events- & Facilities; 21515 Hawthorne Boulevard) (2), Amf El Dorado Lanes (Amusement & Theme Parks; 8731 Lincoln Boulevard) (3). Display/hide their approximate locations on the map
Hotels: Andres Restaurant (21333 Hawthorne Boulevard) (1), A Ramada Limited (3673 Torrance Blvd.) (2), Staybridge Suites (19901 Prairie Ave) (3). Display/hide their approximate locations on the map
Birthplace of: Brian Welch - Musician, Thes One - Rapper, Steve Sarkisian - College football player, Antonio Margarito - Mexican boxer, Michelle Kwan - (born 1980), figure skater, Joe Stevenson - Martial artist, Tony Gonzalez (American football) - College football player, Ted T. Tanouye - Army Medal of Honor recipient, Jonathan Bornstein - Soccer player, Turk Schonert - Football player.
| This city: | 2.6 people |
| California: | 2.9 people |
| This city: | 68.6% |
| Whole state: | 68.7% |
| This city: | 4.4% |
| Whole state: | 7.2% |
Likely homosexual households (counted as self-reported same-sex unmarried-partner households)
- Lesbian couples: 0.3% of all households
- Gay men: 0.2% of all households
People in group quarters in Torrance in 2010:
- 578 people in nursing facilities/skilled-nursing facilities
- 285 people in group homes intended for adults
- 94 people in other noninstitutional facilities
- 86 people in workers' group living quarters and job corps centers
- 50 people in residential treatment centers for juveniles (non-correctional)
- 41 people in residential treatment centers for adults
- 12 people in group homes for juveniles (non-correctional)
People in group quarters in Torrance in 2000:
- 609 people in nursing homes
- 241 people in other noninstitutional group quarters
- 105 people in other group homes
- 71 people in hospitals/wards and hospices for chronically ill
- 71 people in other hospitals or wards for chronically ill
- 58 people in homes or halfway houses for drug/alcohol abuse
- 51 people in homes for the mentally ill
- 50 people in homes for the physically handicapped
- 27 people in other nonhousehold living situations
- 18 people in homes for the mentally retarded
- 13 people in religious group quarters
- 6 people in mental (psychiatric) hospitals or wards
Banks with most branches in Torrance (2011 data):
- Wells Fargo Bank, National Association: 8 branches. Info updated 2011/04/05: Bank assets: $1,161,490.0 mil, Deposits: $905,653.0 mil, headquarters in Sioux Falls, SD, positive income, 6395 total offices, Holding Company: Wells Fargo & Company
- JPMorgan Chase Bank, National Association: 7 branches. Info updated 2011/11/10: Bank assets: $1,811,678.0 mil, Deposits: $1,190,738.0 mil, headquarters in Columbus, OH, positive income, International Specialization, 5577 total offices, Holding Company: Jpmorgan Chase & Co.
- Bank of America, National Association: Torrance-Sartori Branch, Crenshaw And Artesia Branch, South Torrance Branch, Del Amo Center Branch, Crenshaw-Pacific Coast Hwy Branch. Info updated 2009/11/18: Bank assets: $1,451,969.3 mil, Deposits: $1,077,176.8 mil, headquarters in Charlotte, NC, positive income, 5782 total offices, Holding Company: Bank Of America Corporation
- U.S. Bank National Association: Torrance-Pacific Coast Highway Branc, Torrance - Hawthorne Blvd Branch, Torrance Carson Ralphs Branch, Torrance Branch. Info updated 2012/01/30: Bank assets: $330,470.8 mil, Deposits: $236,091.5 mil, headquarters in Cincinnati, OH, positive income, 3121 total offices, Holding Company: U.S. Bancorp
- OneWest Bank, FSB: Del Amo Savings Bank Branch, Torrance Branch, East Torrance Branch. Info updated 2011/07/21: Bank assets: $26,181.3 mil, Deposits: $15,408.4 mil, headquarters in Pasadena, CA, positive income, 79 total offices
- Union Bank, National Association: Rolling Hills Branch, South Bay Branch, Torrance Branch. Info updated 2011/09/01: Bank assets: $88,967.5 mil, Deposits: $65,286.4 mil, headquarters in San Francisco, CA, positive income, Commercial Lending Specialization, 403 total offices, Holding Company: Mitsubishi Ufj Financial Group, Inc.
- Hanmi Bank: Torrance-Del Amo Mall Branch at 21838 Hawthorne Boulevard, branch established on 2000/11/06; Torrance-Crenshaw Branch at 2370 Crenshaw Blvd., #h & I, branch established on 2002/10/22. Info updated 2010/04/01: Bank assets: $2,739.6 mil, Deposits: $2,377.7 mil, headquarters in Los Angeles, CA, positive income, Commercial Lending Specialization, 28 total offices, Holding Company: Hanmi Financial Corporation
- BBCN Bank: Torrance Branch at 2742 W. Sepulveda Blvd., branch established on 2001/05/21; Torrance Branch at 3030 West Sepulveda Boulevard, branch established on 1997/06/16. Info updated 2011/12/12: Bank assets: $5,170.7 mil, Deposits: $3,989.4 mil, headquarters in Los Angeles, CA, positive income, Commercial Lending Specialization, 49 total offices, Holding Company: Bbcn Bancorp, Inc.
- Comerica Bank: Torrance Main Banking Center Branch at 21153 Hawthorne Boulevard, branch established on 1980/06/02; Torrance Towne Center Branch at 2795 Pacific Coast Highway, branch established on 2007/12/07. Info updated 2011/07/29: Bank assets: $60,970.5 mil, Deposits: $48,300.9 mil, headquarters in Dallas, TX, positive income, Commercial Lending Specialization, 497 total offices, Holding Company: Comerica Incorporated
- 25 other banks with 28 local branches
For population 15 years and over in Torrance:
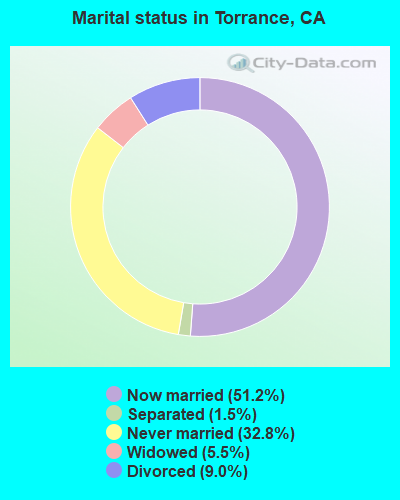
- Never married: 32.8%
- Now married: 51.2%
- Separated: 1.5%
- Widowed: 5.5%
- Divorced: 9.0%
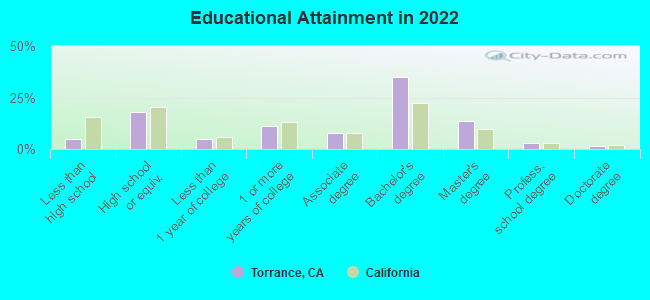
For population 25 years and over in Torrance:
- High school or higher: 95.1%
- Bachelor's degree or higher: 53.3%
- Graduate or professional degree: 18.2%
- Unemployed: 3.9%
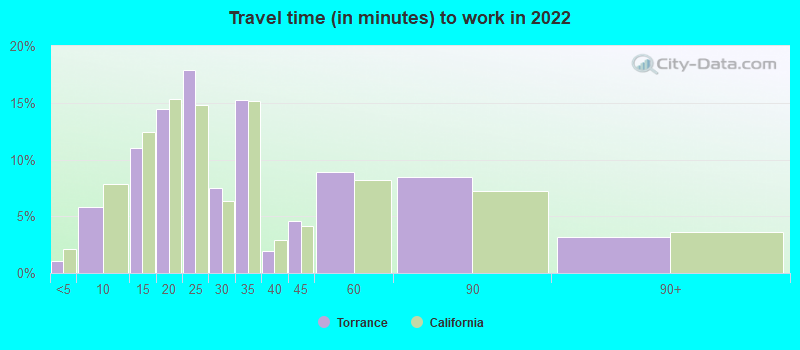
- Mean travel time to work (commute): 21.5 minutes
| Here: | 10.6 |
| California average: | 15.5 |


Graphs represent county-level data. Detailed 2008 Election Results
Neighborhoods in Torrance:
(Torrance, California Neighborhood Map)Religion statistics for Torrance, CA (based on Los Angeles County data)


| Religion | Adherents | Congregations |
|---|---|---|
| Catholic | 3,542,994 | 275 |
| Evangelical Protestant | 814,611 | 3,249 |
| Other | 451,594 | 1,023 |
| Mainline Protestant | 229,056 | 860 |
| Black Protestant | 112,338 | 290 |
| Orthodox | 63,517 | 76 |
| None | 4,604,495 | - |
Food Environment Statistics:
| This county: | 2.12 / 10,000 pop. |
| California: | 2.14 / 10,000 pop. |
| Los Angeles County: | 0.03 / 10,000 pop. |
| California: | 0.04 / 10,000 pop. |
| Here: | 0.58 / 10,000 pop. |
| California: | 0.62 / 10,000 pop. |
| Los Angeles County: | 1.23 / 10,000 pop. |
| California: | 1.49 / 10,000 pop. |
| This county: | 7.15 / 10,000 pop. |
| California: | 7.42 / 10,000 pop. |
| This county: | 7.5% |
| California: | 7.3% |
| Here: | 20.4% |
| California: | 21.3% |
| This county: | 18.6% |
| California: | 17.9% |
Health and Nutrition:
| This city: | 55.2% |
| California: | 49.4% |
| Torrance: | 52.7% |
| California: | 48.0% |
| Torrance: | 27.3 |
| State: | 28.1 |
| Here: | 17.1% |
| California: | 20.2% |
| Torrance: | 14.3% |
| California: | 11.2% |
| Torrance: | 6.9 |
| California: | 6.8 |
| Here: | 30.1% |
| California: | 31.5% |
| Torrance: | 59.7% |
| California: | 56.4% |
| Torrance: | 81.4% |
| California: | 80.9% |
More about Health and Nutrition of Torrance, CA Residents
| Local government employment and payroll (March 2022) | |||||
| Function | Full-time employees | Monthly full-time payroll | Average yearly full-time wage | Part-time employees | Monthly part-time payroll |
|---|---|---|---|---|---|
| Police Protection - Officers | 199 | $2,918,166 | $175,970 | 6 | $24,977 |
| Firefighters | 133 | $2,263,395 | $204,216 | 6 | $34,862 |
| Streets and Highways | 118 | $757,395 | $77,023 | 0 | $0 |
| Transit | 116 | $766,558 | $79,299 | 10 | $38,122 |
| Police - Other | 96 | $818,088 | $102,261 | 32 | $43,496 |
| Other and Unallocable | 86 | $519,470 | $72,484 | 17 | $23,421 |
| Financial Administration | 72 | $671,907 | $111,985 | 1 | $3,394 |
| Parks and Recreation | 64 | $399,471 | $74,901 | 197 | $228,840 |
| Housing and Community Development (Local) | 58 | $472,303 | $97,718 | 2 | $9,552 |
| Fire - Other | 42 | $262,035 | $74,867 | 0 | $0 |
| Other Government Administration | 40 | $294,801 | $88,440 | 6 | $19,830 |
| Local Libraries | 32 | $203,409 | $76,278 | 34 | $57,729 |
| Solid Waste Management | 21 | $226,863 | $129,636 | 1 | $2,311 |
| Water Supply | 21 | $205,093 | $117,196 | 2 | $2,869 |
| Judicial and Legal | 11 | $118,659 | $129,446 | 0 | $0 |
| Airports | 10 | $62,081 | $74,497 | 0 | $0 |
| Totals for Government | 1,119 | $10,959,695 | $117,530 | 314 | $489,402 |
Torrance government finances - Expenditure in 2021 (per resident):
- Construction - Regular Highways: $30,827,000 ($218.44)
Water Utilities: $20,812,000 ($147.47)
Transit Utilities: $3,637,000 ($25.77)
Sewerage: $652,000 ($4.62)
Police Protection: $611,000 ($4.33)
Housing and Community Development: $169,000 ($1.20)
Air Transportation: $159,000 ($1.13)
General - Other: $148,000 ($1.05)
Parks and Recreation: $2,000 ($0.01)
- Current Operations - Police Protection: $263,195,000 ($1864.96)
Local Fire Protection: $98,782,000 ($699.96)
Health - Other: $50,802,000 ($359.98)
Central Staff Services: $47,411,000 ($335.95)
Transit Utilities: $42,543,000 ($301.45)
Water Utilities: $37,557,000 ($266.12)
Regular Highways: $28,802,000 ($204.09)
Parks and Recreation: $24,607,000 ($174.36)
Solid Waste Management: $11,970,000 ($84.82)
Financial Administration: $11,438,000 ($81.05)
Protective Inspection and Regulation - Other: $9,764,000 ($69.19)
Libraries: $9,557,000 ($67.72)
Housing and Community Development: $7,243,000 ($51.32)
Judicial and Legal Services: $4,657,000 ($33.00)
Sewerage: $4,420,000 ($31.32)
Air Transportation: $3,001,000 ($21.26)
General - Other: $249,000 ($1.76)
- General - Interest on Debt: $3,212,000 ($22.76)
- Other Capital Outlay - Regular Highways: $3,394,000 ($24.05)
Transit Utilities: $1,996,000 ($14.14)
General - Other: $1,740,000 ($12.33)
Water Utilities: $734,000 ($5.20)
Local Fire Protection: $508,000 ($3.60)
Sewerage: $456,000 ($3.23)
Police Protection: $103,000 ($0.73)
Central Staff Services: $75,000 ($0.53)
Solid Waste Management: $66,000 ($0.47)
Air Transportation: $12,000 ($0.09)
Parks and Recreation: $2,000 ($0.01)
- Water Utilities - Interest on Debt: $101,000 ($0.72)
Torrance government finances - Revenue in 2021 (per resident):
- Charges - Air Transportation: $15,497,000 ($109.81)
Solid Waste Management: $12,920,000 ($91.55)
Other: $10,126,000 ($71.75)
Sewerage: $6,025,000 ($42.69)
Parks and Recreation: $1,861,000 ($13.19)
- Federal Intergovernmental - Other: $19,729,000 ($139.80)
Transit Utilities: $17,880,000 ($126.70)
Housing and Community Development: $1,084,000 ($7.68)
- Local Intergovernmental - Transit Utilities: $32,175,000 ($227.99)
Water Utilities: $470,000 ($3.33)
Other: $31,000 ($0.22)
- Miscellaneous - Rents: $4,335,000 ($30.72)
General Revenue - Other: $1,671,000 ($11.84)
Interest Earnings: $1,596,000 ($11.31)
Donations From Private Sources: $1,030,000 ($7.30)
Special Assessments: $1,021,000 ($7.23)
Fines and Forfeits: $649,000 ($4.60)
Sale of Property: $45,000 ($0.32)
Royalties: $11,000 ($0.08)
- Revenue - Water Utilities: $48,086,000 ($340.73)
Transit Utilities: $140,000 ($0.99)
- State Intergovernmental - Other: $13,568,000 ($96.14)
Transit Utilities: $9,903,000 ($70.17)
Highways: $5,845,000 ($41.42)
General Local Government Support: $178,000 ($1.26)
- Tax - General Sales and Gross Receipts: $78,188,000 ($554.03)
Property: $56,523,000 ($400.51)
Public Utilities Sales: $40,636,000 ($287.94)
Occupation and Business License - Other: $9,078,000 ($64.33)
Other License: $6,732,000 ($47.70)
Other Selective Sales: $6,032,000 ($42.74)
Other: $1,009,000 ($7.15)
Documentary and Stock Transfer: $1,005,000 ($7.12)
Torrance government finances - Debt in 2021 (per resident):
- Long Term Debt - Outstanding Unspecified Public Purpose: $413,688,000 ($2931.34)
Issue, Unspecified Public Purpose: $353,445,000 ($2504.46)
Beginning Outstanding - Unspecified Public Purpose: $61,219,000 ($433.79)
Retired Unspecified Public Purpose: $976,000 ($6.92)
Torrance government finances - Cash and Securities in 2021 (per resident):
- Bond Funds - Cash and Securities: $286,366,000 ($2029.15)
- Other Funds - Cash and Securities: $71,414,000 ($506.03)
- Sinking Funds - Cash and Securities: $3,274,000 ($23.20)
2.98% of this county's 2021 resident taxpayers lived in other counties in 2020 ($81,235 average adjusted gross income)
| Here: | 2.98% |
| California average: | 5.19% |
0.01% of residents moved from foreign countries ($155 average AGI)
Los Angeles County: 0.01% California average: 0.03%
Top counties from which taxpayers relocated into this county between 2020 and 2021:
| from Orange County, CA | |
| from San Bernardino County, CA | |
| from Riverside County, CA |
4.68% of this county's 2020 resident taxpayers moved to other counties in 2021 ($97,324 average adjusted gross income)
| Here: | 4.68% |
| California average: | 6.14% |
0.01% of residents moved to foreign countries ($196 average AGI)
Los Angeles County: 0.01% California average: 0.02%
Top counties to which taxpayers relocated from this county between 2020 and 2021:
| to Orange County, CA | |
| to San Bernardino County, CA | |
| to Riverside County, CA |
| Businesses in Torrance, CA | ||||
| Name | Count | Name | Count | |
|---|---|---|---|---|
| 24 Hour Fitness | 2 | Justice | 1 | |
| 7-Eleven | 13 | KFC | 4 | |
| 99 Cents Only Stores | 3 | Kincaid | 1 | |
| AMF Bowling | 1 | Kmart | 1 | |
| AT&T | 4 | Kohl's | 1 | |
| Ace Hardware | 1 | Kroger | 7 | |
| Aeropostale | 1 | LA Fitness | 2 | |
| Albertsons | 1 | La-Z-Boy | 1 | |
| American Eagle Outfitters | 1 | Lane Bryant | 1 | |
| Ann Taylor | 1 | Lane Furniture | 2 | |
| Arby's | 1 | LensCrafters | 2 | |
| Audi | 1 | Levi Strauss & Co. | 1 | |
| AutoZone | 3 | Little Caesars Pizza | 1 | |
| Avenue | 1 | Long John Silver's | 1 | |
| BMW | 1 | Lowe's | 2 | |
| Bakers | 2 | Macy's | 3 | |
| Bally Total Fitness | 1 | Marriott | 3 | |
| Barnes & Noble | 1 | Marshalls | 1 | |
| Baskin-Robbins | 5 | MasterBrand Cabinets | 15 | |
| Bath & Body Works | 2 | Mazda | 1 | |
| Bed Bath & Beyond | 1 | McDonald's | 6 | |
| Best Western | 1 | Men's Wearhouse | 1 | |
| Big O Tires | 1 | Motherhood Maternity | 4 | |
| Blockbuster | 1 | New Balance | 6 | |
| Brookstone | 1 | New York & Co | 1 | |
| Budget Car Rental | 1 | Nike | 28 | |
| Buffalo Wild Wings | 1 | Office Depot | 3 | |
| Burger King | 3 | OfficeMax | 1 | |
| Burlington Coat Factory | 1 | Old Navy | 1 | |
| CVS | 5 | Olive Garden | 1 | |
| Carl\s Jr. | 6 | Outback | 1 | |
| Catherines | 1 | Outback Steakhouse | 1 | |
| Charlotte Russe | 1 | Pac Sun | 1 | |
| Chevrolet | 1 | Panda Express | 4 | |
| Chick-Fil-A | 1 | Panera Bread | 1 | |
| Chipotle | 2 | Payless | 4 | |
| Chuck E. Cheese's | 2 | Penske | 3 | |
| Cinnabon | 1 | PetSmart | 1 | |
| Circle K | 1 | Pier 1 Imports | 1 | |
| Cold Stone Creamery | 2 | Pizza Hut | 4 | |
| Costco | 1 | Quiznos | 5 | |
| Crate & Barrel | 1 | RadioShack | 3 | |
| Curves | 2 | Ramada | 1 | |
| DHL | 8 | Red Lobster | 1 | |
| Days Inn | 1 | Rite Aid | 4 | |
| Decora Cabinetry | 6 | SAS Shoes | 2 | |
| Dennys | 2 | Safeway | 2 | |
| Discount Tire | 2 | Sam's Club | 1 | |
| Domino's Pizza | 3 | Sears | 5 | |
| Eddie Bauer | 1 | Sephora | 1 | |
| El Pollo Loco | 3 | Skechers USA | 1 | |
| Ethan Allen | 1 | Sprint Nextel | 2 | |
| Express | 1 | Staples | 2 | |
| Extended Stay America | 2 | Starbucks | 17 | |
| Fashion Bug | 1 | Subaru | 1 | |
| FedEx | 31 | Subway | 6 | |
| Forever 21 | 1 | Super 8 | 1 | |
| Fredericks Of Hollywood | 1 | T-Mobile | 13 | |
| GNC | 5 | T.G.I. Driday's | 1 | |
| GameStop | 6 | T.J.Maxx | 1 | |
| Gap | 2 | Taco Bell | 5 | |
| Gymboree | 1 | Target | 1 | |
| H&M | 1 | The Room Place | 1 | |
| H&R Block | 5 | Toyota | 1 | |
| Hilton | 1 | Toys"R"Us | 2 | |
| Holiday Inn | 2 | Trader Joe's | 2 | |
| Hollister Co. | 1 | Travelodge | 1 | |
| Home Depot | 1 | U-Haul | 6 | |
| HomeTown Buffet | 1 | UPS | 27 | |
| Homestead Studio Suites | 1 | Urban Outfitters | 1 | |
| Honda | 2 | Vans | 10 | |
| Howard Johnson | 1 | Verizon Wireless | 3 | |
| IHOP | 1 | Victoria's Secret | 2 | |
| J. Jill | 1 | Vons | 2 | |
| JCPenney | 1 | Walgreens | 4 | |
| Jack In The Box | 7 | Walmart | 1 | |
| Jamba Juice | 2 | Wet Seal | 1 | |
| JoS. A. Bank | 1 | Whole Foods Market | 1 | |
| Johnny Rockets | 1 | YMCA | 1 | |
| Jones New York | 13 | Z Gallerie | 1 | |
| Just Tires | 1 | |||
Strongest AM radio stations in Torrance:
- KNX (1070 AM; 50 kW; LOS ANGELES, CA; Owner: INFINITY BROADCASTING OPERATIONS, INC.)
- KFI (640 AM; 50 kW; LOS ANGELES, CA; Owner: CAPSTAR TX LIMITED PARTNERSHIP)
- KFWB (980 AM; 50 kW; LOS ANGELES, CA; Owner: INFINITY BROADCASTING OPERATIONS, INC.)
- KSPN (710 AM; 50 kW; LOS ANGELES, CA; Owner: KABC-AM RADIO, INC.)
- KLAC (570 AM; 50 kW; LOS ANGELES, CA; Owner: AMFM RADIO LICENSES, L.L.C.)
- KBLA (1580 AM; 50 kW; SANTA MONICA, CA)
- KMPC (1540 AM; 50 kW; LOS ANGELES, CA; Owner: ROSE CITY RADIO CORPORATION)
- KTNQ (1020 AM; 50 kW; LOS ANGELES, CA; Owner: KTNQ-AM LICENSE CORP.)
- KXTA (1150 AM; 50 kW; LOS ANGELES, CA; Owner: CITICASTERS LICENSES, L.P.)
- KDIS (1110 AM; 50 kW; PASADENA, CA; Owner: ABC,INC.)
- KXMX (1190 AM; 25 kW; ANAHEIM, CA; Owner: NEW INSPIRATION BROADCASTING COMPANY)
- KRLA (870 AM; 20 kW; GLENDALE, CA; Owner: NEW INSPIRATION BROADCASTING COMPANY)
- KFOX (1650 AM; 10 kW; TORRANCE, CA; Owner: CHAGAL COMMUNICATIONS, INC.)
Strongest FM radio stations in Torrance:
- KZAB (93.5 FM; REDONDO BEACH, CA; Owner: KZAB LICENSING, INC.)
- KKBT (100.3 FM; LOS ANGELES, CA; Owner: RADIO ONE LICENSES, LLC)
- KZLA-FM (93.9 FM; LOS ANGELES, CA; Owner: EMMIS RADIO LICENSE CORPORATION)
- KPWR (105.9 FM; LOS ANGELES, CA; Owner: EMMIS RADIO LICENSE CORPORATION)
- KLSX (97.1 FM; LOS ANGELES, CA; Owner: INFINITY BROADCASTING OPERATIONS, INC.)
- KRTH-FM (101.1 FM; LOS ANGELES, CA; Owner: INFINITY BROADCASTING OPERATIONS, INC.)
- KUSC (91.5 FM; LOS ANGELES, CA; Owner: UNIVERSITY OF SOUTHERN CALIFORNIA)
- KKLA-FM (99.5 FM; LOS ANGELES, CA; Owner: NEW INSPIRATION BROADCASTING CO., INC.)
- KCBS-FM (93.1 FM; LOS ANGELES, CA; Owner: INFINITY BROADCASTING OPERATIONS, INC.)
- KBUE (105.5 FM; LONG BEACH, CA; Owner: LBI RADIO LICENSE CORP.)
- KSCA (101.9 FM; GLENDALE, CA; Owner: HBC LICENSE CORPORATION)
- KLOS (95.5 FM; LOS ANGELES, CA; Owner: KLOS-FM RADIO, INC.)
- K212FA (90.3 FM; TEMPLE CITY, CA; Owner: EDUCATIONAL MEDIA FOUNDATION)
- KOST (103.5 FM; LOS ANGELES, CA; Owner: CAPSTAR TX LIMITED PARTNERSHIP)
- KLVE (107.5 FM; LOS ANGELES, CA; Owner: KLVE-FM LICENSE CORP.)
- KIIS-FM (102.7 FM; LOS ANGELES, CA; Owner: CITICASTERS LICENSES, L.P.)
- KPCC (89.3 FM; PASADENA, CA; Owner: PASADENA AREA COMMUNITY COLLEGE DISTRICT)
- KHHT (92.3 FM; LOS ANGELES, CA; Owner: AMFM RADIO LICENSES, L.L.C.)
- KBIG-FM (104.3 FM; LOS ANGELES, CA; Owner: AMFM RADIO LICENSES, L.L.C.)
- KMZT-FM (105.1 FM; LOS ANGELES, CA; Owner: MOUNT WILSON FM BROADCASTERS, INC.)
TV broadcast stations around Torrance:
- KTRO-LP (Channel 50; LANCASTER, CA; Owner: ROBERT D. ADELMAN)
- KCBS-TV (Channel 2; LOS ANGELES, CA; Owner: CBS BROADCASTING INC.)
- KNBC (Channel 4; LOS ANGELES, CA; Owner: NBC SUBSIDIARY (KNBC-TV), INC.)
Medal of Honor Recipients
Medal of Honor Recipient born in Torrance: Edward A., Jr. Devore.
- National Bridge Inventory (NBI) Statistics
- 39Number of bridges
- 318ft / 97.1mTotal length
- 2,909,305Total average daily traffic
- 137,952Total average daily truck traffic
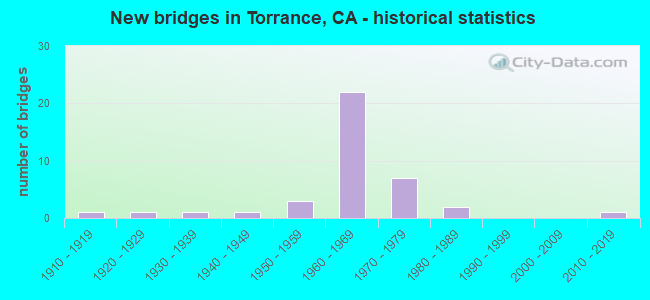
- New bridges - historical statistics
- 11910-1919
- 11920-1929
- 11930-1939
- 11940-1949
- 31950-1959
- 221960-1969
- 71970-1979
- 21980-1989
- 12010-2019
FCC Registered Commercial Land Mobile Towers: 1 (See the full list of FCC Registered Commercial Land Mobile Towers in Torrance, CA)
FCC Registered Private Land Mobile Towers: 3 (See the full list of FCC Registered Private Land Mobile Towers)
FCC Registered Broadcast Land Mobile Towers: 126 (See the full list of FCC Registered Broadcast Land Mobile Towers)
FCC Registered Microwave Towers: 126 (See the full list of FCC Registered Microwave Towers in this town)
FCC Registered Paging Towers: 5 (See the full list of FCC Registered Paging Towers)
FCC Registered Maritime Coast & Aviation Ground Towers: 11 (See the full list of FCC Registered Maritime Coast & Aviation Ground Towers)
FCC Registered Amateur Radio Licenses: 1,667 (See the full list of FCC Registered Amateur Radio Licenses in Torrance)
FAA Registered Aircraft Manufacturers and Dealers: 17 (See the full list of FAA Registered Manufacturers and Dealers in Torrance)
FAA Registered Aircraft: 284 (See the full list of FAA Registered Aircraft)
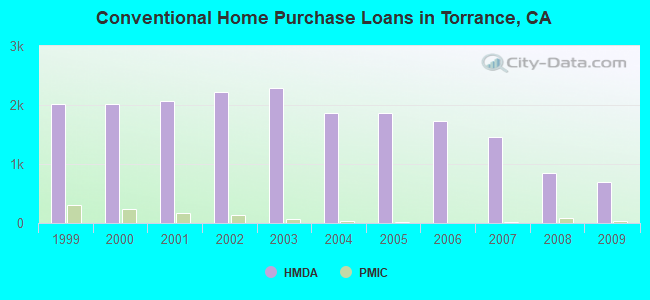
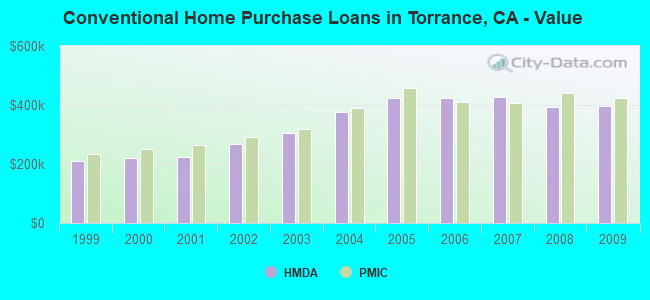
| Home Mortgage Disclosure Act Aggregated Statistics For Year 2009 (Based on 27 full tracts) | ||||||||||||||
| A) FHA, FSA/RHS & VA Home Purchase Loans | B) Conventional Home Purchase Loans | C) Refinancings | D) Home Improvement Loans | E) Loans on Dwellings For 5+ Families | F) Non-occupant Loans on < 5 Family Dwellings (A B C & D) | G) Loans On Manufactured Home Dwelling (A B C & D) | ||||||||
|---|---|---|---|---|---|---|---|---|---|---|---|---|---|---|
| Number | Average Value | Number | Average Value | Number | Average Value | Number | Average Value | Number | Average Value | Number | Average Value | Number | Average Value | |
| LOANS ORIGINATED | 171 | $496,273 | 696 | $398,123 | 3,809 | $338,502 | 226 | $245,584 | 5 | $3,555,820 | 225 | $307,006 | 6 | $79,642 |
| APPLICATIONS APPROVED, NOT ACCEPTED | 12 | $387,490 | 107 | $382,594 | 432 | $382,919 | 18 | $255,411 | 0 | $0 | 25 | $294,198 | 9 | $136,712 |
| APPLICATIONS DENIED | 24 | $430,180 | 136 | $412,938 | 900 | $388,480 | 35 | $255,462 | 1 | $965,000 | 90 | $314,321 | 12 | $77,028 |
| APPLICATIONS WITHDRAWN | 26 | $417,925 | 104 | $396,350 | 541 | $369,153 | 34 | $289,645 | 0 | $0 | 47 | $311,857 | 1 | $103,000 |
| FILES CLOSED FOR INCOMPLETENESS | 8 | $319,011 | 33 | $398,771 | 169 | $385,468 | 13 | $187,418 | 0 | $0 | 7 | $354,143 | 3 | $84,950 |
Detailed mortgage data for all 27 tracts in Torrance, CA
| Private Mortgage Insurance Companies Aggregated Statistics For Year 2009 (Based on 21 full tracts) | ||||
| A) Conventional Home Purchase Loans | B) Refinancings | |||
|---|---|---|---|---|
| Number | Average Value | Number | Average Value | |
| LOANS ORIGINATED | 37 | $424,408 | 13 | $463,515 |
| APPLICATIONS APPROVED, NOT ACCEPTED | 25 | $425,304 | 7 | $493,429 |
| APPLICATIONS DENIED | 8 | $417,500 | 5 | $446,200 |
| APPLICATIONS WITHDRAWN | 4 | $443,750 | 1 | $524,000 |
| FILES CLOSED FOR INCOMPLETENESS | 1 | $409,000 | 0 | $0 |
2005 - 2018 National Fire Incident Reporting System (NFIRS) incidents
- Fire incident types reported to NFIRS in Torrance, CA
- 85245.2%Outside Fires
- 53628.4%Structure Fires
- 37619.9%Mobile Property/Vehicle Fires
- 1216.4%Other
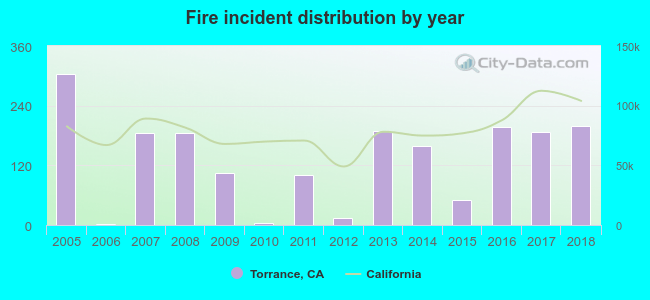 Based on the data from the years 2005 - 2018 the average number of fire incidents per year is 135. The highest number of reported fire incidents - 304 took place in 2005, and the least - 3 in 2006. The data has a dropping trend.
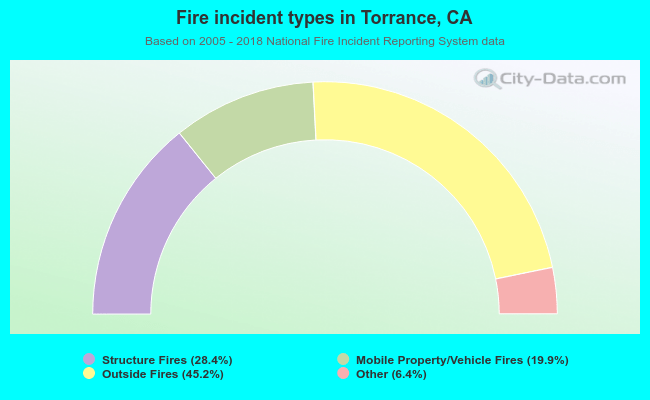 When looking into fire subcategories, the most incidents belonged to: Outside Fires (45.2%), and Structure Fires (28.4%).
Fire-safe hotels and motels in Torrance, California:
- Staybridge Suites Torrance, 19901 Prairie Ave, Torrance, California 90503 , Phone: (310) 371-8525, Fax: (310) 542-9628
- Residence Inn By Marriott Torrance, 3701 Torrance Blvd, Torrance, California 90503 , Phone: (310) 543-4566, Fax: (310) 543-3026
- Torrance Marriott Redondo Beach, 3635 Fashion Way, Torrance, California 90503 , Phone: (310) 316-3636
- Courtyard By Marriott Torrance - Palos Verdes, 2633 Sepulveda Blvd, Torrance, California 90505 , Phone: (310) 533-8000, Fax: (310) 533-0564
- Holiday Inn Torrance, 19800 S Vermont Ave, Torrance, California 90502 , Phone: (310) 781-9100, Fax: (310) 327-8296
- Torrance Hilton At South Bay, 21333 Hawthorne Blvd, Torrance, California 90503 , Phone: (310) 540-0500, Fax: (310) 540-2065
- Extended Stay America - Los Angeles - Torrance Blvd, 3525 Torrance Blvd, Torrance, California 90503 , Phone: (310) 540-5442, Fax: (310) 540-0552
- Bluestem Hotel, 2448 Sepulveda Blvd, Torrance, California 90501 , Phone: (310) 539-9888, Fax: (877) 268-1225
- 9 other hotels and motels
| Most common first names in Torrance, CA among deceased individuals | ||
| Name | Count | Lived (average) |
|---|---|---|
| Mary | 773 | 78.9 years |
| John | 747 | 72.8 years |
| William | 637 | 72.8 years |
| Robert | 607 | 70.6 years |
| James | 540 | 71.3 years |
| George | 451 | 75.3 years |
| Charles | 414 | 75.2 years |
| Helen | 355 | 79.7 years |
| Joseph | 335 | 74.8 years |
| Margaret | 329 | 78.7 years |
| Most common last names in Torrance, CA among deceased individuals | ||
| Last name | Count | Lived (average) |
|---|---|---|
| Smith | 261 | 74.5 years |
| Johnson | 181 | 75.7 years |
| Miller | 144 | 77.2 years |
| Wilson | 139 | 74.6 years |
| Jones | 139 | 76.2 years |
| Brown | 126 | 76.2 years |
| Lee | 119 | 75.8 years |
| Davis | 118 | 74.8 years |
| Williams | 115 | 73.2 years |
| Moore | 104 | 76.3 years |
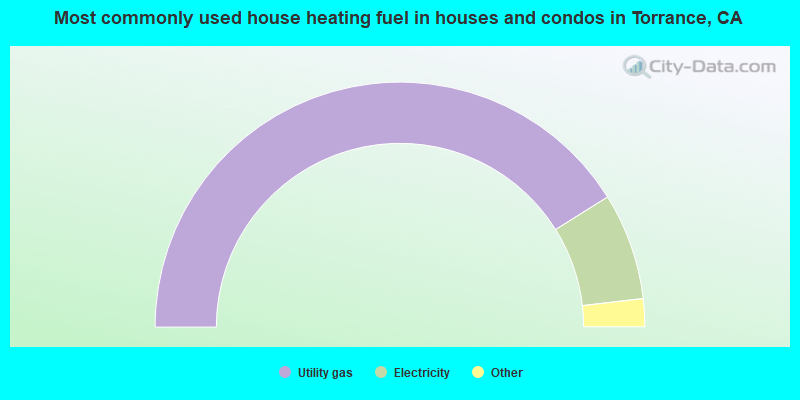
- 82.2%Utility gas
- 14.1%Electricity
- 1.4%No fuel used
- 1.4%Bottled, tank, or LP gas
- 0.6%Solar energy
- 0.3%Wood
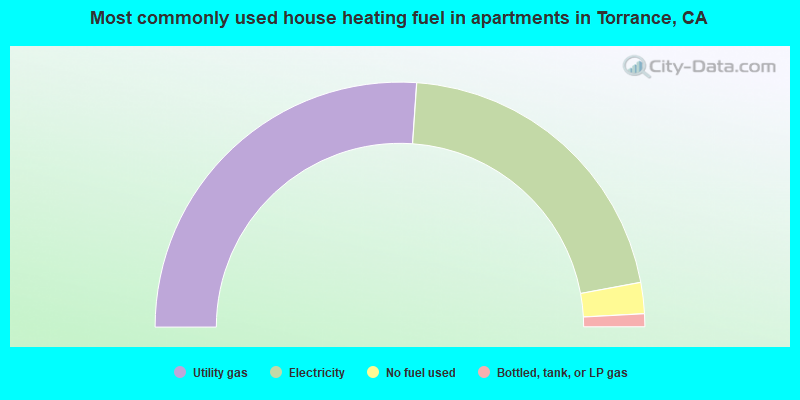
- 52.1%Utility gas
- 41.9%Electricity
- 4.1%No fuel used
- 1.7%Bottled, tank, or LP gas
Torrance compared to California state average:
- Unemployed percentage significantly below state average.
- Hispanic race population percentage below state average.
- Median age significantly above state average.
- Percentage of population with a bachelor's degree or higher above state average.
Torrance, CA compared to other similar cities:
Torrance on our top lists:
- #13 on the list of "Top 101 cities with the most residents born in Japan (population 500+)"
- #29 on the list of "Top 101 cities with the smallest temperature differences during a year (population 50,000+)"
- #29 on the list of "Top 101 cities with largest percentage of females in industries: utilities (population 50,000+)"
- #39 on the list of "Top 100 cities with highest median house value (pop. 50,000+)"
- #41 on the list of "Top 100 cities with highest ratio of median house value to median household income (pop. 50,000+)"
- #42 on the list of "Top 101 cities with the most residents born in Korea (population 500+)"
- #49 on the list of "Top 101 cities with largest percentage of males in occupations: healthcare support occupations (population 50,000+)"
- #49 on the list of "Top 101 cities with the largest city-data.com crime index decrease from 2002 to 2012 (population 50,000+)"
- #51 on the list of "Top 101 cities with largest percentage of males in occupations: architecture and engineering occupations (population 50,000+)"
- #52 on the list of "Top 101 cities with largest percentage of females in industries: wholesale trade (population 50,000+)"
- #56 on the list of "Top 101 cities with the lowest number of assaults per 100,000 residents (population 50,000+)"
- #58 on the list of "Top 101 cities with the most residents born in Eastern Asia (population 500+)"
- #67 on the list of "Top 101 cities with the lowest number of arson incidents per 100,000 residents (population 50,000+)"
- #68 on the list of "Top 101 cities with the lowest city-data.com crime index (population 50,000+)"
- #69 on the list of "Top 101 cities with largest percentage of females in occupations: health technologists and technicians (population 50,000+)"
- #71 on the list of "Top 101 cities with the least people below the poverty level (population 50,000+)"
- #74 on the list of "Top 101 cities with largest percentage of males in occupations: legal occupations (population 50,000+)"
- #78 on the list of "Top 101 cities with the lowest number of thefts per 100,000 residents (population 50,000+)"
- #79 on the list of "Top 101 cities with the smallest city-data.com crime index per police officer (population 50,000+)"
- #82 on the list of "Top 101 cities with largest percentage of males in industries: information (population 50,000+)"
- #25 (90505) on the list of "Top 101 zip codes with the most offices of physicians in 2005"
- #1 on the list of "Top 101 counties with the most Evangelical Protestant congregations"
- #1 on the list of "Top 101 counties with the most Mainline Protestant congregations"
- #1 on the list of "Top 101 counties with the most Orthodox adherents"
- #1 on the list of "Top 101 counties with the highest ground withdrawal of fresh water for public supply (pop. 50,000+)"
- #1 on the list of "Top 101 counties with the most Catholic adherents (pop. 50,000+)"

|
|
Total of 2464 patent applications in 2008-2024.