According to our research of West Virginia and other state lists, there were 9 registered sex offenders living in Williamstown, West Virginia as of April 25, 2024. The ratio of all residents to sex offenders in Williamstown is 325 to 1. The ratio of registered sex offenders to all residents in this city is near the state average.
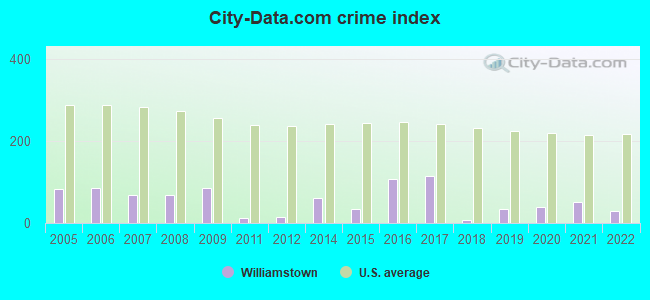
Crime rates in Williamstown by year
Type
2009
2011
2012
2014
2015
2016
2017
2018
2019
2020
2021
2022
Murders (per 100,000)
0 (0.0)
0 (0.0)
0 (0.0)
0 (0.0)
0 (0.0)
0 (0.0)
1 (33.9)
0 (0.0)
0 (0.0)
0 (0.0)
0 (0.0)
0 (0.0)
Rapes (per 100,000)
0 (0.0)
0 (0.0)
0 (0.0)
1 (34.1)
0 (0.0)
0 (0.0)
0 (0.0)
0 (0.0)
0 (0.0)
0 (0.0)
0 (0.0)
0 (0.0)
Robberies (per 100,000)
1 (33.5)
0 (0.0)
0 (0.0)
0 (0.0)
0 (0.0)
0 (0.0)
0 (0.0)
0 (0.0)
0 (0.0)
0 (0.0)
0 (0.0)
0 (0.0)
Assaults (per 100,000)
4 (134.2)
1 (34.3)
2 (68.7)
2 (68.1)
2 (67.9)
11 (369.5)
6 (203.7)
0 (0.0)
3 (104.2)
4 (139.7)
6 (210.2)
4 (134.6)
Burglaries (per 100,000)
5 (167.7)
1 (34.3)
0 (0.0)
2 (68.1)
4 (135.9)
5 (168.0)
1 (33.9)
0 (0.0)
1 (34.7)
0 (0.0)
1 (35.0)
0 (0.0)
Thefts (per 100,000)
24 (805.1)
1 (34.3)
1 (34.4)
10 (340.7)
7 (237.8)
8 (268.7)
2 (67.9)
1 (34.4)
6 (208.4)
1 (34.9)
5 (175.1)
1 (33.7)
Auto thefts (per 100,000)
1 (33.5)
0 (0.0)
0 (0.0)
1 (34.1)
1 (34.0)
4 (134.4)
0 (0.0)
2 (68.8)
1 (34.7)
3 (104.7)
0 (0.0)
0 (0.0)
Arson (per 100,000)
0 (0.0)
0 (0.0)
0 (0.0)
0 (0.0)
0 (0.0)
0 (0.0)
0 (0.0)
0 (0.0)
0 (0.0)
0 (0.0)
0 (0.0)
0 (0.0)
City-Data.com crime index
83.5
10.6
15.1
62.0
35.3
107.2
113.7
6.9
34.4
37.7
51.5
28.3
The City-Data.com crime index weighs serious crimes and violent crimes more heavily. Higher means more crime, U.S. average is 246.1. It adjusts for the number of visitors and daily workers commuting into cities.
Latest news from Williamstown, WV collected exclusively by city-data.com from local newspapers, TV, and radio stations
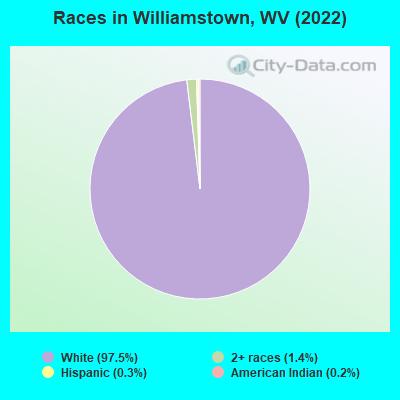
Ancestries: American (28.3%), English (18.8%), German (12.9%), Irish (8.4%), European (5.6%), Scotch-Irish (4.0%).
Current Local Time: EST time zone
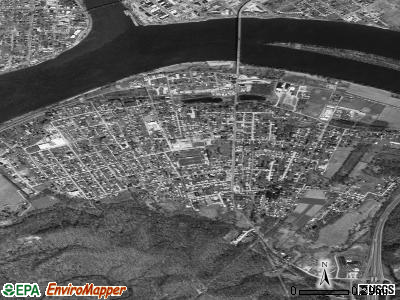
Elevation: 630 feet
Land area: 1.34 square miles.
Population density: 2,210 people per square mile (low).
41 residents are foreign born
This city:
1.4%
West Virginia:
1.1%
Median real estate property taxes paid for housing units with mortgages in 2022: $1,265 (0.6%) Median real estate property taxes paid for housing units with no mortgage in 2022: $1,107 (0.9%)
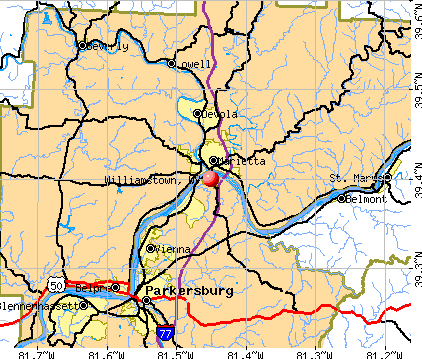
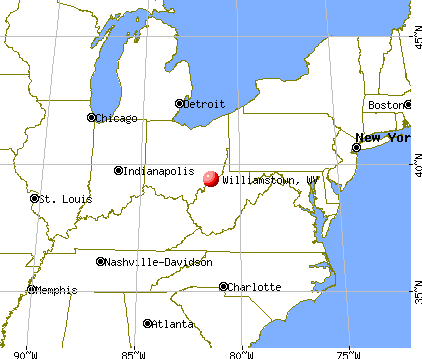
Nearest city with pop. 50,000+: Charleston, WV (73.3 miles , pop. 53,421).
Nearest city with pop. 200,000+: Columbus, OH (91.6 miles , pop. 711,470).
Nearest city with pop. 1,000,000+: Philadelphia, PA (338.1 miles , pop. 1,517,550).
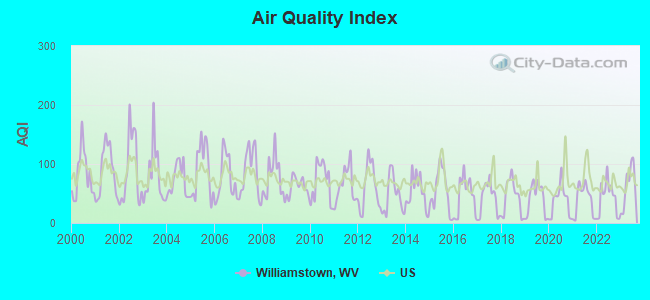
Air Quality Index (AQI) level in 2023 was 64.0. This is about average.
City:
64.0
U.S.:
72.6
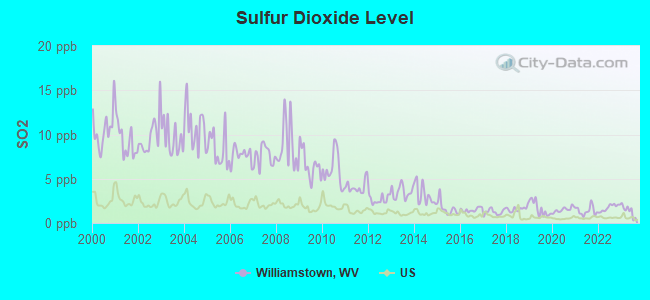
Sulfur Dioxide (SO2) [ppb] level in 2023 was 1.39. This is about average.Closest monitor was 0.8 miles away from the city center.
City:
1.39
U.S.:
1.51
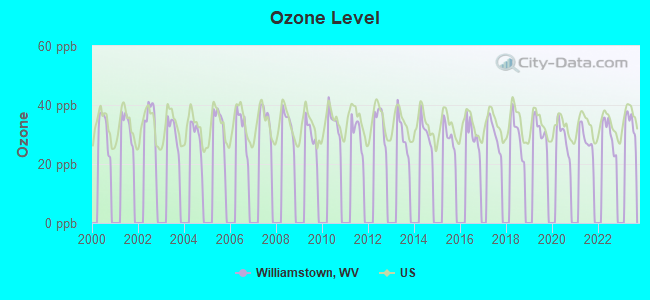
Ozone [ppb] level in 2022 was 30.3. This is about average.Closest monitor was 2.3 miles away from the city center.
City:
30.3
U.S.:
33.3
Tornado activity:
Williamstown-area historical tornado activity is slightly above West Virginia state average. It is 58% smaller than the overall U.S. average.
On 4/23/1968, a category F5 (max. wind speeds 261-318 mph) tornado 56.8 miles away from the Williamstown city center killed 7 peopleand injured 93 peopleand causedbetween $500,000 and $5,000,000 in damages.
On 10/1/1986, a category F3 (max. wind speeds 158-206 mph) tornado 36.5 miles away from the city center injured one personand causedbetween $50,000 and $500,000 in damages.
Earthquake activity:
Williamstown-area historical earthquake activity is significantly above West Virginia state average. It is 22% smaller than the overall U.S. average.
On 8/23/2011 at 17:51:04, a magnitude 5.8 (5.8 MW, Depth: 3.7 mi, Class: Moderate, Intensity: VI - VII) earthquake occurred 216.0 miles away from the city center On 9/25/1998 at 19:52:52, a magnitude 5.2 (4.8 MB, 4.3 MS, 5.2 LG, 4.5 MW, Depth: 3.1 mi) earthquake occurred 154.9 miles away from Williamstown center On 7/27/1980 at 18:52:21, a magnitude 5.2 (5.1 MB, 4.7 MS, 5.0 UK, 5.2 UK) earthquake occurred 157.7 miles away from the city center On 1/31/1986 at 16:46:43, a magnitude 5.0 (5.0 MB) earthquake occurred 153.1 miles away from Williamstown center On 8/9/2020 at 12:07:37, a magnitude 5.1 (5.1 MW, Depth: 4.7 mi) earthquake occurred 203.2 miles away from Williamstown center On 9/7/1988 at 02:28:09, a magnitude 4.6 (4.5 MB, 4.6 LG, Class: Light, Intensity: IV - V) earthquake occurred 157.1 miles away from Williamstown center Magnitude types: regional Lg-wave magnitude (LG), body-wave magnitude (MB), surface-wave magnitude (MS), moment magnitude (MW)
Natural disasters:
The number of natural disasters in Wood County (15) is near the US average (15). Major Disasters (Presidential) Declared: 10 Emergencies Declared: 4
Causes of natural disasters: Floods: 8, Storms: 7, Landslides: 4, Mudslides: 3, Hurricanes: 2, Winds: 2, Winter Storms: 2, Blizzard: 1, Snowfall: 1, Tornado: 1, Other: 1 (Note: some incidents may be assigned to more than one category).
Hospitals and medical centers near Williamstown:
HARMAR PLACE REHAB AND EXTENDED CARE (Nursing Home, about 2 miles away; MARIETTA, OH)
VENCARE HOSPICE - MARIETTA (Hospital, about 2 miles away; MARIETTA, OH)
MARIETTA CARE AND REHAB CTR (Nursing Home, about 2 miles away; MARIETTA, OH)
MARIETTA CONV CTR (Nursing Home, about 2 miles away; MARIETTA, OH)
VOCA OF OHIO/HILLCREST GROUP HOME (Hospital, about 2 miles away; MARIETTA, OH)
FMC - DIALYSIS SPECIALISTS OF MARIETTA (Dialysis Facility, about 2 miles away; MARIETTA, OH)
VOCA OF OHIO/MONTGOMERY GH (Hospital, about 3 miles away; MARIETTA, OH)
Colleges/universities with over 2000 students nearest to Williamstown:
West Virginia University at Parkersburg (about 14 miles; Parkersburg, WV; Full-time enrollment: 2,619)
Churches in Williamstown include: Christ Memorial Church (A), Faith Bible Church (B), First Baptist Church of Williamstown (C), First Presbyterian Church (D), Williamstown Church of Christ (E), Williamstown Church of God (F), Williamstown Church of the Nazarene (G), Williamstown United Methodist Church (H). Display/hide their locations on the map
Monitoring and Reporting (DBP) - Between OCT-2013 and NOV-2013, Contaminant: Total Haloacetic Acids (HAA5). Follow-up actions: St Public Notif requested (FEB-13-2014), St Formal NOV issued (FEB-13-2014), St Compliance achieved (FEB-25-2014)
Monitoring and Reporting (DBP) - Between OCT-2013 and NOV-2013, Contaminant: TTHM. Follow-up actions: St Public Notif requested (FEB-13-2014), St Formal NOV issued (FEB-13-2014), St Compliance achieved (FEB-25-2014)
WILLIAMSTOWN WATER DEPT (Address: 5TH STREET , Population served: 3,363, Groundwater):
Past monitoring violations:
One minor monitoring violation
16 regular monitoring violations
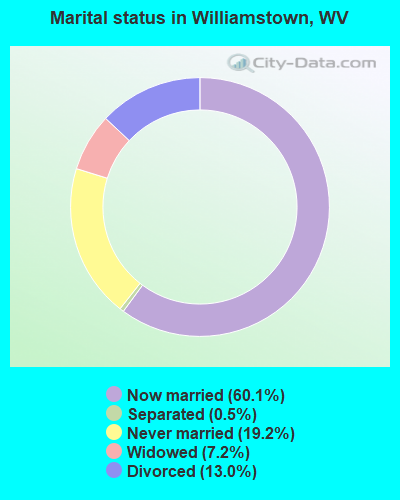
Average household size:
This city:
2.3 people
West Virginia:
2.4 people
Percentage of family households:
This city:
67.6%
Whole state:
65.8%
Percentage of households with unmarried partners:
This city:
3.8%
Whole state:
6.6%
Likely homosexual households (counted as self-reported same-sex unmarried-partner households)
Lesbian couples: 0.1% of all households
Gay men: 0.0% of all households
Banks with branches in Williamstown (2011 data):
Williamstown Bank, Inc.: at 435 Highland Avenue, branch established on 1919/01/01. Info updated 2007/12/21: Bank assets: $133.1 mil, Deposits: $118.8 mil, local headquarters, positive income, Commercial Lending Specialization, 2 total offices
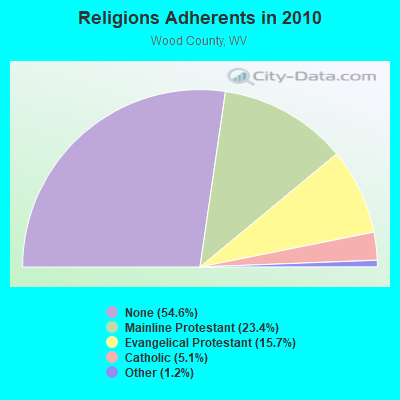
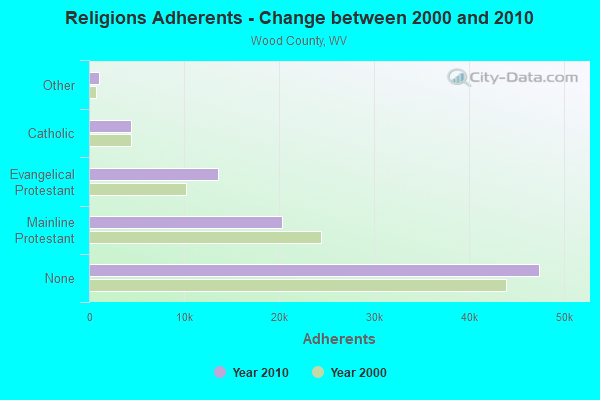
Religion statistics for Williamstown, WV (based on Wood County data)
Religion
Adherents
Congregations
Mainline Protestant
20,360
95
Evangelical Protestant
13,623
79
Catholic
4,444
4
Other
1,068
5
Black Protestant
24
1
None
47,437
-
Source: Clifford Grammich, Kirk Hadaway, Richard Houseal, Dale E.Jones, Alexei Krindatch, Richie Stanley and Richard H.Taylor. 2012. 2010 U.S.Religion Census: Religious Congregations & Membership Study. Association of Statisticians of American Religious Bodies. Jones, Dale E., et al. 2002. Congregations and Membership in the United States 2000. Nashville, TN: Glenmary Research Center. Graphs represent county-level data
Aircraft: GRAY RICHARD D F1 ROCKET (Category: Land, Seats: 2, Weight: Up to 12,499 Pounds), Engine: LYCOMING IO 540 SER (260 HP) (Reciprocating) N-Number: 251RG, N251RG, N-251RG, Serial Number: 089, Year manufactured: 2008, Airworthiness Date: 03/19/2012, Certificate Issue Date: 08/11/2020 Registrant (Individual): Mary Bunn, 162 N Dry Run Rd, Williamstown, WV 26187
Aircraft: HENDERSON RANDY G ROTORWAY 162 (Category: Land, Seats: 2, Weight: Up to 12,499 Pounds), Engine: ROTORWAY RW-162 (150 HP) (Reciprocating) N-Number: 67HM, N67HM, N-67HM, Serial Number: 6781, Year manufactured: 2014, Airworthiness Date: 08/30/2014, Certificate Issue Date: 06/19/2014 Registrant (Individual): Randy G Henderson, 2550 Williamstown Pike, Williamstown, WV 26187
Aircraft: MOONEY M20E (Category: Land, Seats: 4, Weight: Up to 12,499 Pounds, Speed: 127 mph), Engine: LYCOMING I0360 SER (180 HP) (Reciprocating) N-Number: 7825V, N7825V, N-7825V, Serial Number: 447, Year manufactured: 1964, Airworthiness Date: 08/25/1964, Certificate Issue Date: 05/13/2019 Registrant (Individual): Randy G Henderson, 2550 Williamstown Pike, Williamstown, WV 26187
Aircraft: PIPER PA-28-235 (Category: Land, Seats: 4, Weight: Up to 12,499 Pounds, Speed: 107 mph), Engine: LYCOMING 0-540 SERIES (250 HP) (Reciprocating) N-Number: 8531N, N8531N, N-8531N, Serial Number: 28-11330, Year manufactured: 1969, Airworthiness Date: 10/01/1969, Certificate Issue Date: 05/02/2017 Registrant (Co-Owned): Joseph S Caltrider, Po Box 85, Williamstown, WV 26187, Other Owners: Robert W Coulter, Sixto Velez, Brett M Wolfe, Bryan K Wells, Joshua Wilson
Aircraft: QUEST AIRCRAFT COMPANY LLC KODIAK 100 (Category: Amphibian, Seats: 10, Weight: Up to 12,499 Pounds), Engine: P&W CANADA PT6A-34 (750 HP) (Turbo-prop) N-Number: 969TB, N969TB, N-969TB, Serial Number: 100-0173, Year manufactured: 2016, Airworthiness Date: 04/21/2016, Certificate Issue Date: 07/21/2016 Registrant (LLC): Pegasus Of Montana LLC, 564 Mulberry Rd, Williamstown, WV 26187 Deregistered:Cancel Date: 04/01/2019
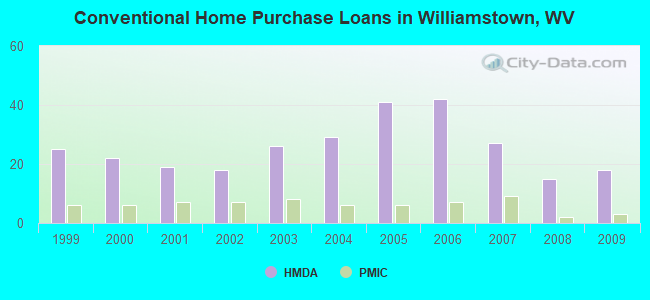
Home Mortgage Disclosure Act Aggregated Statistics For Year 2009 (Based on 1 partial tract)
A) FHA, FSA/RHS & VA Home Purchase Loans
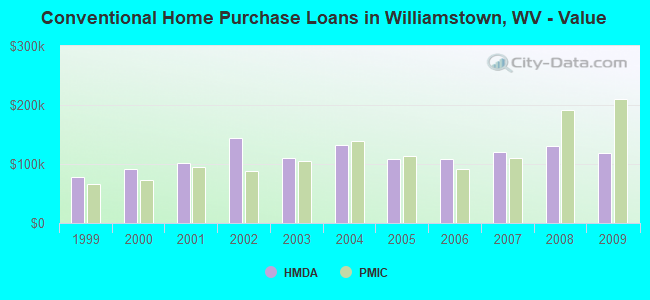
B) Conventional Home Purchase Loans
C) Refinancings
D) Home Improvement Loans
F) Non-occupant Loans on < 5 Family Dwellings (A B C & D)
G) Loans On Manufactured Home Dwelling (A B C & D)
Number
Average Value
Number
Average Value
Number
Average Value
Number
Average Value
Number
Average Value
Number
Average Value
LOANS ORIGINATED
7
$114,481
18
$119,071
45
$122,344
9
$8,326
2
$56,055
1
$1,140
APPLICATIONS APPROVED, NOT ACCEPTED
1
$63,490
0
$0
1
$118,400
0
$0
0
$0
0
$0
APPLICATIONS DENIED
1
$52,050
2
$69,210
10
$120,120
1
$14,870
2
$50,050
1
$5,150
APPLICATIONS WITHDRAWN
1
$97,810
2
$143,570
13
$129,492
0
$0
0
$0
0
$0
FILES CLOSED FOR INCOMPLETENESS
0
$0
0
$0
1
$38,900
0
$0
0
$0
0
$0
Aggregated Statistics For Year 2008 (Based on 1 partial tract)
A) FHA, FSA/RHS & VA Home Purchase Loans
B) Conventional Home Purchase Loans
C) Refinancings
D) Home Improvement Loans
F) Non-occupant Loans on < 5 Family Dwellings (A B C & D)
G) Loans On Manufactured Home Dwelling (A B C & D)
Number
Average Value
Number
Average Value
Number
Average Value
Number
Average Value
Number
Average Value
Number
Average Value
LOANS ORIGINATED
7
$102,306
15
$130,912
14
$140,099
8
$37,038
4
$68,498
1
$49,760
APPLICATIONS APPROVED, NOT ACCEPTED
0
$0
1
$54,340
2
$171,885
0
$0
0
$0
0
$0
APPLICATIONS DENIED
0
$0
3
$84,467
17
$100,840
3
$41,373
2
$77,505
1
$26,880
APPLICATIONS WITHDRAWN
0
$0
2
$54,910
7
$117,750
2
$18,590
1
$31,460
1
$4,000
FILES CLOSED FOR INCOMPLETENESS
0
$0
0
$0
1
$40,040
0
$0
1
$40,040
0
$0
Aggregated Statistics For Year 2007 (Based on 1 partial tract)
A) FHA, FSA/RHS & VA Home Purchase Loans
B) Conventional Home Purchase Loans
C) Refinancings
D) Home Improvement Loans
F) Non-occupant Loans on < 5 Family Dwellings (A B C & D)
G) Loans On Manufactured Home Dwelling (A B C & D)
Number
Average Value
Number
Average Value
Number
Average Value
Number
Average Value
Number
Average Value
Number
Average Value
LOANS ORIGINATED
2
$111,540
27
$119,802
21
$84,601
11
$33,592
3
$101,053
1
$4,580
APPLICATIONS APPROVED, NOT ACCEPTED
0
$0
0
$0
2
$212,210
0
$0
0
$0
0
$0
APPLICATIONS DENIED
2
$102,390
5
$72,530
25
$106,827
5
$30,088
0
$0
1
$24,600
APPLICATIONS WITHDRAWN
1
$29,170
2
$129,270
5
$94,494
2
$78,935
1
$38,900
1
$33,180
FILES CLOSED FOR INCOMPLETENESS
0
$0
2
$104,105
1
$187,040
0
$0
0
$0
0
$0
Aggregated Statistics For Year 2006 (Based on 1 partial tract)
A) FHA, FSA/RHS & VA Home Purchase Loans
B) Conventional Home Purchase Loans
C) Refinancings
D) Home Improvement Loans
F) Non-occupant Loans on < 5 Family Dwellings (A B C & D)
G) Loans On Manufactured Home Dwelling (A B C & D)
Number
Average Value
Number
Average Value
Number
Average Value
Number
Average Value
Number
Average Value
Number
Average Value
LOANS ORIGINATED
5
$102,616
42
$108,408
27
$92,494
11
$60,528
6
$55,388
1
$5,720
APPLICATIONS APPROVED, NOT ACCEPTED
0
$0
3
$66,543
7
$60,469
1
$44,040
0
$0
1
$48,050
APPLICATIONS DENIED
0
$0
2
$146,145
26
$109,010
6
$53,958
1
$134,420
1
$44,040
APPLICATIONS WITHDRAWN
1
$47,480
2
$139,280
11
$111,644
0
$0
1
$20,020
0
$0
FILES CLOSED FOR INCOMPLETENESS
0
$0
0
$0
2
$115,260
0
$0
0
$0
0
$0
Aggregated Statistics For Year 2005 (Based on 1 partial tract)
A) FHA, FSA/RHS & VA Home Purchase Loans
B) Conventional Home Purchase Loans
C) Refinancings
D) Home Improvement Loans
F) Non-occupant Loans on < 5 Family Dwellings (A B C & D)
G) Loans On Manufactured Home Dwelling (A B C & D)
Number
Average Value
Number
Average Value
Number
Average Value
Number
Average Value
Number
Average Value
Number
Average Value
LOANS ORIGINATED
2
$139,855
41
$108,136
27
$110,184
11
$23,972
9
$81,987
1
$17,160
APPLICATIONS APPROVED, NOT ACCEPTED
0
$0
6
$70,357
4
$78,650
1
$6,290
1
$49,190
1
$17,160
APPLICATIONS DENIED
0
$0
7
$74,360
21
$109,497
6
$56,628
1
$57,200
1
$26,880
APPLICATIONS WITHDRAWN
1
$100,100
6
$94,380
13
$83,864
1
$5,720
1
$62,920
1
$48,620
FILES CLOSED FOR INCOMPLETENESS
0
$0
2
$100,100
2
$91,520
1
$29,740
2
$51,195
0
$0
Aggregated Statistics For Year 2004 (Based on 1 partial tract)
A) FHA, FSA/RHS & VA Home Purchase Loans
B) Conventional Home Purchase Loans
C) Refinancings
D) Home Improvement Loans
F) Non-occupant Loans on < 5 Family Dwellings (A B C & D)
G) Loans On Manufactured Home Dwelling (A B C & D)
Number
Average Value
Number
Average Value
Number
Average Value
Number
Average Value
Number
Average Value
Number
Average Value
LOANS ORIGINATED
4
$93,665
29
$132,763
37
$96,591
5
$23,910
6
$84,083
2
$60,060
APPLICATIONS APPROVED, NOT ACCEPTED
0
$0
3
$183,420
6
$63,207
1
$11,440
1
$38,900
1
$31,460
APPLICATIONS DENIED
1
$93,240
4
$72,930
14
$72,849
4
$14,585
1
$28,600
1
$22,310
APPLICATIONS WITHDRAWN
0
$0
3
$112,873
9
$67,687
1
$10,300
2
$78,935
0
$0
FILES CLOSED FOR INCOMPLETENESS
1
$39,470
0
$0
0
$0
1
$11,440
0
$0
0
$0
Aggregated Statistics For Year 2003 (Based on 1 partial tract)
A) FHA, FSA/RHS & VA Home Purchase Loans
B) Conventional Home Purchase Loans
C) Refinancings
D) Home Improvement Loans
F) Non-occupant Loans on < 5 Family Dwellings (A B C & D)
Number
Average Value
Number
Average Value
Number
Average Value
Number
Average Value
Number
Average Value
LOANS ORIGINATED
3
$67,687
26
$110,748
85
$94,609
11
$18,928
7
$62,266
APPLICATIONS APPROVED, NOT ACCEPTED
1
$172,170
1
$128,700
6
$89,232
0
$0
0
$0
APPLICATIONS DENIED
2
$85,800
2
$41,470
19
$82,278
3
$6,863
0
$0
APPLICATIONS WITHDRAWN
0
$0
2
$149,580
13
$89,496
1
$6,860
1
$40,040
FILES CLOSED FOR INCOMPLETENESS
0
$0
0
$0
2
$88,090
0
$0
0
$0
Aggregated Statistics For Year 2002 (Based on 1 partial tract)
A) FHA, FSA/RHS & VA Home Purchase Loans
B) Conventional Home Purchase Loans
C) Refinancings
D) Home Improvement Loans
F) Non-occupant Loans on < 5 Family Dwellings (A B C & D)
Number
Average Value
Number
Average Value
Number
Average Value
Number
Average Value
Number
Average Value
LOANS ORIGINATED
2
$72,360
18
$144,621
64
$84,164
8
$6,578
7
$58,426
APPLICATIONS APPROVED, NOT ACCEPTED
1
$30,320
0
$0
10
$73,616
1
$14,300
1
$24,600
APPLICATIONS DENIED
1
$44,040
5
$56,972
22
$78,806
3
$4,003
2
$39,180
APPLICATIONS WITHDRAWN
1
$43,470
1
$136,140
15
$85,228
1
$13,730
1
$29,740
FILES CLOSED FOR INCOMPLETENESS
0
$0
0
$0
2
$84,085
0
$0
1
$34,890
Aggregated Statistics For Year 2001 (Based on 1 partial tract)
A) FHA, FSA/RHS & VA Home Purchase Loans
B) Conventional Home Purchase Loans
C) Refinancings
D) Home Improvement Loans
F) Non-occupant Loans on < 5 Family Dwellings (A B C & D)
Number
Average Value
Number
Average Value
Number
Average Value
Number
Average Value
Number
Average Value
LOANS ORIGINATED
3
$64,637
19
$101,846
49
$90,084
14
$9,887
5
$47,704
APPLICATIONS APPROVED, NOT ACCEPTED
0
$0
2
$65,210
3
$110,397
0
$0
0
$0
APPLICATIONS DENIED
2
$55,200
3
$56,057
19
$82,488
2
$11,155
1
$16,020
APPLICATIONS WITHDRAWN
1
$48,620
3
$55,483
7
$43,963
1
$18,300
0
$0
FILES CLOSED FOR INCOMPLETENESS
0
$0
0
$0
2
$113,255
0
$0
0
$0
Aggregated Statistics For Year 2000 (Based on 1 partial tract)
A) FHA, FSA/RHS & VA Home Purchase Loans
B) Conventional Home Purchase Loans
C) Refinancings
D) Home Improvement Loans
F) Non-occupant Loans on < 5 Family Dwellings (A B C & D)
Number
Average Value
Number
Average Value
Number
Average Value
Number
Average Value
Number
Average Value
LOANS ORIGINATED
2
$59,200
22
$91,806
25
$57,635
13
$11,176
4
$63,920
APPLICATIONS APPROVED, NOT ACCEPTED
0
$0
1
$15,440
7
$52,624
2
$25,740
0
$0
APPLICATIONS DENIED
1
$45,760
5
$33,976
20
$53,854
3
$28,980
1
$33,750
APPLICATIONS WITHDRAWN
1
$30,890
5
$63,836
15
$52,090
1
$16,020
0
$0
FILES CLOSED FOR INCOMPLETENESS
0
$0
0
$0
3
$72,263
0
$0
1
$49,190
Aggregated Statistics For Year 1999 (Based on 1 partial tract)
A) FHA, FSA/RHS & VA Home Purchase Loans
B) Conventional Home Purchase Loans
C) Refinancings
D) Home Improvement Loans
F) Non-occupant Loans on < 5 Family Dwellings (A B C & D)
Detailed PMIC statistics for the following Tracts:0102.00
2003 - 2018 National Fire Incident Reporting System (NFIRS) incidents
According to the data from the years 2003 - 2018 the average number of fires per year is 8. The highest number of reported fires - 16 took place in 2008, and the least - 2 in 2004. The data has a rising trend.
When looking into fire subcategories, the most incidents belonged to: Structure Fires (56.5%), and Mobile Property/Vehicle Fires (21.8%).
Fire incident types reported to NFIRS in Williamstown, WV


 Recent articles from our blog. Our writers, many of them Ph.D. graduates or candidates, create easy-to-read articles on a wide variety of topics.

 (73.3 miles


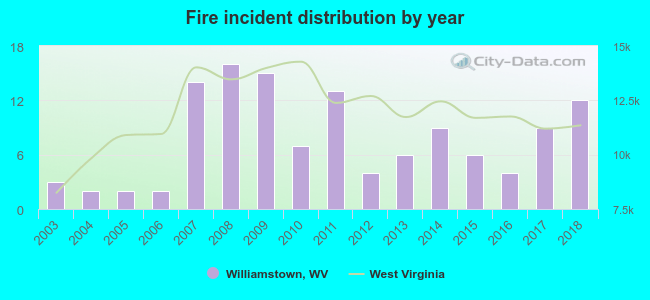 According to the data from the years 2003 - 2018 the average number of fires per year is 8. The highest number of reported fires - 16 took place in 2008, and the least - 2 in 2004. The data has a rising trend.
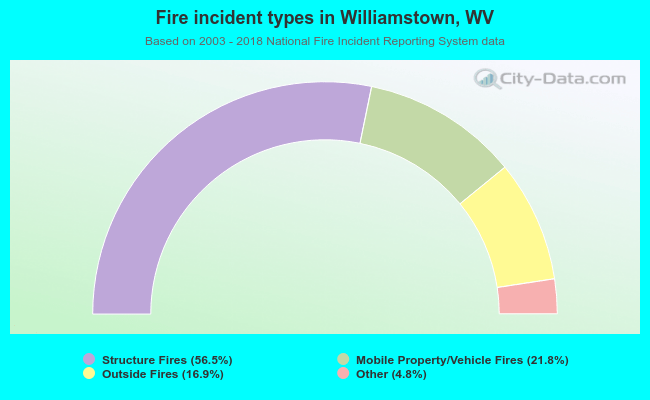 When looking into fire subcategories, the most incidents belonged to: Structure Fires (56.5%), and Mobile Property/Vehicle Fires (21.8%).