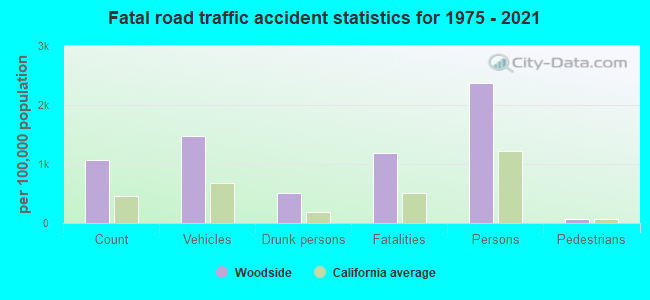
Woodside, California
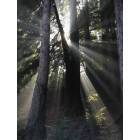
Woodside: Redwood Splendor
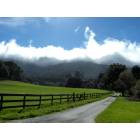
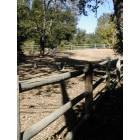
Woodside: country life

Woodside: Filoli gardens
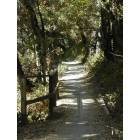
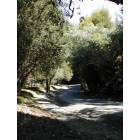
Woodside: Kings Mountain Road Trail
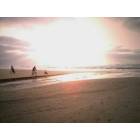
Woodside: Woodside
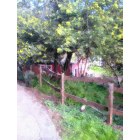
Woodside: country life
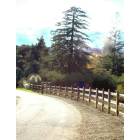
Woodside: Kings Mountain Road
Woodside: country life
Woodside: Kings Mountain Road
Woodside: One Store Town
- add
your
Submit your own pictures of this town and show them to the world
- OSM Map
- General Map
- Google Map
- MSN Map
Population change since 2000: -5.6%
 |
| Males: 2,311 | |
| Females: 2,742 |
| Median resident age: | 47.7 years |
| California median age: | 37.9 years |
Zip codes: 94062.
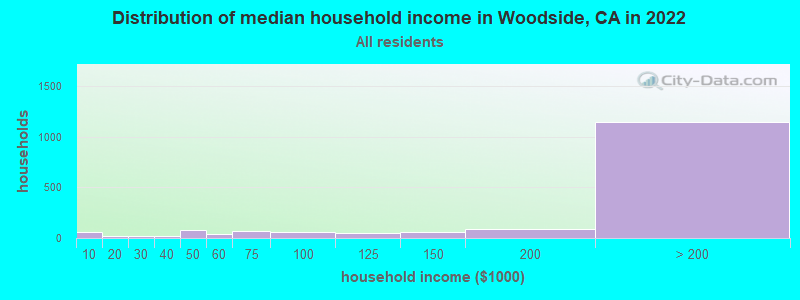
| Woodside: | over $200,000 |
| CA: | $91,551 |
Estimated per capita income in 2022: $150,775 (it was $104,667 in 2000)
Woodside town income, earnings, and wages data
Estimated median house or condo value in 2022: over $1,000,000 (it was over $1,000,000 in 2000)
| Woodside: | over $1,000,000 |
| CA: | $715,900 |
Mean prices in 2022: all housing units: over $1,000,000; detached houses: over $1,000,000; townhouses or other attached units: over $1,000,000
Median gross rent in 2022: $3,357.
(4.6% for White Non-Hispanic residents, 1.8% for Hispanic or Latino residents, 6.6% for other race residents, 10.7% for two or more races residents)
Detailed information about poverty and poor residents in Woodside, CA


Compare current foreclosures near Woodside, CA:
| Photo | Address | Area | Beds / Baths | Price | Details |
|---|---|---|---|---|---|

|
#1
Dewey Pl
Fremont, CA 94538
|
1,232 sq. feet
|
2 baths 3 beds |
show details | |

|
#2
Mulberry St
Newark, CA 94560
|
984 sq. feet
|
1 baths 3 beds |
show details | |

|
#3
Chestnut St
San Carlos, CA 94070
|
1,390 sq. feet
|
2 baths 3 beds |
show details | |

|
#4
S Humboldt St
San Mateo, CA 94401
|
1,290 sq. feet
|
2 baths 3 beds |
show details | |

|
#5
Toyonita Rd
Los Altos, CA 94024
|
4,833 sq. feet
|
3 baths 5 beds |
show details | |

|
#6
7th Ave
Menlo Park, CA 94025
|
1,689 sq. feet
|
2 baths 3 beds |
show details | |

|
#7
Cavanaugh St
San Mateo, CA 94401
|
- sq. feet
|
1 baths 2 beds |
show details | |

|
#8
Saratoga Ave
Palo Alto, CA 94303
|
750 sq. feet
|
1 baths 3 beds |
show details | |

|
#9
Euclid Ave
Palo Alto, CA 94303
|
1,600 sq. feet
|
2 baths 4 beds |
show details | |

|
#10
Alameda De Las Pulgas
Redwood City, CA 94061
|
1,250 sq. feet
|
2 baths 3 beds |
show details |
| Photo | Address | Area | Beds / Baths | Price | Details |
|---|---|---|---|---|---|

|
#11
Mirada Rd
Half Moon Bay, CA 94019
|
2,450 sq. feet
|
4 baths 4 beds |
show details | |

|
#12
Hempstead Pl
Redwood City, CA 94061
|
1,020 sq. feet
|
1 baths 3 beds |
show details | |

|
#13
Pullman Ave
Half Moon Bay, CA 94019
|
2,036 sq. feet
|
2 baths 3 beds |
show details | |

|
#14
S Humboldt St
San Mateo, CA 94401
|
1,290 sq. feet
|
2 baths 3 beds |
show details | |

|
#15
Park Rd Apt 503
Burlingame, CA 94010
|
1,740 sq. feet
|
2 baths 2 beds |
show details | |

|
#16
Cottage Grove Ave
San Mateo, CA 94401
|
1,360 sq. feet
|
1 baths 3 beds |
show details | |

|
#17
Newbridge Ave
San Mateo, CA 94401
|
1,300 sq. feet
|
2 baths 3 beds |
show details | |

|
#18
S Norfolk St Apt 221
San Mateo, CA 94401
|
729 sq. feet
|
1 baths 1 beds |
show details | |

|
#19
Cabral Dr
Fremont, CA 94536
|
1,150 sq. feet
|
2 baths 3 beds |
show details | |

|
#20
Lindbergh St
San Mateo, CA 94401
|
970 sq. feet
|
1 baths 3 beds |
show details |
| Photo | Address | Area | Beds / Baths | Price | Details |
|---|---|---|---|---|---|

|
#21
Shinglewood 10
Union City, CA 94587
|
1,675 sq. feet
|
2 baths 2 beds |
show details | |

|
#22
Oak Valley Rd
Cupertino, CA 95014
|
3,350 sq. feet
|
3 baths 5 beds |
show details | |

|
#23
Lorton Ave Apt 103
Burlingame, CA 94010
|
1,320 sq. feet
|
2 baths 2 beds |
show details | |

|
#24
Dorchester Rd
San Mateo, CA 94402
|
3,190 sq. feet
|
2 baths 3 beds |
show details | |

|
#25
Prague St
San Mateo, CA 94401
|
1,430 sq. feet
|
2 baths 3 beds |
show details | |

|
#26
Woodside Way Apt 230
San Mateo, CA 94401
|
687 sq. feet
|
1 baths 1 beds |
show details | |

|
#27
Granville Dr
Fremont, CA 94536
|
1,771 sq. feet
|
2 baths 3 beds |
show details | |

|
#28
Patrol Rd
Redwood City, CA 94062
|
2,740 sq. feet
|
3 baths 4 beds |
show details | |

|
#29
Smith St
Union City, CA 94587
|
1,698 sq. feet
|
2 baths 2 beds |
show details | |

|
#30
Francis Ave
Santa Clara, CA 95051
|
1,383 sq. feet
|
2 baths 4 beds |
show details |
| Photo | Address | Area | Beds / Baths | Price | Details |
|---|---|---|---|---|---|

|
#31
Bowers Ave
Santa Clara, CA 95051
|
1,158 sq. feet
|
2 baths 4 beds |
show details | |

|
#32
Milton Ter
Fremont, CA 94555
|
985 sq. feet
|
2 baths 2 beds |
show details | |

|
#33
Helm Ln
San Mateo, CA 94404
|
1,530 sq. feet
|
2 baths 3 beds |
show details | |

|
#34
Phoenix Ln
San Mateo, CA 94404
|
1,603 sq. feet
|
2 baths 2 beds |
show details | |

|
#35
Cabot Ln
San Mateo, CA 94404
|
1,380 sq. feet
|
2 baths 3 beds |
show details | |

|
#36
Cabot Ln
San Mateo, CA 94404
|
1,380 sq. feet
|
2 baths 3 beds |
show details | |

|
#37
Ridgewood Dr
Fremont, CA 94555
|
1,655 sq. feet
|
2 baths 2 beds |
show details | |

|
#38
Sandcreek Dr
Hayward, CA 94545
|
2,600 sq. feet
|
3 baths 5 beds |
show details | |

|
#39
Pinehurst Ln
Half Moon Bay, CA 94019
|
2,230 sq. feet
|
3 baths 3 beds |
show details | |

|
#40
Butcher Dr
Santa Clara, CA 95051
|
1,166 sq. feet
|
2 baths 3 beds |
show details |
| Photo | Address | Area | Beds / Baths | Price | Details |
|---|---|---|---|---|---|

|
#41
Hamlet St
San Mateo, CA 94403
|
1,580 sq. feet
|
2 baths 3 beds |
show details | |

|
#42
Niantic Dr
San Mateo, CA 94404
|
1,780 sq. feet
|
2 baths 4 beds |
show details | |

|
#43
Snake River Pl
Fremont, CA 94555
|
1,476 sq. feet
|
2 baths 4 beds |
show details | |

|
#44
Benton St
Santa Clara, CA 95051
|
1,564 sq. feet
|
2 baths 4 beds |
show details | |

|
#45
Grebe St
San Mateo, CA 94404
|
980 sq. feet
|
1 baths 2 beds |
show details | |

|
#46
Pomeroy Ave
Santa Clara, CA 95051
|
1,564 sq. feet
|
2 baths 4 beds |
show details | |

|
#47
Great Salt Lake Dr
Fremont, CA 94555
|
1,629 sq. feet
|
2 baths 3 beds |
show details | |

|
#48
Woodcrest Ct
Burlingame, CA 94010
|
4,720 sq. feet
|
4 baths 5 beds |
show details | |

|
#49
Granville Dr
Fremont, CA 94536
|
1,242 sq. feet
|
2 baths 3 beds |
show details | |

|
Check over 1 million property listings on Foreclosure.com!
|
browse all offers | |||


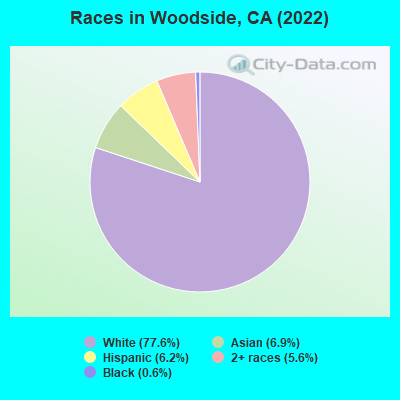
- 3,94277.6%White alone
- 3536.9%Asian alone
- 3156.2%Hispanic
- 2825.6%Two or more races
- 280.6%Black alone
 Recent articles from our blog. Our writers, many of them Ph.D. graduates or candidates, create easy-to-read articles on a wide variety of topics.


Latest news from Woodside, CA collected exclusively by city-data.com from local newspapers, TV, and radio stations
Ancestries: American (10.8%), English (8.7%), German (8.3%), European (7.7%), Italian (6.5%), Northern European (4.0%).
Current Local Time: PST time zone
Incorporated on 11/16/1956
Elevation: 380 feet
Land area: 11.8 square miles.
Population density: 430 people per square mile (low).
760 residents are foreign born (6.6% Asia, 4.0% Europe, 2.3% Latin America).
| This town: | 15.0% |
| California: | 26.5% |
Median real estate property taxes paid for housing units with mortgages in 2022: $10,118 (0.5%)
Median real estate property taxes paid for housing units with no mortgage in 2022: $10,893 (0.5%)
Nearest city with pop. 50,000+: Redwood City, CA  (4.5 miles , pop. 75,402).
Nearest city with pop. 200,000+: Fremont, CA (17.4 miles , pop. 203,413).
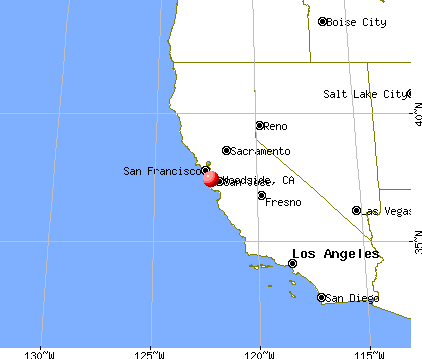
Nearest city with pop. 1,000,000+: Los Angeles, CA (317.3 miles , pop. 3,694,820).
Nearest cities:
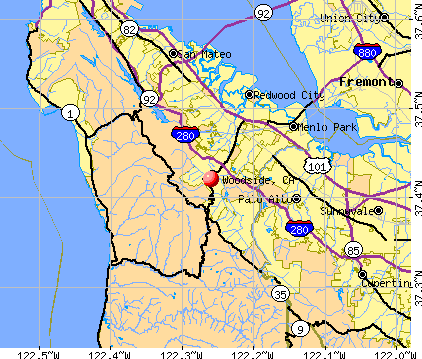
), ), ), ), Latitude: 37.42 N, Longitude: 122.26 W
Area code: 650

Property values in Woodside, CA
Woodside tourist attractions:
Woodside, California accommodation & food services, waste management - Economy and Business Data
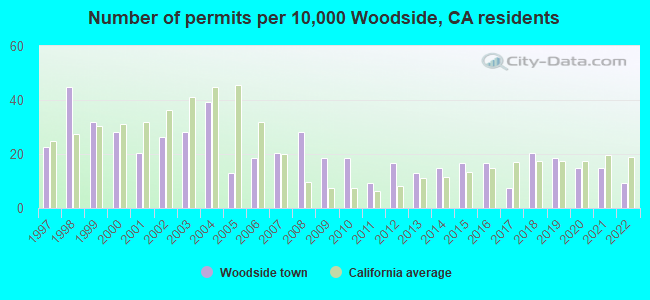
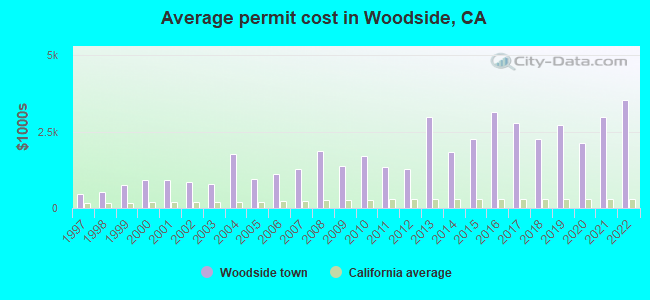
Single-family new house construction building permits:
- 2022: 5 buildings, average cost: $3,532,600
- 2021: 8 buildings, average cost: $2,977,300
- 2020: 8 buildings, average cost: $2,110,300
- 2019: 10 buildings, average cost: $2,728,000
- 2018: 11 buildings, average cost: $2,243,800
- 2017: 4 buildings, average cost: $2,770,700
- 2016: 9 buildings, average cost: $3,124,400
- 2015: 9 buildings, average cost: $2,264,100
- 2014: 8 buildings, average cost: $1,824,500
- 2013: 7 buildings, average cost: $2,959,700
- 2012: 9 buildings, average cost: $1,269,700
- 2011: 5 buildings, average cost: $1,344,700
- 2010: 10 buildings, average cost: $1,701,300
- 2009: 10 buildings, average cost: $1,358,000
- 2008: 15 buildings, average cost: $1,876,900
- 2007: 11 buildings, average cost: $1,276,500
- 2006: 10 buildings, average cost: $1,095,500
- 2005: 7 buildings, average cost: $949,700
- 2004: 21 buildings, average cost: $1,752,000
- 2003: 15 buildings, average cost: $780,200
- 2002: 14 buildings, average cost: $854,000
- 2001: 11 buildings, average cost: $910,900
- 2000: 15 buildings, average cost: $913,400
- 1999: 17 buildings, average cost: $737,400
- 1998: 24 buildings, average cost: $507,500
- 1997: 12 buildings, average cost: $462,000
| Here: | 3.2% |
| California: | 5.1% |
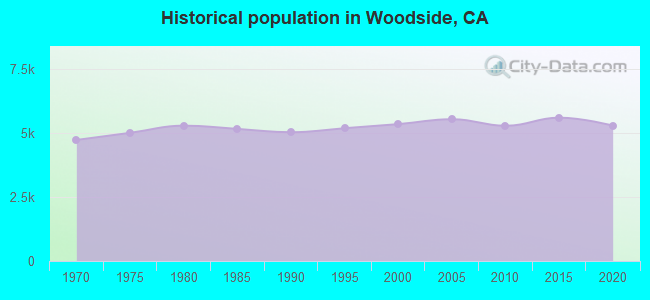
Population change in the 1990s: +84 (+1.6%).
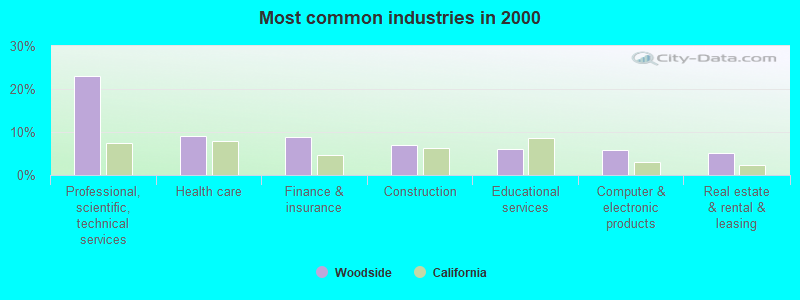
- Professional, scientific, technical services (22.9%)
- Health care (9.1%)
- Finance & insurance (8.8%)
- Construction (7.1%)
- Educational services (6.1%)
- Computer & electronic products (5.8%)
- Real estate & rental & leasing (5.1%)
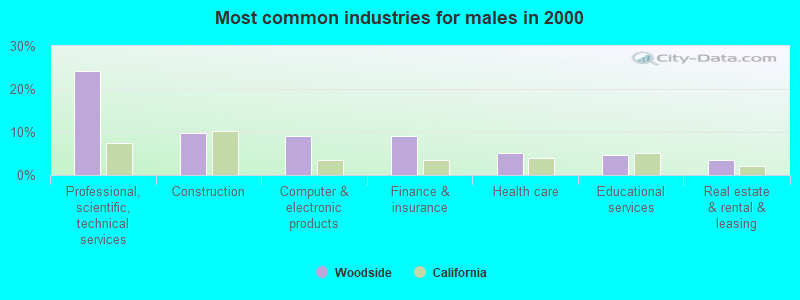
- Professional, scientific, technical services (24.3%)
- Construction (9.7%)
- Computer & electronic products (9.0%)
- Finance & insurance (9.0%)
- Health care (5.2%)
- Educational services (4.7%)
- Real estate & rental & leasing (3.5%)
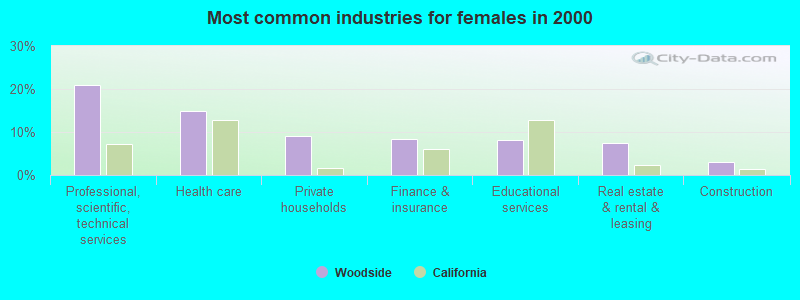
- Professional, scientific, technical services (21.0%)
- Health care (14.8%)
- Private households (9.2%)
- Finance & insurance (8.5%)
- Educational services (8.2%)
- Real estate & rental & leasing (7.4%)
- Construction (3.1%)
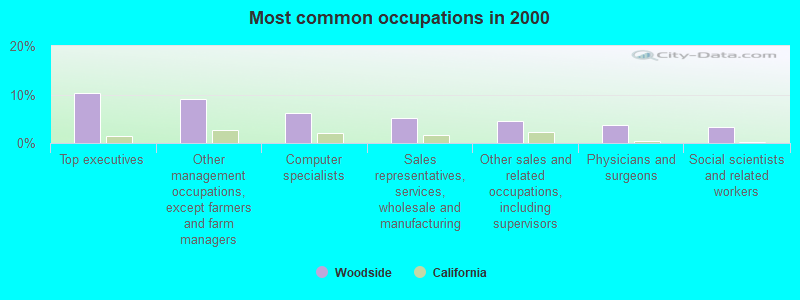
- Top executives (10.3%)
- Other management occupations, except farmers and farm managers (9.1%)
- Computer specialists (6.3%)
- Sales representatives, services, wholesale and manufacturing (5.2%)
- Other sales and related occupations, including supervisors (4.5%)
- Physicians and surgeons (3.8%)
- Social scientists and related workers (3.3%)
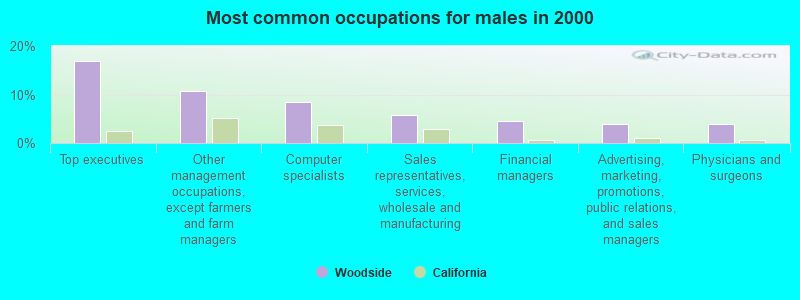
- Top executives (16.9%)
- Other management occupations, except farmers and farm managers (10.8%)
- Computer specialists (8.5%)
- Sales representatives, services, wholesale and manufacturing (5.8%)
- Financial managers (4.5%)
- Advertising, marketing, promotions, public relations, and sales managers (3.8%)
- Physicians and surgeons (3.8%)
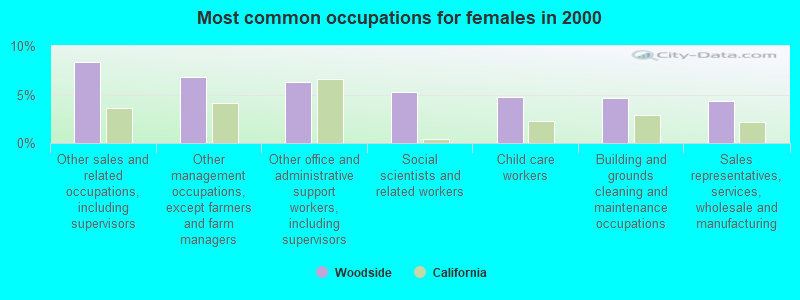
- Other sales and related occupations, including supervisors (8.4%)
- Other management occupations, except farmers and farm managers (6.8%)
- Other office and administrative support workers, including supervisors (6.3%)
- Social scientists and related workers (5.2%)
- Child care workers (4.7%)
- Building and grounds cleaning and maintenance occupations (4.6%)
- Sales representatives, services, wholesale and manufacturing (4.3%)
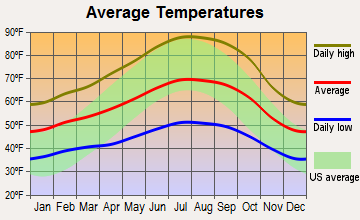
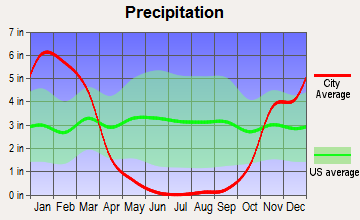
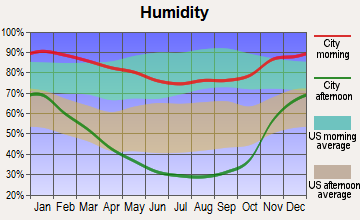
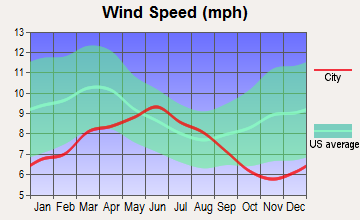
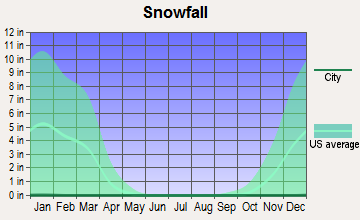
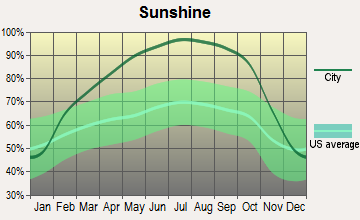
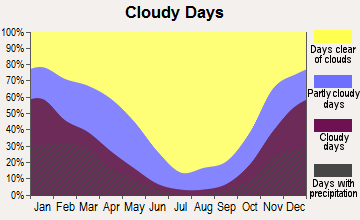
Average climate in Woodside, California
Based on data reported by over 4,000 weather stations
|
|

(lower is better)

Air Quality Index (AQI) level in 2023 was 66.4. This is about average.
| City: | 66.4 |
| U.S.: | 72.6 |
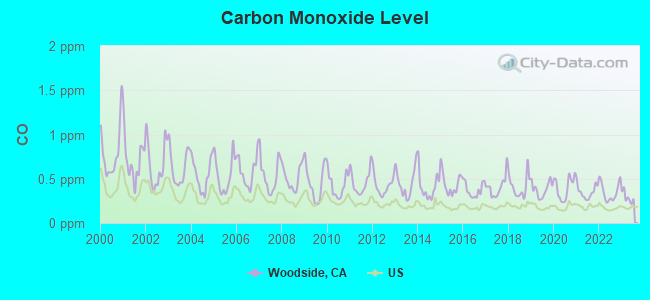
Carbon Monoxide (CO) [ppm] level in 2023 was 0.292. This is about average. Closest monitor was 5.3 miles away from the city center.
| City: | 0.292 |
| U.S.: | 0.251 |
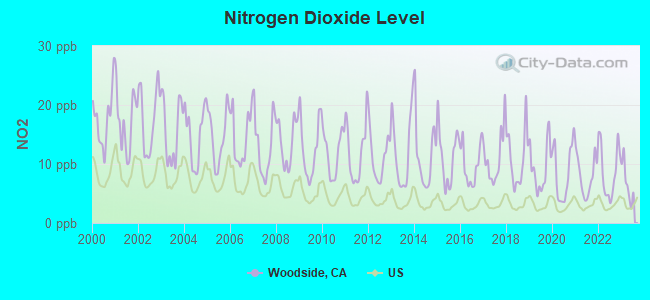
Nitrogen Dioxide (NO2) [ppb] level in 2023 was 6.82. This is worse than average. Closest monitor was 5.3 miles away from the city center.
| City: | 6.82 |
| U.S.: | 5.11 |

Sulfur Dioxide (SO2) [ppb] level in 2023 was 0.0660. This is significantly better than average. Closest monitor was 12.6 miles away from the city center.
| City: | 0.0660 |
| U.S.: | 1.5147 |
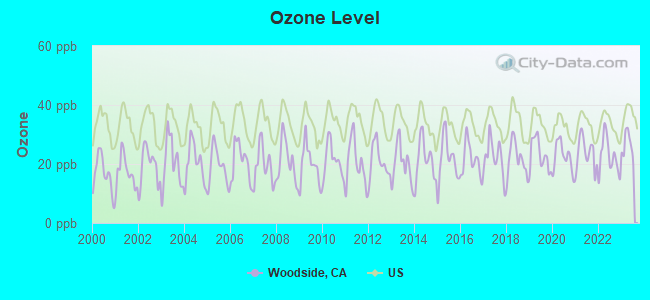
Ozone [ppb] level in 2023 was 26.4. This is better than average. Closest monitor was 5.3 miles away from the city center.
| City: | 26.4 |
| U.S.: | 33.3 |
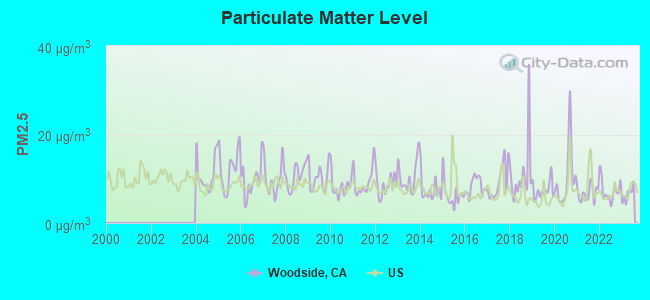
Particulate Matter (PM2.5) [µg/m3] level in 2023 was 6.46. This is better than average. Closest monitor was 5.3 miles away from the city center.
| City: | 6.46 |
| U.S.: | 8.11 |
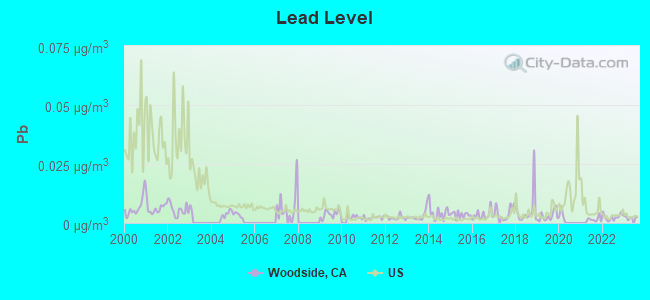
Lead (Pb) [µg/m3] level in 2023 was 0.00228. This is significantly better than average. Closest monitor was 5.3 miles away from the city center.
| City: | 0.00228 |
| U.S.: | 0.00931 |
Earthquake activity:
Woodside-area historical earthquake activity is significantly above California state average. It is 7398% greater than the overall U.S. average.On 4/18/1906 at 13:12:21, a magnitude 7.9 (7.9 UK, Class: Major, Intensity: VIII - XII) earthquake occurred 57.0 miles away from Woodside center, causing $524,000,000 total damage
On 10/18/1989 at 00:04:15, a magnitude 7.1 (6.5 MB, 7.1 MS, 6.9 MW, 7.0 ML) earthquake occurred 34.5 miles away from Woodside center, causing 62 deaths (62 shaking deaths) and 3757 injuries, causing $1,305,032,704 total damage
On 11/4/1927 at 13:51:53, a magnitude 7.5 (7.5 UK) earthquake occurred 186.4 miles away from Woodside center
On 7/21/1952 at 11:52:14, a magnitude 7.7 (7.7 UK) earthquake occurred 247.2 miles away from the city center, causing $50,000,000 total damage
On 1/31/1922 at 13:17:28, a magnitude 7.6 (7.6 UK) earthquake occurred 287.6 miles away from Woodside center
On 4/25/1992 at 18:06:04, a magnitude 7.2 (6.3 MB, 7.1 MS, 7.2 MW, 7.1 MW, Depth: 9.4 mi) earthquake occurred 224.8 miles away from the city center, causing $75,000,000 total damage
Magnitude types: body-wave magnitude (MB), local magnitude (ML), surface-wave magnitude (MS), moment magnitude (MW)
Natural disasters:
The number of natural disasters in San Mateo County (18) is near the US average (15).Major Disasters (Presidential) Declared: 11
Emergencies Declared: 2
Causes of natural disasters: Floods: 11, Storms: 6, Mudslides: 5, Winter Storms: 5, Landslides: 4, Fires: 2, Drought: 1, Earthquake: 1, Freeze: 1, Hurricane: 1, Tornado: 1, Other: 1 (Note: some incidents may be assigned to more than one category).
Hospitals and medical centers near Woodside:
- DEVONSHIRE OAKS NURSING CENTER (Nursing Home, about 4 miles away; REDWOOD CITY, CA)
- UNIVERSITY CONVALESCENT HOSP (Nursing Home, about 4 miles away; MENLO PARK, CA)
- LAUREL GLEN CONVALESCENT HOSPITAL (Nursing Home, about 4 miles away; REDWOOD CITY, CA)
- WOODSIDE WOMENS HOSPITAL (Hospital, about 4 miles away; REDWOOD CITY, CA)
- SEQUOIAS, THE (Nursing Home, about 4 miles away; PORTOLA VALLEY, CA)
- ELLIPSE (Nursing Home, about 4 miles away; REDWOOD CITY, CA)
- CORDILLERAS MENTAL HEALTH CENTER (Nursing Home, about 4 miles away; REDWOOD CITY, CA)
Amtrak stations near Woodside:
- 15 miles: MILLBRAE (MILLBRAE AVE. & CALIFORNIA DR.) - Bus Station . Services: fully wheelchair accessible, public payphones, free short-term parking, call for taxi service, public transit connection.
- 16 miles: SAN FRANCISCO INT'L AIRPO (SAN BRUNO, SAN FRANCISCO INTERNATIONAL AIRPORT) - Bus Station . Services: fully wheelchair accessible, enclosed waiting area, public restrooms, public payphones, snack bar, paid short-term parking, paid long-term parking, car rental agency, taxi stand, public transit connection.
- 17 miles: FREMONT (CENTERVILLE, FREMONT & PERALTA BLVDS.) . Services: fully wheelchair accessible, enclosed waiting area, public restrooms, public payphones, snack bar, free short-term parking, free long-term parking, call for car rental service, call for taxi service, public transit connection.
Colleges/universities with over 2000 students nearest to Woodside:
- Canada College (about 2 miles; Redwood City, CA; Full-time enrollment: 3,446)
- Stanford University (about 5 miles; Stanford, CA; FT enrollment: 14,410)
- Foothill College (about 9 miles; Los Altos Hills, CA; FT enrollment: 9,635)
- College of San Mateo (about 9 miles; San Mateo, CA; FT enrollment: 5,398)
- De Anza College (about 14 miles; Cupertino, CA; FT enrollment: 16,729)
- Mission College (about 16 miles; Santa Clara, CA; FT enrollment: 5,625)
- Chabot College (about 18 miles; Hayward, CA; FT enrollment: 7,610)
Public high school in Woodside:
- WOODSIDE HIGH (Students: 1,274, Location: 199 CHURCHILL AVE., Grades: 9-12)
Public elementary/middle school in Woodside:
- WOODSIDE ELEMENTARY (Students: 355, Location: 3195 WOODSIDE RD., Grades: KG-8)
User-submitted facts and corrections:
- Shirley Temple currently lives here.
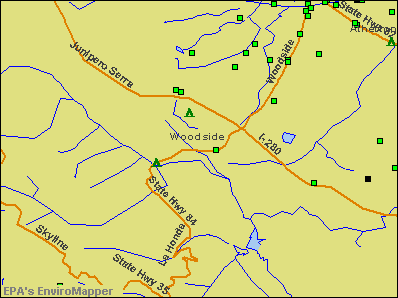
Points of interest:
Notable locations in Woodside: Old Woodside Store (A), Menlo Country Club (B), Woodside City Hall (C), Woodside Branch San Mateo County Library (D), Woodside Fire Protection District Station 7 (E). Display/hide their locations on the map
Lake: Schilling Lake (A). Display/hide its location on the map
Creeks: Martin Creek (A), Sausal Creek (B), Alambique Creek (C). Display/hide their locations on the map
Parks in Woodside include: Searsville Historical Marker (1), Teague Hill Open Space Preserve (2), Thornewood Open Space Preserve (3). Display/hide their locations on the map
Birthplace of: Jason Norman - College basketball player (Harvard Crimson), Paul Jefferson - Country singer.
Drinking water stations with addresses in Woodside and their reported violations in the past:
LA HONDA CENTER (Population served: 25, Groundwater):Past monitoring violations:
- One routine major monitoring violation
- 2 regular monitoring violations
| This town: | 2.7 people |
| California: | 2.9 people |
| This town: | 75.2% |
| Whole state: | 68.7% |
| This town: | 3.7% |
| Whole state: | 7.2% |
Likely homosexual households (counted as self-reported same-sex unmarried-partner households)
- Lesbian couples: 0.4% of all households
- Gay men: 0.6% of all households
Banks with branches in Woodside (2011 data):
- Wells Fargo Bank, National Association: Whiskey Hill Road Branch at 2925 Woodside Road, branch established on 1966/11/07. Info updated 2011/04/05: Bank assets: $1,161,490.0 mil, Deposits: $905,653.0 mil, headquarters in Sioux Falls, SD, positive income, 6395 total offices, Holding Company: Wells Fargo & Company
For population 15 years and over in Woodside:
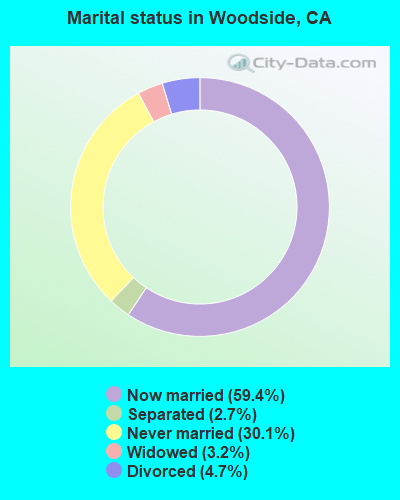
- Never married: 30.1%
- Now married: 59.4%
- Separated: 2.7%
- Widowed: 3.2%
- Divorced: 4.7%
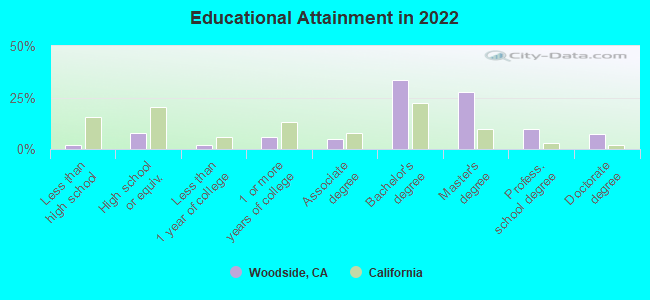
For population 25 years and over in Woodside:
- High school or higher: 98.3%
- Bachelor's degree or higher: 76.3%
- Graduate or professional degree: 41.7%
- Unemployed: 1.2%
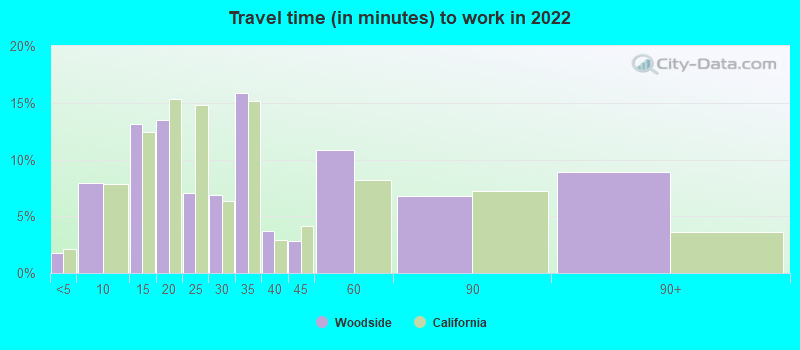
- Mean travel time to work (commute): 15.5 minutes
| Here: | 8.9 |
| California average: | 15.5 |
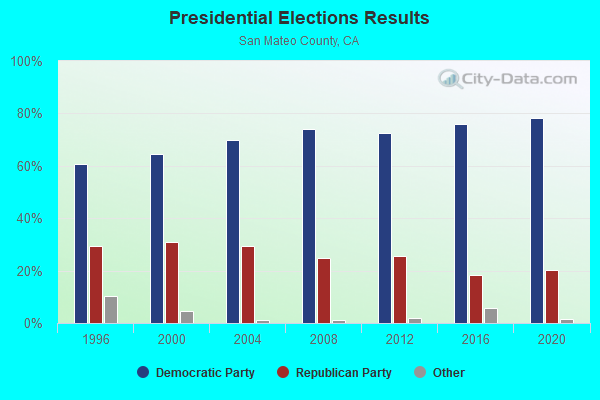
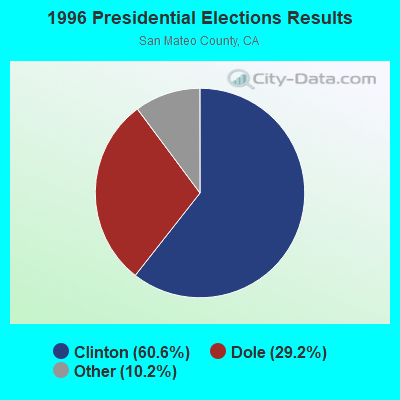
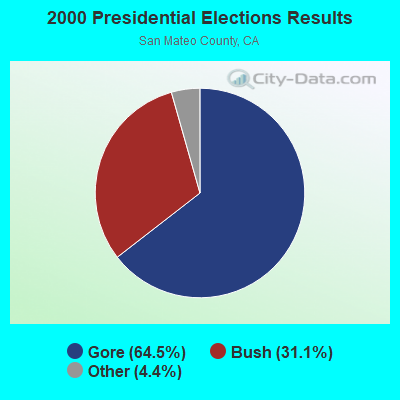
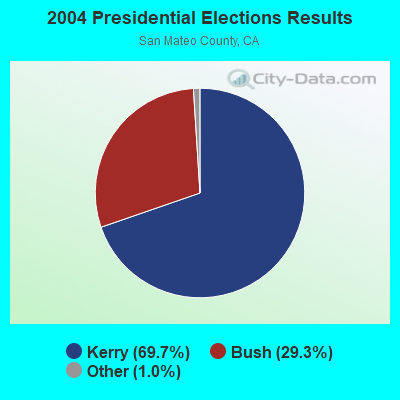

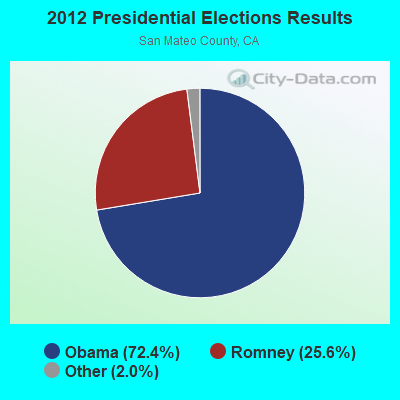
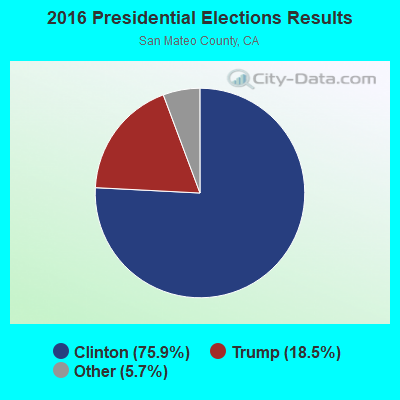
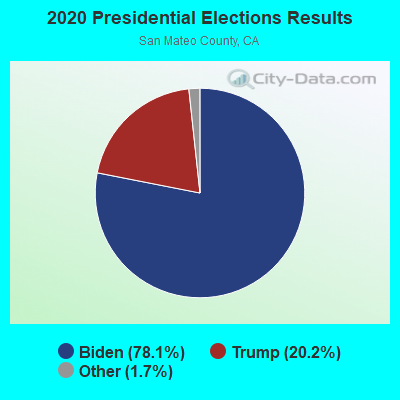
Graphs represent county-level data. Detailed 2008 Election Results
Religion statistics for Woodside, CA (based on San Mateo County data)
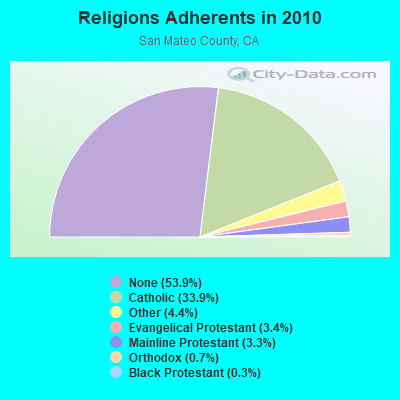
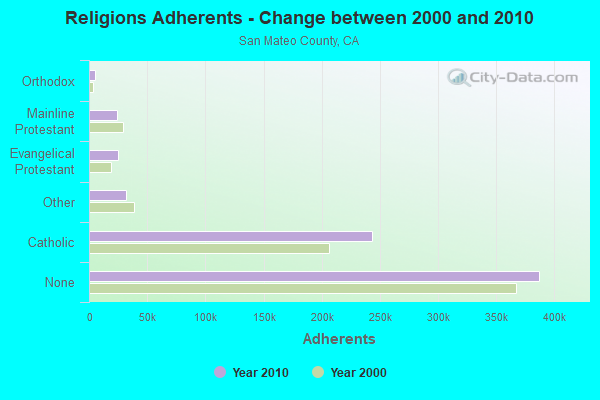
| Religion | Adherents | Congregations |
|---|---|---|
| Catholic | 243,634 | 22 |
| Other | 31,697 | 78 |
| Evangelical Protestant | 24,771 | 166 |
| Mainline Protestant | 23,840 | 74 |
| Orthodox | 5,350 | 5 |
| Black Protestant | 2,046 | 12 |
| None | 387,113 | - |
Food Environment Statistics:
| Here: | 2.44 / 10,000 pop. |
| California: | 2.14 / 10,000 pop. |
| San Mateo County: | 0.06 / 10,000 pop. |
| California: | 0.04 / 10,000 pop. |
| This county: | 0.56 / 10,000 pop. |
| California: | 0.62 / 10,000 pop. |
| This county: | 1.62 / 10,000 pop. |
| State: | 1.49 / 10,000 pop. |
| San Mateo County: | 10.02 / 10,000 pop. |
| California: | 7.42 / 10,000 pop. |
| Here: | 7.1% |
| California: | 7.3% |
| San Mateo County: | 16.9% |
| State: | 21.3% |
| San Mateo County: | 18.0% |
| California: | 17.9% |
Health and Nutrition:
| Woodside: | 55.8% |
| California: | 49.4% |
| Woodside: | 54.3% |
| California: | 48.0% |
| Woodside: | 27.9 |
| California: | 28.1 |
| Here: | 19.1% |
| State: | 20.2% |
| This city: | 8.2% |
| State: | 11.2% |
| Woodside: | 7.0 |
| California: | 6.8 |
| Woodside: | 34.9% |
| California: | 31.5% |
| Woodside: | 60.1% |
| California: | 56.4% |
| This city: | 78.9% |
| State: | 80.9% |
More about Health and Nutrition of Woodside, CA Residents
| Local government employment and payroll (March 2022) | |||||
| Function | Full-time employees | Monthly full-time payroll | Average yearly full-time wage | Part-time employees | Monthly part-time payroll |
|---|---|---|---|---|---|
| Other Government Administration | 12 | $127,172 | $127,172 | 0 | $0 |
| Other and Unallocable | 7 | $61,466 | $105,370 | 0 | $0 |
| Financial Administration | 3 | $27,383 | $109,532 | 0 | $0 |
| Totals for Government | 22 | $216,021 | $117,830 | 0 | $0 |
Woodside government finances - Expenditure in 2017 (per resident):
- Construction - Regular Highways: $504,000 ($99.74)
Central Staff Services: $391,000 ($77.38)
- Current Operations - Central Staff Services: $2,960,000 ($585.79)
Protective Inspection and Regulation - Other: $1,708,000 ($338.02)
Police Protection: $1,652,000 ($326.93)
Financial Administration: $715,000 ($141.50)
Regular Highways: $681,000 ($134.77)
Parks and Recreation: $336,000 ($66.50)
Sewerage: $209,000 ($41.36)
General - Other: $184,000 ($36.41)
Libraries: $105,000 ($20.78)
Health - Other: $60,000 ($11.87)
- General - Interest on Debt: $29,000 ($5.74)
Woodside government finances - Revenue in 2017 (per resident):
- Charges - Other: $1,056,000 ($208.98)
Sewerage: $517,000 ($102.32)
Parks and Recreation: $166,000 ($32.85)
- Local Intergovernmental - Sewerage: $6,000 ($1.19)
- Miscellaneous - Interest Earnings: $50,000 ($9.90)
Fines and Forfeits: $25,000 ($4.95)
General Revenue - Other: $12,000 ($2.37)
Rents: $5,000 ($0.99)
- State Intergovernmental - Other: $158,000 ($31.27)
Highways: $116,000 ($22.96)
General Local Government Support: $18,000 ($3.56)
- Tax - Property: $4,461,000 ($882.84)
General Sales and Gross Receipts: $1,003,000 ($198.50)
Other License: $539,000 ($106.67)
Public Utilities Sales: $475,000 ($94.00)
Other: $419,000 ($82.92)
Documentary and Stock Transfer: $160,000 ($31.66)
Occupation and Business License - Other: $157,000 ($31.07)
Woodside government finances - Debt in 2017 (per resident):
- Long Term Debt - Beginning Outstanding - Unspecified Public Purpose: $727,000 ($143.87)
Outstanding Unspecified Public Purpose: $642,000 ($127.05)
Retired Unspecified Public Purpose: $85,000 ($16.82)
Woodside government finances - Cash and Securities in 2017 (per resident):
- Bond Funds - Cash and Securities: $208,000 ($41.16)
- Other Funds - Cash and Securities: $9,752,000 ($1929.94)
6.99% of this county's 2021 resident taxpayers lived in other counties in 2020 ($178,839 average adjusted gross income)
| Here: | 6.99% |
| California average: | 5.19% |
0.01% of residents moved from foreign countries ($58 average AGI)
San Mateo County: 0.01% California average: 0.03%
Top counties from which taxpayers relocated into this county between 2020 and 2021:
| from San Francisco County, CA | |
| from Santa Clara County, CA | |
| from Alameda County, CA |
9.90% of this county's 2020 resident taxpayers moved to other counties in 2021 ($222,747 average adjusted gross income)
| Here: | 9.90% |
| California average: | 6.14% |
0.01% of residents moved to foreign countries ($372 average AGI)
San Mateo County: 0.01% California average: 0.02%
Top counties to which taxpayers relocated from this county between 2020 and 2021:
| to Santa Clara County, CA | |
| to San Francisco County, CA | |
| to Alameda County, CA |
Businesses in Woodside, CA
- FedEx: 3
- UPS: 1
Strongest AM radio stations in Woodside:
- KNBR (680 AM; 50 kW; SAN FRANCISCO, CA; Owner: KNBR LICO, INC.)
- KYCY (1550 AM; 50 kW; SAN FRANCISCO, CA; Owner: INFINITY BROADCASTING OPERATIONS, INC.)
- KGO (810 AM; 50 kW; SAN FRANCISCO, CA; Owner: KGO-AM RADIO, INC.)
- KTCT (1050 AM; 50 kW; SAN MATEO, CA; Owner: SUSQUEHANNA RADIO CORP.)
- KFAX (1100 AM; 50 kW; SAN FRANCISCO, CA; Owner: GOLDEN GATE BROADCASTING CO, INC.)
- KTRB (860 AM; 50 kW; MODESTO, CA; Owner: PAPPAS RADIO OF CALIFORNIA, A CALIFORNIA LIMITED PARTNERSHIP)
- KLOK (1170 AM; 50 kW; SAN JOSE, CA; Owner: ENTRAVISION HOLDINGS, LLC)
- KSFB (1220 AM; 5 kW; PALO ALTO, CA; Owner: SCA-PALO ALTO, LLC)
- KIQI (1010 AM; 35 kW; SAN FRANCISCO, CA; Owner: RADIO UNICA OF SAN FRANCISCO LICENSE CORP.)
- KCBS (740 AM; 50 kW; SAN FRANCISCO, CA; Owner: INFINITY BROADCASTING OPERATIONS, INC.)
- KNEW (910 AM; 20 kW; OAKLAND, CA; Owner: AMFM RADIO LICENSES, L.L.C.)
- KSFO (560 AM; 5 kW; SAN FRANCISCO, CA; Owner: KGO-AM RADIO, INC.)
- KSJX (1500 AM; 10 kW; SAN JOSE, CA; Owner: MULTICULTURAL RADIO BROADCASTING INC)
Strongest FM radio stations in Woodside:
- KFJC (89.7 FM; LOS ALTOS, CA; Owner: FOOTHILL-DE ANZA COMM. COLLEGE DIST.)
- KCEA (89.1 FM; ATHERTON, CA; Owner: MENLO-ATHERTON HIGH SCHOOL)
- KBAA (94.5 FM; GILROY, CA; Owner: INFINITY RADIO OPERATIONS INC.)
- KKSF-FM1 (103.7 FM; PLEASANTON, ETC., CA; Owner: AMFM RADIO LICENSES, L.L.C.)
- KSQL (99.1 FM; SANTA CRUZ, CA; Owner: TMS LICENSE CALIFORNIA, INC)
- KKUP (91.5 FM; CUPERTINO, CA; Owner: ASSURANCE SCIENCES FOUNDATION)
- KBRG (100.3 FM; SAN JOSE, CA; Owner: ENTRAVISION HOLDINGS, LLC)
- KFRC-FM3 (99.7 FM; WALNUT CREEK, CA; Owner: INFINITY KFRC-FM, INC.)
- KZBR-FM1 (95.7 FM; WALNUT CREEK, CA; Owner: BONNEVILLE HOLDING COMPANY)
- KBLX-FM2 (102.9 FM; PLEASANTON, CA; Owner: ICBC BROADCAST HOLDINGS -CA, INC.)
- KSOL-FM3 (98.9 FM; PLEASANTON, CA; Owner: TMS LICENSE CALIFORNIA, INC)
- KZBR-FM2 (95.7 FM; LIVERMORE, ETC., CA; Owner: BONNEVILLE HOLDING COMPANY)
- KISQ-FM3 (98.1 FM; CONCORD, CA; Owner: AMFM RADIO LICENSES, L.L.C.)
- KYLD (94.9 FM; SAN FRANCISCO, CA; Owner: AMFM RADIO LICENSES, L.L.C.)
- KFRC-FM (99.7 FM; SAN FRANCISCO, CA; Owner: INFINITY KFRC-FM, INC.)
- KBLX-FM (102.9 FM; BERKELEY, CA; Owner: ICBC BROADCAST HOLDINGS - CA, INC.)
- KZBR (95.7 FM; SAN FRANCISCO, CA; Owner: BONNEVILLE HOLDING COMPANY)
- KMEL (106.1 FM; SAN FRANCISCO, CA; Owner: AMFM RADIO LICENSES, L.L.C.)
- KSAN (107.7 FM; SAN MATEO, CA; Owner: SUSQUEHANNA RADIO CORP.)
- KCSM (91.1 FM; SAN MATEO, CA; Owner: SAN MATEO COUNTY COMMUNITY COLLEGE)
TV broadcast stations around Woodside:
- KQED (Channel 9; SAN FRANCISCO, CA; Owner: KQED, INC.)
- KGO-TV (Channel 7; SAN FRANCISCO, CA; Owner: KGO TELEVISION, INC.)
- KPIX-TV (Channel 5; SAN FRANCISCO, CA; Owner: CBS BROADCASTING INC.)
- KTVU (Channel 2; OAKLAND, CA; Owner: KTVU PARTNERSHIP)
- KRON-TV (Channel 4; SAN FRANCISCO, CA; Owner: YOUNG BROADCASTING OF SAN FRANCISCO, INC.)
- KCSM-TV (Channel 60; SAN MATEO, CA; Owner: SAN MATEO COUNTY COMMUNITY COLLEGE DISTRICT)
- KMTP-TV (Channel 32; SAN FRANCISCO, CA; Owner: MINORITY TELEVISION PROJECT)
- KBHK-TV (Channel 44; SAN FRANCISCO, CA; Owner: VIACOM TELEVISION STATIONS GROUP OF SAN FRANCISCO INC.)
- KBWB (Channel 20; SAN FRANCISCO, CA; Owner: KBWB LICENSE, INC.)
- KFSF (Channel 66; VALLEJO, CA; Owner: TELEFUTURA SAN FRANCISCO LLC)
- KBIT-CA (Channel 28; SAN FRANCISCO, ETC., CA; Owner: POLAR BROADCASTING, INC.)
- KCNS (Channel 38; SAN FRANCISCO, CA; Owner: WRAY, INC.)
- KICU-TV (Channel 36; SAN JOSE, CA; Owner: KTVU PARTNERSHIP)
- KTEH (Channel 54; SAN JOSE, CA; Owner: KTEH FOUNDATION)
- KDTV (Channel 14; SAN FRANCISCO, CA; Owner: KDTV LICENSE PARTNERSHIP, G.P.)
- KSTS (Channel 48; SAN JOSE, CA; Owner: TELEMUNDO OF NORTHERN CALIFORNIA LICENSE CORP.)
- KTSF (Channel 26; SAN FRANCISCO, CA; Owner: LINCOLN BROADCASTING COMPANY, A CALIFORNIA LP)
- National Bridge Inventory (NBI) Statistics
- 22Number of bridges
- 138ft / 42.4mTotal length
- 446,281Total average daily traffic
- 13,278Total average daily truck traffic
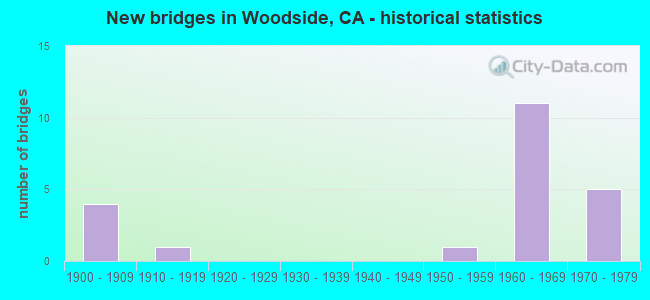
- New bridges - historical statistics
- 41900-1909
- 11910-1919
- 11950-1959
- 111960-1969
- 51970-1979
FCC Registered Antenna Towers: 15 (See the full list of FCC Registered Antenna Towers)
FCC Registered Private Land Mobile Towers: 4 (See the full list of FCC Registered Private Land Mobile Towers in Woodside, CA)
FCC Registered Broadcast Land Mobile Towers: 17 (See the full list of FCC Registered Broadcast Land Mobile Towers)
FCC Registered Microwave Towers: 30 (See the full list of FCC Registered Microwave Towers in this town)
FCC Registered Paging Towers: 4 (See the full list of FCC Registered Paging Towers)
FCC Registered Amateur Radio Licenses: 182 (See the full list of FCC Registered Amateur Radio Licenses in Woodside)
FAA Registered Aircraft: 32 (See the full list of FAA Registered Aircraft in Woodside)
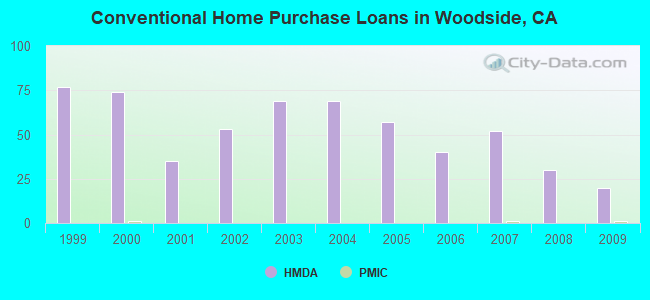
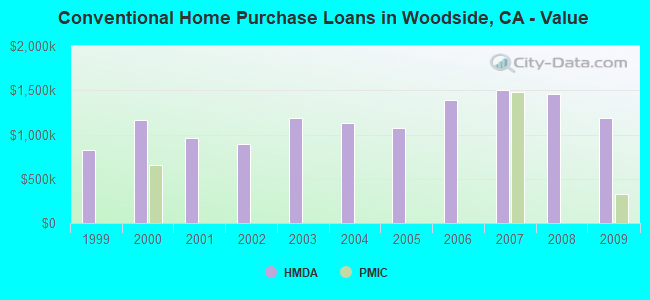
| Home Mortgage Disclosure Act Aggregated Statistics For Year 2009 (Based on 1 full and 1 partial tracts) | ||||||||
| B) Conventional Home Purchase Loans | C) Refinancings | D) Home Improvement Loans | F) Non-occupant Loans on < 5 Family Dwellings (A B C & D) | |||||
|---|---|---|---|---|---|---|---|---|
| Number | Average Value | Number | Average Value | Number | Average Value | Number | Average Value | |
| LOANS ORIGINATED | 20 | $1,190,886 | 179 | $668,209 | 5 | $1,397,996 | 5 | $1,651,272 |
| APPLICATIONS APPROVED, NOT ACCEPTED | 3 | $1,529,040 | 21 | $536,581 | 0 | $0 | 0 | $0 |
| APPLICATIONS DENIED | 7 | $1,078,766 | 46 | $948,197 | 3 | $132,000 | 2 | $518,475 |
| APPLICATIONS WITHDRAWN | 3 | $1,868,650 | 28 | $877,295 | 0 | $0 | 0 | $0 |
| FILES CLOSED FOR INCOMPLETENESS | 0 | $0 | 4 | $752,430 | 1 | $600,000 | 1 | $505,000 |
Detailed HMDA statistics for the following Tracts: 6133.00 , 6134.00
| Private Mortgage Insurance Companies Aggregated Statistics For Year 2009 (Based on 1 full tract) | ||
| A) Conventional Home Purchase Loans | ||
|---|---|---|
| Number | Average Value | |
| LOANS ORIGINATED | 1 | $331,000 |
| APPLICATIONS APPROVED, NOT ACCEPTED | 0 | $0 |
| APPLICATIONS DENIED | 0 | $0 |
| APPLICATIONS WITHDRAWN | 0 | $0 |
| FILES CLOSED FOR INCOMPLETENESS | 0 | $0 |
Detailed PMIC statistics for the following Tracts: 6133.00 , 6134.00
2005 - 2018 National Fire Incident Reporting System (NFIRS) incidents
- Fire incident types reported to NFIRS in Woodside, CA
- 16539.5%Outside Fires
- 12529.9%Structure Fires
- 10725.6%Mobile Property/Vehicle Fires
- 215.0%Other
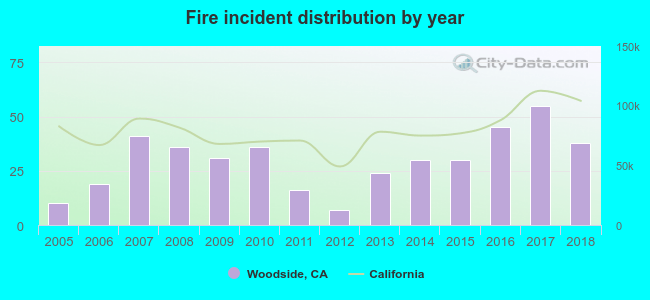 According to the data from the years 2005 - 2018 the average number of fires per year is 30. The highest number of reported fires - 55 took place in 2017, and the least - 7 in 2012. The data has an increasing trend.
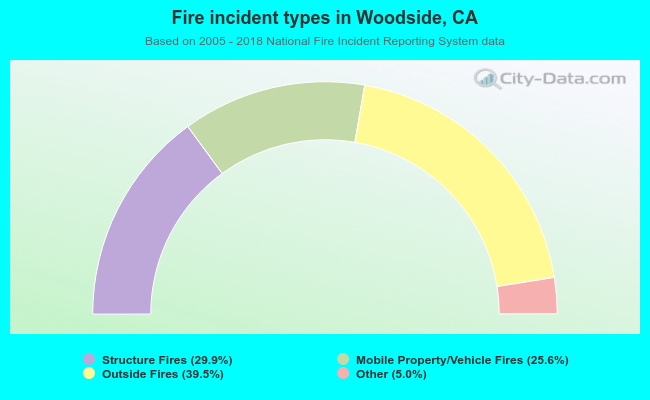 When looking into fire subcategories, the most incidents belonged to: Outside Fires (39.5%), and Structure Fires (29.9%).
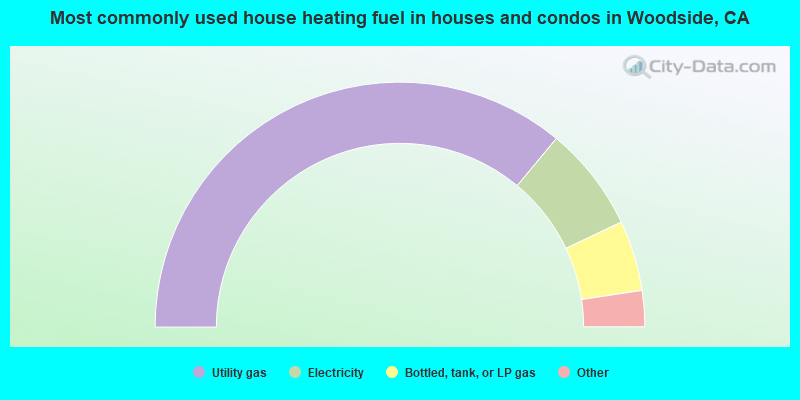
- 72.2%Utility gas
- 13.9%Electricity
- 9.3%Bottled, tank, or LP gas
- 3.4%Other fuel
- 0.8%Solar energy
- 0.4%Wood
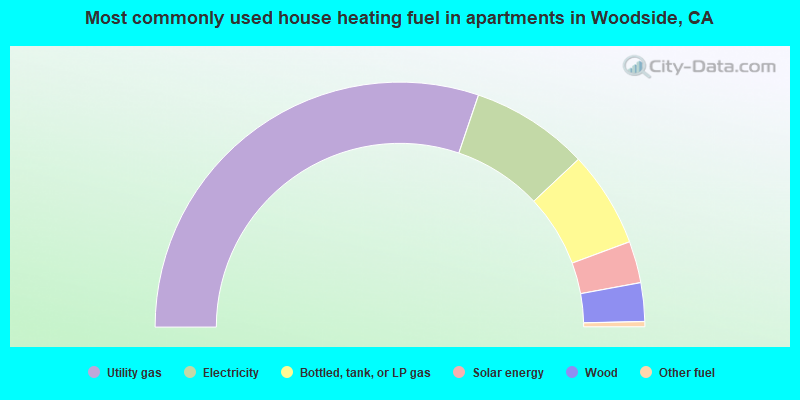
- 60.4%Utility gas
- 15.6%Electricity
- 12.7%Bottled, tank, or LP gas
- 5.5%Solar energy
- 5.1%Wood
- 0.7%Other fuel
Woodside compared to California state average:
- Median household income above state average.
- Median house value significantly above state average.
- Unemployed percentage significantly below state average.
- Black race population percentage significantly below state average.
- Hispanic race population percentage significantly below state average.
- Median age significantly above state average.
- Foreign-born population percentage below state average.
- Renting percentage significantly below state average.
- Length of stay since moving in significantly above state average.
- Number of rooms per house significantly above state average.
- Percentage of population with a bachelor's degree or higher significantly above state average.
Woodside on our top lists:
- #5 on the list of "Top 101 cities with largest percentage of females in industries: professional, scientific, and technical services (population 5,000+)"
- #15 on the list of "Top 101 cities with the highest cost per building permit(population 5,000+)"
- #16 on the list of "Top 101 cities with the most cars per house, population 5,000+"
- #16 on the list of "Top 101 cities with the smallest house values disparities (population 5,000+)"
- #17 on the list of "Top 101 cities with the most residents born in Other Southern Europe (population 500+)"
- #23 on the list of "Top 100 cities with highest median house value"
- #25 on the list of "Top 100 cities with highest median household income"
- #26 on the list of "Top 101 cities with the highest percentage of workers working at home, population 5,000+"
- #46 on the list of "Top 101 cities with the most residents born in Sweden (population 500+)"
- #49 on the list of "Top 101 cities with largest percentage of females in occupations: business and financial operations occupations (population 5,000+)"
- #57 on the list of "Top 101 cities with largest percentage of females in industries: management of companies and enterprises (population 5,000+)"
- #69 on the list of "Top 101 cities with the most residents born in Other Australian and New Zealand Subregion (population 500+)"
- #80 on the list of "Top 101 cities with largest percentage of males in occupations: management occupations (population 5,000+)"
- #97 on the list of "Top 101 cities with largest percentage of males in industries: real estate and rental and leasing (population 5,000+)"
- #98 on the list of "Top 101 cities with the most residents born in Australia and New Zealand Subregion (population 500+)"
- #29 (94062) on the list of "Top 101 zip codes with the highest 2012 average net capital gain/loss (pop 5,000+)"
- #45 (94062) on the list of "Top 101 zip codes with the highest 2012 average reported profit/loss from business (pop 5,000+)"
- #57 (94062) on the list of "Top 101 zip codes with the highest 2012 average Adjusted Gross Income (AGI) for individuals (pop 5,000+)"
- #82 (94062) on the list of "Top 101 zip codes with the highest average reported salary/wage in 2012 (pop 5,000+)"
- #6 on the list of "Top 101 counties with the highest percentage of residents that exercised in the past month"
- #8 on the list of "Top 101 counties with the highest percentage of residents that drank alcohol in the past 30 days"
- #9 on the list of "Top 101 counties with the lowest Ozone (1-hour) air pollution readings in 2012 (ppm)"
- #10 on the list of "Top 101 counties with the highest carbon monoxide air pollution readings in 2012 (ppm)"
- #11 on the list of "Top 101 counties with the lowest average weight of females"

|
|
Total of 2879 patent applications in 2008-2024.