Tampa, Florida Neighborhood Map - Income, House Prices, Occupations, Boundaries
Settings
X

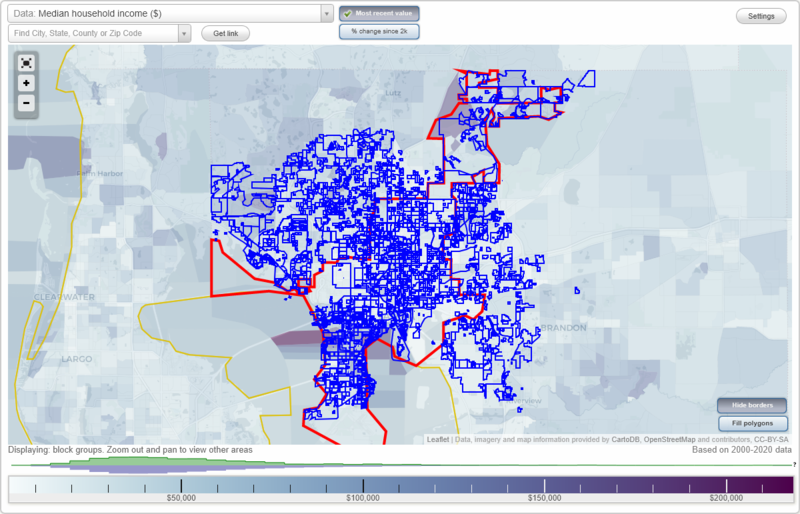
- City boundary
- Neighborhood boundaries
Business Search - 14 Million verified businesses
Indian Lakes - Madsen Court Neighborhoods:
Indian Lakes, Indian Mound Estates, Indian Mound Village, Indian Oaks, Indian Village, Inglewood Park, Interbay Oaks Condo, Interstate Business Park, Iroquois Park, Irvinton Heights, Island Chateau Condo, Island Club at Rocky Point Condo, Island Homes, Island Park Condo, Island Place, Island Place Condo, Island Walk Condo, Italian Villas, Ivy Townvillas, J Diaz Acres, J-R Manor, Jacaranda Townhomes, Jackson Court, Jackson Height, Jackson Heights, Jackson Heights Annex, James E Ferrari Estates, Jane Terrace, Jasmine Pond, Jean Place, Jeanine Manor, Jenny Lyne Estates, Jensen Place, Jetton Place Condo, Jo An Terrace, Joel Court Condo, John Knox Village, Jones Estates, Jules Verne Park, Julian Estates, Kaitlyn Townhomes at North Street, Kansas Avenue Townhomes, Karen Heights, Kathryn Park, Kaywood Heights, Kelkath Estates, Kelly Ridge, Kenilworth Grove, Kennedy Oaks Condo, Kennedy's Tampa Heights, Kensington Park Soho Townhomes, Key's, Keys at Harbour Island, Keystone Homes I, Kimberly Lane, Kimberly Park, Kings's Forest, Kingston Court Villas, Kingston Heights, Kingwood Park, Kinsport Townhomes, Knight's Landing, Knollwood, Knollwood Estates, Krentel Park, Kruse Elise Acreage, L A M Industrial Park, La Belle Terrace, La Casa, La Paloma, La Rentree II Townhomes, La Rue Grande, La Sette Belle Townhomes, La Ventura Condo, Lago Oaks Professional Office Condo, Lago Vista, Lake Carroll Court, Lake Carroll Cove, Lake Carroll Drive, Lake Carroll Grove Estates, Lake Carroll Manor, Lake Carroll View, Lake Chase Condo, Lake Crest Manor, Lake Dorothea Park, Lake Egypt Estates, Lake Ellen Estates, Lake Ellen Grove, Lake Ellen Landings Townhomes Condo, Lake Ellen Shores, Lake Ellen Villas, Lake Ellen Walk, Lake Gass Estate, Lake Leta Trace, Lake Magdalene Arms Estates, Lake Magdalene For Rest, Lake Magdalene Manors, Lake Magdalene Park, Lake Magdalene Vista, Lake Magdalene Woods, Lake Marie Mobile Estates, Lake Morley Terrace Estates, Lake Place Condo, Lake Platt West, Lake Pointe, Lake Ridge, Lake Robles, Lake Shore Estates, Lake View Heights, Lake View Park, Lakeside Terrace, Lakeside Townhomes, Lakeview Villas at Pebble Creek Village, Lakewood Crest, Lakewood Estates, Lakewood Gardens, Lakewood Manor, Lamar Devilla Condo, Lamour Court, Land Lackey Estates, Landcraft Deleon Townhomes, Landmark South Condo, Lane Farms, Larsen Place, Las Palmas, Las Palmas De Ybor Condo, Las Palmas Townhomes, Las Palmas at Ballast Point Townhomes, Las Villas De Orleans Townhomes, Las Ybor City Homes Condo, Laurel Oaks Office Condo, Laurel Terrace, Laurelon Village of Meadowood Condo, Le Clare Shores, Le Refuge Condo, Legacy Park Townhomes, Leighton Place, Leila Avenue Villas, Leonard Terrace, Leone Estates, Lewis Heights, Lin Lan Terrace, Lincoln Gardens, Lincoln Square, Lincoln Terrace, Linda Court, Linebaugh Avenue Estates, Linebaugh Estates, Linebaugh Plaza One, Lipscomb Villa, Little Cuba, Little Eleven, Little Henry, Live Oak Place, Live Oak Preserve, Live Oaks Square, Livingston Heights, Locicero Columbia Park, Log Cabin Hills, Logan Gate Village, Logan Place, Logan's Bayshore, Logan's Park, Lois Townhomes, Long Industrial Park, Long's, Longboat Landing, Lorene Terrace, Lorraine Estates, Los Altos, Los Cien, Louis Place, Lowe's at Mission Bell, Lowell Village, Lowry Lane, Lowry Oaks, Lowry Park Central, Lowry Park North, Lullaby Pines, Luna Park, Lurline Terrace, Lykes Estates, Lykes Lane, Lynn Lake, Lynnette Estates, Lynwood, MLK Village, Mac Dill Condo, Mac Dill Heights, Mac Dill Park, Mac Farlane Hugh C, Mac Farlane Park, Mac Farlane's and Hermann's, Macdill Estates, Macdill Home, Madigan Park, Madison Business Park, Madison Industrial Park, Madrona Heights, Madsen CourtIndian Lakes neighborhood in Tampa statistics: (Find on map)
Area: 0.025 square miles
Population: 23
Population density:
Median household income in 2021:
Median rent in in 2021:
Male vs Females
Median age
Average estimated value of detached houses in 2021 (100.0% of all units):
Most popular occupations of males: service occupations (42.9%); management occupations (except farmers) (19.8%); healthcare practitioners and technical occupations (17.2%); production occupations (11.7%); computer and mathematical occupations (11.0%); business and financial operations occupations (8.5%); transportation occupations (8.2%)
Most popular occupations of females: sales and office occupations (36.6%); business and financial operations occupations (32.8%); management occupations (except farmers) (13.4%); production occupations (9.4%); healthcare practitioners and technical occupations (8.5%); transportation occupations (7.2%); service occupations (6.8%)
Roads and streets: Bellingham Dr.
Indian Lakes neighborhood detailed profile
Area: 0.025 square miles
Population: 23
Population density:
| Indian Lakes: | 911 people per square mile |
| Tampa: | 3,454 people per square mile |
Median household income in 2021:
| Indian Lakes: | $110,833 |
| Tampa: | $63,404 |
Median rent in in 2021:
| Indian Lakes: | $2,314 |
| Tampa: | $1,191 |
Male vs Females
| Males: | 10 |
| Females: | 12 |
Median age
| Males: | 43.4 years |
| Females: | 43.5 years |
Average estimated value of detached houses in 2021 (100.0% of all units):
| Indian Lakes: | $369,540 |
| Tampa: | $477,728 |
Most popular occupations of males: service occupations (42.9%); management occupations (except farmers) (19.8%); healthcare practitioners and technical occupations (17.2%); production occupations (11.7%); computer and mathematical occupations (11.0%); business and financial operations occupations (8.5%); transportation occupations (8.2%)
Most popular occupations of females: sales and office occupations (36.6%); business and financial operations occupations (32.8%); management occupations (except farmers) (13.4%); production occupations (9.4%); healthcare practitioners and technical occupations (8.5%); transportation occupations (7.2%); service occupations (6.8%)
Roads and streets: Bellingham Dr.
Indian Lakes neighborhood detailed profile
Indian Mound Estates neighborhood in Tampa statistics: (Find on map)
Area: 0.016 square miles
Population: 24
Population density:
Median household income in 2021:
Median rent in in 2021:
Male vs Females
Median age
Most popular occupations of males: computer and mathematical occupations (27.4%); management occupations (except farmers) (16.2%); sales and office occupations (15.6%); service occupations (8.2%); education, training, and library occupations (6.0%); healthcare practitioners and technical occupations (5.2%); business and financial operations occupations (5.0%)
Most popular occupations of females: sales and office occupations (37.8%); healthcare practitioners and technical occupations (14.8%); service occupations (14.8%); business and financial operations occupations (7.9%); education, training, and library occupations (6.3%); management occupations (except farmers) (5.0%); production occupations (4.7%)
Indian Mound Estates neighborhood detailed profile
Area: 0.016 square miles
Population: 24
Population density:
| Indian Mound Estates: | 1,477 people per square mile |
| Tampa: | 3,454 people per square mile |
Median household income in 2021:
| Indian Mound Estates: | $74,600 |
| Tampa: | $63,404 |
Median rent in in 2021:
| Indian Mound Estates: | $994 |
| Tampa: | $1,191 |
Male vs Females
| Males: | 10 |
| Females: | 13 |
Median age
| Males: | 40.2 years |
| Females: | 42.2 years |
Most popular occupations of males: computer and mathematical occupations (27.4%); management occupations (except farmers) (16.2%); sales and office occupations (15.6%); service occupations (8.2%); education, training, and library occupations (6.0%); healthcare practitioners and technical occupations (5.2%); business and financial operations occupations (5.0%)
Most popular occupations of females: sales and office occupations (37.8%); healthcare practitioners and technical occupations (14.8%); service occupations (14.8%); business and financial operations occupations (7.9%); education, training, and library occupations (6.3%); management occupations (except farmers) (5.0%); production occupations (4.7%)
Indian Mound Estates neighborhood detailed profile
Indian Mound Village neighborhood in Tampa statistics: (Find on map)
Area: 0.024 square miles
Population: 36
Population density:
Median household income in 2021:
Median rent in in 2021:
Male vs Females
Median age
Most popular occupations of males: computer and mathematical occupations (27.4%); management occupations (except farmers) (16.2%); sales and office occupations (15.6%); service occupations (8.2%); education, training, and library occupations (6.0%); healthcare practitioners and technical occupations (5.2%); business and financial operations occupations (5.0%)
Most popular occupations of females: sales and office occupations (37.8%); healthcare practitioners and technical occupations (14.8%); service occupations (14.8%); business and financial operations occupations (7.9%); education, training, and library occupations (6.3%); management occupations (except farmers) (5.0%); production occupations (4.7%)
Roads and streets: Teepee Dr.
Indian Mound Village neighborhood detailed profile
Area: 0.024 square miles
Population: 36
Population density:
| Indian Mound Village: | 1,470 people per square mile |
| Tampa: | 3,454 people per square mile |
Median household income in 2021:
| Indian Mound Village: | $74,600 |
| Tampa: | $63,404 |
Median rent in in 2021:
| Indian Mound Village: | $994 |
| Tampa: | $1,191 |
Male vs Females
| Males: | 15 |
| Females: | 20 |
Median age
| Males: | 40.2 years |
| Females: | 42.2 years |
Most popular occupations of males: computer and mathematical occupations (27.4%); management occupations (except farmers) (16.2%); sales and office occupations (15.6%); service occupations (8.2%); education, training, and library occupations (6.0%); healthcare practitioners and technical occupations (5.2%); business and financial operations occupations (5.0%)
Most popular occupations of females: sales and office occupations (37.8%); healthcare practitioners and technical occupations (14.8%); service occupations (14.8%); business and financial operations occupations (7.9%); education, training, and library occupations (6.3%); management occupations (except farmers) (5.0%); production occupations (4.7%)
Roads and streets: Teepee Dr.
Indian Mound Village neighborhood detailed profile
Indian Oaks neighborhood in Tampa statistics: (Find on map)
Area: 0.047 square miles
Population: 170
Population density:
Median household income in 2021:
Median rent in in 2021:
Male vs Females
Median age
Housing prices:
Average estimated value of detached houses in 2021 (61.1% of all units):
Average estimated value of townhouses or other attached units in 2021 (45.8% of all units):
Most popular occupations of males: sales and office occupations (34.9%); computer and mathematical occupations (13.1%); business and financial operations occupations (9.9%); transportation occupations (7.6%); healthcare practitioners and technical occupations (7.1%); education, training, and library occupations (6.0%); construction, extraction, and maintenance occupations (5.2%)
Most popular occupations of females: sales and office occupations (51.4%); management occupations (except farmers) (11.0%); arts, design, entertainment, sports, and media occupations (9.5%); business and financial operations occupations (6.9%); service occupations (5.4%); healthcare practitioners and technical occupations (5.3%); education, training, and library occupations (4.1%)
Roads and streets: Indian Oaks Dr; Silver Branch Ct; Yardley Oaks Ct.
Indian Oaks neighborhood detailed profile
Area: 0.047 square miles
Population: 170
Population density:
| Indian Oaks: | 3,651 people per square mile |
| Tampa: | 3,454 people per square mile |
Median household income in 2021:
| Indian Oaks: | $78,766 |
| Tampa: | $63,404 |
Median rent in in 2021:
| Indian Oaks: | $2,141 |
| Tampa: | $1,191 |
Male vs Females
| Males: | 88 |
| Females: | 82 |
Median age
| Males: | 48.1 years |
| Females: | 60.4 years |
Housing prices:
Average estimated value of detached houses in 2021 (61.1% of all units):
| Indian Oaks: | $244,300 |
| Tampa: | $477,728 |
Average estimated value of townhouses or other attached units in 2021 (45.8% of all units):
| This neighborhood: | $274,928 |
| city: | $499,254 |
Most popular occupations of males: sales and office occupations (34.9%); computer and mathematical occupations (13.1%); business and financial operations occupations (9.9%); transportation occupations (7.6%); healthcare practitioners and technical occupations (7.1%); education, training, and library occupations (6.0%); construction, extraction, and maintenance occupations (5.2%)
Most popular occupations of females: sales and office occupations (51.4%); management occupations (except farmers) (11.0%); arts, design, entertainment, sports, and media occupations (9.5%); business and financial operations occupations (6.9%); service occupations (5.4%); healthcare practitioners and technical occupations (5.3%); education, training, and library occupations (4.1%)
Roads and streets: Indian Oaks Dr; Silver Branch Ct; Yardley Oaks Ct.
Indian Oaks neighborhood detailed profile
Indian Village neighborhood in Tampa statistics: (Find on map)
Population: 3
Population density:
Median household income in 2021:
Median rent in in 2021:
Male vs Females
Median age
Most popular occupations of males: service occupations (33.5%); material moving occupations (22.9%); transportation occupations (14.4%); healthcare practitioners and technical occupations (14.0%); construction, extraction, and maintenance occupations (12.2%); farming, fishing, and forestry occupations (9.6%); sales and office occupations (9.0%)
Most popular occupations of females: service occupations (33.7%); sales and office occupations (24.0%); education, training, and library occupations (20.4%); business and financial operations occupations (12.8%); life, physical, and social science occupations (8.2%); legal occupations (6.6%); material moving occupations (4.6%)
Indian Village neighborhood detailed profile
Population: 3
Population density:
| Indian Village: | 3,652 people per square mile |
| Tampa: | 3,454 people per square mile |
Median household income in 2021:
| Indian Village: | $18,670 |
| Tampa: | $63,404 |
Median rent in in 2021:
| Indian Village: | $668 |
| Tampa: | $1,191 |
Male vs Females
| Males: | 1 |
| Females: | 1 |
Median age
| Males: | 40.7 years |
| Females: | 43.8 years |
Most popular occupations of males: service occupations (33.5%); material moving occupations (22.9%); transportation occupations (14.4%); healthcare practitioners and technical occupations (14.0%); construction, extraction, and maintenance occupations (12.2%); farming, fishing, and forestry occupations (9.6%); sales and office occupations (9.0%)
Most popular occupations of females: service occupations (33.7%); sales and office occupations (24.0%); education, training, and library occupations (20.4%); business and financial operations occupations (12.8%); life, physical, and social science occupations (8.2%); legal occupations (6.6%); material moving occupations (4.6%)
Indian Village neighborhood detailed profile
Inglewood Park neighborhood in Tampa statistics: (Find on map)
Area: 0.085 square miles
Population: 28
Population density:
Median household income in 2021:
Median rent in in 2021:
Male vs Females
Median age
Average estimated value of detached houses in 2021 (57.1% of all units):
Most popular occupations of males: service occupations (30.0%); construction, extraction, and maintenance occupations (22.3%); production occupations (11.7%); sales and office occupations (9.9%); material moving occupations (9.4%); management occupations (except farmers) (8.4%); transportation occupations (3.9%)
Most popular occupations of females: production occupations (49.2%); service occupations (25.5%); sales and office occupations (18.6%); construction, extraction, and maintenance occupations (8.1%); business and financial operations occupations (6.7%); transportation occupations (4.6%); management occupations (except farmers) (2.2%)
Roads and streets: Taliaferro Ave; E 125th Ave; 126th Ave.
Inglewood Park neighborhood detailed profile
Area: 0.085 square miles
Population: 28
Population density:
| Inglewood Park: | 328 people per square mile |
| Tampa: | 3,454 people per square mile |
Median household income in 2021:
| Inglewood Park: | $17,957 |
| Tampa: | $63,404 |
Median rent in in 2021:
| Inglewood Park: | $493 |
| Tampa: | $1,191 |
Male vs Females
| Males: | 15 |
| Females: | 13 |
Median age
| Males: | 26.2 years |
| Females: | 32.0 years |
Average estimated value of detached houses in 2021 (57.1% of all units):
| Inglewood Park: | $119,308 |
| Tampa: | $477,728 |
Most popular occupations of males: service occupations (30.0%); construction, extraction, and maintenance occupations (22.3%); production occupations (11.7%); sales and office occupations (9.9%); material moving occupations (9.4%); management occupations (except farmers) (8.4%); transportation occupations (3.9%)
Most popular occupations of females: production occupations (49.2%); service occupations (25.5%); sales and office occupations (18.6%); construction, extraction, and maintenance occupations (8.1%); business and financial operations occupations (6.7%); transportation occupations (4.6%); management occupations (except farmers) (2.2%)
Roads and streets: Taliaferro Ave; E 125th Ave; 126th Ave.
Inglewood Park neighborhood detailed profile
Interbay Oaks Condo neighborhood in Tampa statistics: (Find on map)
Population: 14
Population density:
Median household income in 2021:
Median rent in in 2021:
Male vs Females
Median age
Most popular occupations of males: service occupations (14.6%); management occupations (except farmers) (13.7%); construction, extraction, and maintenance occupations (12.9%); computer and mathematical occupations (11.1%); architecture and engineering occupations (9.3%); sales and office occupations (8.2%); business and financial operations occupations (6.7%)
Most popular occupations of females: business and financial operations occupations (26.8%); healthcare practitioners and technical occupations (16.8%); sales and office occupations (14.7%); service occupations (11.6%); management occupations (except farmers) (11.1%); education, training, and library occupations (9.8%); architecture and engineering occupations (3.6%)
Interbay Oaks Condo neighborhood detailed profile
Population: 14
Population density:
| Interbay Oaks Condo: | 18,727 people per square mile |
| Tampa: | 3,454 people per square mile |
Median household income in 2021:
| Interbay Oaks Condo: | $118,269 |
| Tampa: | $63,404 |
Median rent in in 2021:
| Interbay Oaks Condo: | $1,789 |
| Tampa: | $1,191 |
Male vs Females
| Males: | 7 |
| Females: | 7 |
Median age
| Males: | 40.6 years |
| Females: | 36.5 years |
Most popular occupations of males: service occupations (14.6%); management occupations (except farmers) (13.7%); construction, extraction, and maintenance occupations (12.9%); computer and mathematical occupations (11.1%); architecture and engineering occupations (9.3%); sales and office occupations (8.2%); business and financial operations occupations (6.7%)
Most popular occupations of females: business and financial operations occupations (26.8%); healthcare practitioners and technical occupations (16.8%); sales and office occupations (14.7%); service occupations (11.6%); management occupations (except farmers) (11.1%); education, training, and library occupations (9.8%); architecture and engineering occupations (3.6%)
Interbay Oaks Condo neighborhood detailed profile
Interstate Business Park neighborhood in Tampa statistics: (Find on map)
Area: 0.111 square miles
Population: 70
Population density:
Median household income in 2021:
Median rent in in 2021:
Male vs Females
Median age
Most popular occupations of males: service occupations (50.6%); business and financial operations occupations (44.9%); computer and mathematical occupations (40.8%); management occupations (except farmers) (17.9%); material moving occupations (16.8%); transportation occupations (16.7%); sales and office occupations (13.5%)
Most popular occupations of females: service occupations (26.7%); sales and office occupations (21.6%); production occupations (15.2%); healthcare practitioners and technical occupations (13.8%); business and financial operations occupations (11.8%); education, training, and library occupations (6.6%); community and social services occupations (5.5%)
Roads and streets: Laurel Fair Cir.
Interstate Business Park neighborhood detailed profile
Area: 0.111 square miles
Population: 70
Population density:
| Interstate Business Park: | 633 people per square mile |
| Tampa: | 3,454 people per square mile |
Median household income in 2021:
| Interstate Business Park: | $87,905 |
| Tampa: | $63,404 |
Median rent in in 2021:
| Interstate Business Park: | $1,291 |
| Tampa: | $1,191 |
Male vs Females
| Males: | 29 |
| Females: | 40 |
Median age
| Males: | 45.1 years |
| Females: | 33.8 years |
Most popular occupations of males: service occupations (50.6%); business and financial operations occupations (44.9%); computer and mathematical occupations (40.8%); management occupations (except farmers) (17.9%); material moving occupations (16.8%); transportation occupations (16.7%); sales and office occupations (13.5%)
Most popular occupations of females: service occupations (26.7%); sales and office occupations (21.6%); production occupations (15.2%); healthcare practitioners and technical occupations (13.8%); business and financial operations occupations (11.8%); education, training, and library occupations (6.6%); community and social services occupations (5.5%)
Roads and streets: Laurel Fair Cir.
Interstate Business Park neighborhood detailed profile
Iroquois Park neighborhood in Tampa statistics: (Find on map)
Area: 0.006 square miles
Population: 14
Population density:
Median household income in 2021:
Median rent in in 2021:
Male vs Females
Median age
Housing prices:
Average estimated value of detached houses in 2021 (90.0% of all units):
Most popular occupations of males: management occupations (except farmers) (32.4%); construction, extraction, and maintenance occupations (27.9%); education, training, and library occupations (12.6%); service occupations (9.0%); computer and mathematical occupations (7.2%); business and financial operations occupations (6.3%); architecture and engineering occupations (5.2%)
Most popular occupations of females: education, training, and library occupations (35.9%); service occupations (21.7%); community and social services occupations (18.5%); management occupations (except farmers) (18.4%); healthcare practitioners and technical occupations (9.8%); sales and office occupations (7.6%); arts, design, entertainment, sports, and media occupations (7.1%)
Iroquois Park neighborhood detailed profile
Area: 0.006 square miles
Population: 14
Population density:
| Iroquois Park: | 2,453 people per square mile |
| Tampa: | 3,454 people per square mile |
Median household income in 2021:
| Iroquois Park: | $62,292 |
| Tampa: | $63,404 |
Median rent in in 2021:
| Iroquois Park: | $842 |
| Tampa: | $1,191 |
Male vs Females
| Males: | 7 |
| Females: | 7 |
Median age
| Males: | 48.2 years |
| Females: | 39.8 years |
Housing prices:
Average estimated value of detached houses in 2021 (90.0% of all units):
| Iroquois Park: | $388,094 |
| Tampa: | $477,728 |
Most popular occupations of males: management occupations (except farmers) (32.4%); construction, extraction, and maintenance occupations (27.9%); education, training, and library occupations (12.6%); service occupations (9.0%); computer and mathematical occupations (7.2%); business and financial operations occupations (6.3%); architecture and engineering occupations (5.2%)
Most popular occupations of females: education, training, and library occupations (35.9%); service occupations (21.7%); community and social services occupations (18.5%); management occupations (except farmers) (18.4%); healthcare practitioners and technical occupations (9.8%); sales and office occupations (7.6%); arts, design, entertainment, sports, and media occupations (7.1%)
Iroquois Park neighborhood detailed profile
Irvinton Heights neighborhood in Tampa statistics: (Find on map)
Area: 0.053 square miles
Limited-access highways (interstate or state) in this neighborhood: I- 275 (State Hwy 93).
Roads and streets: E Seward St; E Wood St; E Fairbanks St; E Rampart St; Dixon Ave; N Suwanee Ave; N Branch Ave; Seminole Ave.
Irvinton Heights neighborhood detailed profile
Area: 0.053 square miles
Limited-access highways (interstate or state) in this neighborhood: I- 275 (State Hwy 93).
Roads and streets: E Seward St; E Wood St; E Fairbanks St; E Rampart St; Dixon Ave; N Suwanee Ave; N Branch Ave; Seminole Ave.
Irvinton Heights neighborhood detailed profile
Island Chateau Condo neighborhood in Tampa statistics: (Find on map)
Area: 0.002 square miles
Island Chateau Condo neighborhood detailed profile
Area: 0.002 square miles
Island Chateau Condo neighborhood detailed profile
Island Club at Rocky Point Condo neighborhood in Tampa statistics: (Find on map)
Area: 0.009 square miles
Population: 1
Population density:
Median household income in 2021:
Median rent in in 2021:
Male vs Females
Median age
Most popular occupations of males: legal occupations (27.0%); sales and office occupations (17.6%); management occupations (except farmers) (16.4%); business and financial operations occupations (9.5%); service occupations (4.6%); material moving occupations (4.5%); arts, design, entertainment, sports, and media occupations (3.9%)
Most popular occupations of females: business and financial operations occupations (16.9%); education, training, and library occupations (16.4%); healthcare practitioners and technical occupations (14.1%); service occupations (13.1%); sales and office occupations (12.0%); transportation occupations (6.6%); management occupations (except farmers) (6.1%)
Island Club at Rocky Point Condo neighborhood detailed profile
Area: 0.009 square miles
Population: 1
Population density:
| Island Club at Rocky Point Condo: | 110 people per square mile |
| Tampa: | 3,454 people per square mile |
Median household income in 2021:
| Island Club at Rocky Point Condo: | $89,261 |
| Tampa: | $63,404 |
Median rent in in 2021:
| Island Club at Rocky Point Condo: | $1,495 |
| Tampa: | $1,191 |
Male vs Females
| Males: | 1 |
| Females: | 0 |
Median age
| Males: | 47.5 years |
| Females: | 42.1 years |
Most popular occupations of males: legal occupations (27.0%); sales and office occupations (17.6%); management occupations (except farmers) (16.4%); business and financial operations occupations (9.5%); service occupations (4.6%); material moving occupations (4.5%); arts, design, entertainment, sports, and media occupations (3.9%)
Most popular occupations of females: business and financial operations occupations (16.9%); education, training, and library occupations (16.4%); healthcare practitioners and technical occupations (14.1%); service occupations (13.1%); sales and office occupations (12.0%); transportation occupations (6.6%); management occupations (except farmers) (6.1%)
Island Club at Rocky Point Condo neighborhood detailed profile
Island Homes neighborhood in Tampa statistics: (Find on map)
Area: 0.017 square miles
Population: 70
Population density:
Median household income in 2021:
Median rent in in 2021:
Male vs Females
Median age
Housing prices:
Average estimated value of townhouses or other attached units in 2021 (19.3% of all units):
Average estimated '21 value of housing units in 5-or-more-unit structures (89.5% of all units):
Most popular occupations of males: sales and office occupations (30.6%); management occupations (except farmers) (29.0%); business and financial operations occupations (11.6%); architecture and engineering occupations (7.9%); legal occupations (6.3%); healthcare practitioners and technical occupations (5.7%); service occupations (3.3%)
Most popular occupations of females: sales and office occupations (40.2%); business and financial operations occupations (18.8%); management occupations (except farmers) (11.7%); legal occupations (9.7%); healthcare practitioners and technical occupations (5.9%); arts, design, entertainment, sports, and media occupations (5.7%); computer and mathematical occupations (3.8%)
Roads and streets: Anchorage Rd; Mooring Cir; Mariner Way.
Island Homes neighborhood detailed profile
Area: 0.017 square miles
Population: 70
Population density:
| Island Homes: | 4,178 people per square mile |
| Tampa: | 3,454 people per square mile |
Median household income in 2021:
| Island Homes: | $105,375 |
| Tampa: | $63,404 |
Median rent in in 2021:
| Island Homes: | $1,908 |
| Tampa: | $1,191 |
Male vs Females
| Males: | 37 |
| Females: | 32 |
Median age
| Males: | 41.9 years |
| Females: | 35.0 years |
Housing prices:
Average estimated value of townhouses or other attached units in 2021 (19.3% of all units):
| This neighborhood: | $570,089 |
| city: | $499,254 |
Average estimated '21 value of housing units in 5-or-more-unit structures (89.5% of all units):
| Island Homes: | $333,338 |
| Tampa: | $443,026 |
Most popular occupations of males: sales and office occupations (30.6%); management occupations (except farmers) (29.0%); business and financial operations occupations (11.6%); architecture and engineering occupations (7.9%); legal occupations (6.3%); healthcare practitioners and technical occupations (5.7%); service occupations (3.3%)
Most popular occupations of females: sales and office occupations (40.2%); business and financial operations occupations (18.8%); management occupations (except farmers) (11.7%); legal occupations (9.7%); healthcare practitioners and technical occupations (5.9%); arts, design, entertainment, sports, and media occupations (5.7%); computer and mathematical occupations (3.8%)
Roads and streets: Anchorage Rd; Mooring Cir; Mariner Way.
Island Homes neighborhood detailed profile
Island Park Condo neighborhood in Tampa statistics: (Find on map)
Island Park Condo neighborhood detailed profile
Island Park Condo neighborhood detailed profile
Island Place neighborhood in Tampa statistics: (Find on map)
Area: 0.003 square miles
Population: 10
Population density:
Median household income in 2021:
Median rent in in 2021:
Male vs Females
Median age
Housing prices:
Average estimated value of townhouses or other attached units in 2021 (12.5% of all units):
Average estimated '21 value of housing units in 5-or-more-unit structures (87.5% of all units):
Most popular occupations of males: sales and office occupations (30.6%); management occupations (except farmers) (29.0%); business and financial operations occupations (11.6%); architecture and engineering occupations (7.9%); legal occupations (6.3%); healthcare practitioners and technical occupations (5.7%); service occupations (3.3%)
Most popular occupations of females: sales and office occupations (40.2%); business and financial operations occupations (18.8%); management occupations (except farmers) (11.7%); legal occupations (9.7%); healthcare practitioners and technical occupations (5.9%); arts, design, entertainment, sports, and media occupations (5.7%); computer and mathematical occupations (3.8%)
Island Place neighborhood detailed profile
Area: 0.003 square miles
Population: 10
Population density:
| Island Place: | 3,708 people per square mile |
| Tampa: | 3,454 people per square mile |
Median household income in 2021:
| Island Place: | $105,375 |
| Tampa: | $63,404 |
Median rent in in 2021:
| Island Place: | $1,908 |
| Tampa: | $1,191 |
Male vs Females
| Males: | 5 |
| Females: | 4 |
Median age
| Males: | 41.9 years |
| Females: | 35.0 years |
Housing prices:
Average estimated value of townhouses or other attached units in 2021 (12.5% of all units):
| This neighborhood: | $570,089 |
| city: | $499,254 |
Average estimated '21 value of housing units in 5-or-more-unit structures (87.5% of all units):
| Island Place: | $333,338 |
| Tampa: | $443,026 |
Most popular occupations of males: sales and office occupations (30.6%); management occupations (except farmers) (29.0%); business and financial operations occupations (11.6%); architecture and engineering occupations (7.9%); legal occupations (6.3%); healthcare practitioners and technical occupations (5.7%); service occupations (3.3%)
Most popular occupations of females: sales and office occupations (40.2%); business and financial operations occupations (18.8%); management occupations (except farmers) (11.7%); legal occupations (9.7%); healthcare practitioners and technical occupations (5.9%); arts, design, entertainment, sports, and media occupations (5.7%); computer and mathematical occupations (3.8%)
Island Place neighborhood detailed profile
Island Place Condo neighborhood in Tampa statistics: (Find on map)
Area: 0.025 square miles
Population: 103
Population density:
Median household income in 2021:
Median rent in in 2021:
Male vs Females
Median age
Housing prices:
Average estimated value of townhouses or other attached units in 2021 (20.2% of all units):
Average estimated '21 value of housing units in 5-or-more-unit structures (90.5% of all units):
Most popular occupations of males: sales and office occupations (30.6%); management occupations (except farmers) (29.0%); business and financial operations occupations (11.6%); architecture and engineering occupations (7.9%); legal occupations (6.3%); healthcare practitioners and technical occupations (5.7%); service occupations (3.3%)
Most popular occupations of females: sales and office occupations (40.2%); business and financial operations occupations (18.8%); management occupations (except farmers) (11.7%); legal occupations (9.7%); healthcare practitioners and technical occupations (5.9%); arts, design, entertainment, sports, and media occupations (5.7%); computer and mathematical occupations (3.8%)
Roads and streets: Cruise View Dr; Mainsail Dr; Seascape Way; Coral Reef Dr; Seagate Dr; Tropical Breeze Way; Island Place Way; Seaboard Pl; Fathom Ct; Knights Run Ave.
Island Place Condo neighborhood detailed profile
Area: 0.025 square miles
Population: 103
Population density:
| Island Place Condo: | 4,156 people per square mile |
| Tampa: | 3,454 people per square mile |
Median household income in 2021:
| Island Place Condo: | $105,375 |
| Tampa: | $63,404 |
Median rent in in 2021:
| Island Place Condo: | $1,908 |
| Tampa: | $1,191 |
Male vs Females
| Males: | 54 |
| Females: | 48 |
Median age
| Males: | 41.9 years |
| Females: | 35.0 years |
Housing prices:
Average estimated value of townhouses or other attached units in 2021 (20.2% of all units):
| This neighborhood: | $570,089 |
| city: | $499,254 |
Average estimated '21 value of housing units in 5-or-more-unit structures (90.5% of all units):
| Island Place Condo: | $333,338 |
| Tampa: | $443,026 |
Most popular occupations of males: sales and office occupations (30.6%); management occupations (except farmers) (29.0%); business and financial operations occupations (11.6%); architecture and engineering occupations (7.9%); legal occupations (6.3%); healthcare practitioners and technical occupations (5.7%); service occupations (3.3%)
Most popular occupations of females: sales and office occupations (40.2%); business and financial operations occupations (18.8%); management occupations (except farmers) (11.7%); legal occupations (9.7%); healthcare practitioners and technical occupations (5.9%); arts, design, entertainment, sports, and media occupations (5.7%); computer and mathematical occupations (3.8%)
Roads and streets: Cruise View Dr; Mainsail Dr; Seascape Way; Coral Reef Dr; Seagate Dr; Tropical Breeze Way; Island Place Way; Seaboard Pl; Fathom Ct; Knights Run Ave.
Island Place Condo neighborhood detailed profile
Island Walk Condo neighborhood in Tampa statistics: (Find on map)
Area: 0.028 square miles
Population: 117
Population density:
Median household income in 2021:
Median rent in in 2021:
Male vs Females
Median age
Housing prices:
Average estimated value of townhouses or other attached units in 2021 (21.1% of all units):
Average estimated '21 value of housing units in 5-or-more-unit structures (90.5% of all units):
Most popular occupations of males: sales and office occupations (30.6%); management occupations (except farmers) (29.0%); business and financial operations occupations (11.6%); architecture and engineering occupations (7.9%); legal occupations (6.3%); healthcare practitioners and technical occupations (5.7%); service occupations (3.3%)
Most popular occupations of females: sales and office occupations (40.2%); business and financial operations occupations (18.8%); management occupations (except farmers) (11.7%); legal occupations (9.7%); healthcare practitioners and technical occupations (5.9%); arts, design, entertainment, sports, and media occupations (5.7%); computer and mathematical occupations (3.8%)
Roads and streets: Normandy Trace Rd; Island Walk Dr; Arbor Lake Ln.
Island Walk Condo neighborhood detailed profile
Area: 0.028 square miles
Population: 117
Population density:
| Island Walk Condo: | 4,138 people per square mile |
| Tampa: | 3,454 people per square mile |
Median household income in 2021:
| Island Walk Condo: | $105,375 |
| Tampa: | $63,404 |
Median rent in in 2021:
| Island Walk Condo: | $1,908 |
| Tampa: | $1,191 |
Male vs Females
| Males: | 62 |
| Females: | 54 |
Median age
| Males: | 41.9 years |
| Females: | 35.0 years |
Housing prices:
Average estimated value of townhouses or other attached units in 2021 (21.1% of all units):
| This neighborhood: | $570,089 |
| city: | $499,254 |
Average estimated '21 value of housing units in 5-or-more-unit structures (90.5% of all units):
| Island Walk Condo: | $333,338 |
| Tampa: | $443,026 |
Most popular occupations of males: sales and office occupations (30.6%); management occupations (except farmers) (29.0%); business and financial operations occupations (11.6%); architecture and engineering occupations (7.9%); legal occupations (6.3%); healthcare practitioners and technical occupations (5.7%); service occupations (3.3%)
Most popular occupations of females: sales and office occupations (40.2%); business and financial operations occupations (18.8%); management occupations (except farmers) (11.7%); legal occupations (9.7%); healthcare practitioners and technical occupations (5.9%); arts, design, entertainment, sports, and media occupations (5.7%); computer and mathematical occupations (3.8%)
Roads and streets: Normandy Trace Rd; Island Walk Dr; Arbor Lake Ln.
Island Walk Condo neighborhood detailed profile
Italian Villas neighborhood in Tampa statistics: (Find on map)
Italian Villas neighborhood detailed profile
Italian Villas neighborhood detailed profile
Ivy Townvillas neighborhood in Tampa statistics: (Find on map)
Area: 0.003 square miles
Ivy Townvillas neighborhood detailed profile
Area: 0.003 square miles
Ivy Townvillas neighborhood detailed profile
J Diaz Acres neighborhood in Tampa statistics: (Find on map)
Area: 0.007 square miles
Population: 8
Population density:
Median household income in 2021:
Median rent in in 2021:
Male vs Females
Median age
Average estimated value of detached houses in 2021 (80.0% of all units):
Most popular occupations of males: production occupations (47.8%); management occupations (except farmers) (28.9%); construction, extraction, and maintenance occupations (10.0%); life, physical, and social science occupations (7.5%); transportation occupations (4.3%); community and social services occupations (4.2%); sales and office occupations (4.0%)
Most popular occupations of females: service occupations (49.2%); sales and office occupations (24.6%); healthcare practitioners and technical occupations (13.1%); business and financial operations occupations (11.1%); production occupations (7.9%); material moving occupations (7.1%); management occupations (except farmers) (6.5%)
J Diaz Acres neighborhood detailed profile
Area: 0.007 square miles
Population: 8
Population density:
| J Diaz Acres: | 1,086 people per square mile |
| Tampa: | 3,454 people per square mile |
Median household income in 2021:
| J Diaz Acres: | $47,007 |
| Tampa: | $63,404 |
Median rent in in 2021:
| J Diaz Acres: | $814 |
| Tampa: | $1,191 |
Male vs Females
| Males: | 4 |
| Females: | 3 |
Median age
| Males: | 40.4 years |
| Females: | 48.9 years |
Average estimated value of detached houses in 2021 (80.0% of all units):
| J Diaz Acres: | $212,211 |
| Tampa: | $477,728 |
Most popular occupations of males: production occupations (47.8%); management occupations (except farmers) (28.9%); construction, extraction, and maintenance occupations (10.0%); life, physical, and social science occupations (7.5%); transportation occupations (4.3%); community and social services occupations (4.2%); sales and office occupations (4.0%)
Most popular occupations of females: service occupations (49.2%); sales and office occupations (24.6%); healthcare practitioners and technical occupations (13.1%); business and financial operations occupations (11.1%); production occupations (7.9%); material moving occupations (7.1%); management occupations (except farmers) (6.5%)
J Diaz Acres neighborhood detailed profile
J-R Manor neighborhood in Tampa statistics: (Find on map)
Area: 0.195 square miles
Population: 1,248
Population density:
Median household income in 2021:
Median rent in in 2021:
Male vs Females
Median age
Most popular occupations of males: sales and office occupations (28.5%); architecture and engineering occupations (27.0%); business and financial operations occupations (13.7%); management occupations (except farmers) (8.9%); production occupations (8.7%); material moving occupations (5.2%); computer and mathematical occupations (4.8%)
Most popular occupations of females: service occupations (35.4%); sales and office occupations (19.3%); management occupations (except farmers) (17.6%); business and financial operations occupations (15.4%); production occupations (11.6%); education, training, and library occupations (8.9%); legal occupations (3.6%)
Roads and streets: Quail Valley; Merimac Dr; Colonial Ct; Seven Coves Ct; Willow Forest Ct; Twelve Oaks Blvd; Leeward Dr; Cobbler Pl; April Sound; River Shire; Olympic Ct; Azure Ct; Wayland Ct; Bali Ct; Liberty Pl; Regatta Ct.
J-R Manor neighborhood detailed profile
Area: 0.195 square miles
Population: 1,248
Population density:
| J-R Manor: | 6,394 people per square mile |
| Tampa: | 3,454 people per square mile |
Median household income in 2021:
| J-R Manor: | $51,311 |
| Tampa: | $63,404 |
Median rent in in 2021:
| J-R Manor: | $1,508 |
| Tampa: | $1,191 |
Male vs Females
| Males: | 702 |
| Females: | 545 |
Median age
| Males: | 36.4 years |
| Females: | 47.5 years |
Most popular occupations of males: sales and office occupations (28.5%); architecture and engineering occupations (27.0%); business and financial operations occupations (13.7%); management occupations (except farmers) (8.9%); production occupations (8.7%); material moving occupations (5.2%); computer and mathematical occupations (4.8%)
Most popular occupations of females: service occupations (35.4%); sales and office occupations (19.3%); management occupations (except farmers) (17.6%); business and financial operations occupations (15.4%); production occupations (11.6%); education, training, and library occupations (8.9%); legal occupations (3.6%)
Roads and streets: Quail Valley; Merimac Dr; Colonial Ct; Seven Coves Ct; Willow Forest Ct; Twelve Oaks Blvd; Leeward Dr; Cobbler Pl; April Sound; River Shire; Olympic Ct; Azure Ct; Wayland Ct; Bali Ct; Liberty Pl; Regatta Ct.
J-R Manor neighborhood detailed profile
Jacaranda Townhomes neighborhood in Tampa statistics: (Find on map)
Jacaranda Townhomes neighborhood detailed profile
Jacaranda Townhomes neighborhood detailed profile
Jackson Court neighborhood in Tampa statistics: (Find on map)
Area: 0.013 square miles
Population: 92
Population density:
Median household income in 2021:
Median rent in in 2021:
Male vs Females
Median age
Housing prices:
Average estimated value of detached houses in 2021 (85.7% of all units):
Most popular occupations of males: service occupations (17.8%); management occupations (except farmers) (15.2%); sales and office occupations (12.8%); business and financial operations occupations (9.3%); computer and mathematical occupations (7.6%); architecture and engineering occupations (5.9%); material moving occupations (5.2%)
Most popular occupations of females: sales and office occupations (22.2%); healthcare practitioners and technical occupations (17.4%); management occupations (except farmers) (16.5%); education, training, and library occupations (11.1%); service occupations (8.1%); arts, design, entertainment, sports, and media occupations (6.3%); business and financial operations occupations (6.1%)
Jackson Court neighborhood detailed profile
Area: 0.013 square miles
Population: 92
Population density:
| Jackson Court: | 6,839 people per square mile |
| Tampa: | 3,454 people per square mile |
Median household income in 2021:
| Jackson Court: | $75,216 |
| Tampa: | $63,404 |
Median rent in in 2021:
| Jackson Court: | $821 |
| Tampa: | $1,191 |
Male vs Females
| Males: | 43 |
| Females: | 49 |
Median age
| Males: | 46.4 years |
| Females: | 37.5 years |
Housing prices:
Average estimated value of detached houses in 2021 (85.7% of all units):
| Jackson Court: | $232,052 |
| Tampa: | $477,728 |
Most popular occupations of males: service occupations (17.8%); management occupations (except farmers) (15.2%); sales and office occupations (12.8%); business and financial operations occupations (9.3%); computer and mathematical occupations (7.6%); architecture and engineering occupations (5.9%); material moving occupations (5.2%)
Most popular occupations of females: sales and office occupations (22.2%); healthcare practitioners and technical occupations (17.4%); management occupations (except farmers) (16.5%); education, training, and library occupations (11.1%); service occupations (8.1%); arts, design, entertainment, sports, and media occupations (6.3%); business and financial operations occupations (6.1%)
Jackson Court neighborhood detailed profile
Jackson Height neighborhood in Tampa statistics: (Find on map)
Area: 0.019 square miles
Population: 29
Population density:
Median household income in 2021:
Median rent in in 2021:
Male vs Females
Median age
Most popular occupations of males: service occupations (27.8%); construction, extraction, and maintenance occupations (18.8%); management occupations (except farmers) (16.1%); sales and office occupations (10.2%); transportation occupations (7.0%); material moving occupations (4.9%); production occupations (3.7%)
Most popular occupations of females: sales and office occupations (28.7%); service occupations (25.7%); business and financial operations occupations (12.9%); healthcare practitioners and technical occupations (8.0%); community and social services occupations (4.8%); education, training, and library occupations (4.5%); production occupations (4.3%)
Roads and streets: E 32nd Ave.
Jackson Height neighborhood detailed profile
Area: 0.019 square miles
Population: 29
Population density:
| Jackson Height: | 1,555 people per square mile |
| Tampa: | 3,454 people per square mile |
Median household income in 2021:
| Jackson Height: | $23,847 |
| Tampa: | $63,404 |
Median rent in in 2021:
| Jackson Height: | $971 |
| Tampa: | $1,191 |
Male vs Females
| Males: | 13 |
| Females: | 16 |
Median age
| Males: | 27.9 years |
| Females: | 33.8 years |
Most popular occupations of males: service occupations (27.8%); construction, extraction, and maintenance occupations (18.8%); management occupations (except farmers) (16.1%); sales and office occupations (10.2%); transportation occupations (7.0%); material moving occupations (4.9%); production occupations (3.7%)
Most popular occupations of females: sales and office occupations (28.7%); service occupations (25.7%); business and financial operations occupations (12.9%); healthcare practitioners and technical occupations (8.0%); community and social services occupations (4.8%); education, training, and library occupations (4.5%); production occupations (4.3%)
Roads and streets: E 32nd Ave.
Jackson Height neighborhood detailed profile
Jackson Heights neighborhood in Tampa statistics: (Find on map)
Area: 0.066 square miles
Population: 81
Population density:
Median household income in 2021:
Median rent in in 2021:
Male vs Females
Median age
Average estimated value of detached houses in 2021 (62.1% of all units):
Most popular occupations of males: construction, extraction, and maintenance occupations (65.6%); service occupations (21.0%); computer and mathematical occupations (3.2%); sales and office occupations (3.0%); material moving occupations (2.5%); transportation occupations (2.3%); legal occupations (1.7%)
Most popular occupations of females: service occupations (31.6%); management occupations (except farmers) (20.2%); sales and office occupations (18.6%); healthcare practitioners and technical occupations (15.0%); business and financial operations occupations (7.6%); production occupations (3.7%); transportation occupations (1.7%)
Roads and streets: E 27th Ave; Chipco St; N 31st St; 25th Ave; N 32nd St; E 28th Ave; E 29th Ave; N 33rd St.
Jackson Heights neighborhood detailed profile
Area: 0.066 square miles
Population: 81
Population density:
| Jackson Heights: | 1,223 people per square mile |
| Tampa: | 3,454 people per square mile |
Median household income in 2021:
| Jackson Heights: | $13,342 |
| Tampa: | $63,404 |
Median rent in in 2021:
| Jackson Heights: | $386 |
| Tampa: | $1,191 |
Male vs Females
| Males: | 32 |
| Females: | 49 |
Median age
| Males: | 16.4 years |
| Females: | 14.0 years |
Average estimated value of detached houses in 2021 (62.1% of all units):
| Jackson Heights: | $126,856 |
| Tampa: | $477,728 |
Most popular occupations of males: construction, extraction, and maintenance occupations (65.6%); service occupations (21.0%); computer and mathematical occupations (3.2%); sales and office occupations (3.0%); material moving occupations (2.5%); transportation occupations (2.3%); legal occupations (1.7%)
Most popular occupations of females: service occupations (31.6%); management occupations (except farmers) (20.2%); sales and office occupations (18.6%); healthcare practitioners and technical occupations (15.0%); business and financial operations occupations (7.6%); production occupations (3.7%); transportation occupations (1.7%)
Roads and streets: E 27th Ave; Chipco St; N 31st St; 25th Ave; N 32nd St; E 28th Ave; E 29th Ave; N 33rd St.
Jackson Heights neighborhood detailed profile
Jackson Heights Annex neighborhood in Tampa statistics: (Find on map)
Area: 0.014 square miles
Population: 27
Population density:
Median household income in 2021:
Median rent in in 2021:
Male vs Females
Median age
Average estimated value of detached houses in 2021 (90.9% of all units):
Most popular occupations of males: transportation occupations (26.1%); service occupations (24.3%); sales and office occupations (15.2%); management occupations (except farmers) (10.7%); construction, extraction, and maintenance occupations (7.9%); computer and mathematical occupations (4.3%); material moving occupations (4.3%)
Most popular occupations of females: healthcare practitioners and technical occupations (31.0%); sales and office occupations (22.6%); management occupations (except farmers) (12.1%); production occupations (10.9%); service occupations (10.5%); business and financial operations occupations (7.9%); construction, extraction, and maintenance occupations (7.3%)
Roads and streets: N 69th St.
Jackson Heights Annex neighborhood detailed profile
Area: 0.014 square miles
Population: 27
Population density:
| Jackson Heights Annex: | 1,889 people per square mile |
| Tampa: | 3,454 people per square mile |
Median household income in 2021:
| Jackson Heights Annex: | $50,162 |
| Tampa: | $63,404 |
Median rent in in 2021:
| Jackson Heights Annex: | $928 |
| Tampa: | $1,191 |
Male vs Females
| Males: | 15 |
| Females: | 12 |
Median age
| Males: | 55.3 years |
| Females: | 40.8 years |
Average estimated value of detached houses in 2021 (90.9% of all units):
| Jackson Heights Annex: | $157,151 |
| Tampa: | $477,728 |
Most popular occupations of males: transportation occupations (26.1%); service occupations (24.3%); sales and office occupations (15.2%); management occupations (except farmers) (10.7%); construction, extraction, and maintenance occupations (7.9%); computer and mathematical occupations (4.3%); material moving occupations (4.3%)
Most popular occupations of females: healthcare practitioners and technical occupations (31.0%); sales and office occupations (22.6%); management occupations (except farmers) (12.1%); production occupations (10.9%); service occupations (10.5%); business and financial operations occupations (7.9%); construction, extraction, and maintenance occupations (7.3%)
Roads and streets: N 69th St.
Jackson Heights Annex neighborhood detailed profile
James E Ferrari Estates neighborhood in Tampa statistics: (Find on map)
Area: 0.001 square miles
James E Ferrari Estates neighborhood detailed profile
Area: 0.001 square miles
James E Ferrari Estates neighborhood detailed profile
Jane Terrace neighborhood in Tampa statistics: (Find on map)
Area: 0.003 square miles
Jane Terrace neighborhood detailed profile
Area: 0.003 square miles
Jane Terrace neighborhood detailed profile
Jasmine Pond neighborhood in Tampa statistics: (Find on map)
Area: 0.008 square miles
Roads and streets: Jasmine Pond Dr; Circlewood Ct; Rosepointe Ct; Bainwood Ct.
Jasmine Pond neighborhood detailed profile
Area: 0.008 square miles
Roads and streets: Jasmine Pond Dr; Circlewood Ct; Rosepointe Ct; Bainwood Ct.
Jasmine Pond neighborhood detailed profile
Jean Place neighborhood in Tampa statistics: (Find on map)
Area: 0.006 square miles
Population: 11
Population density:
Median household income in 2021:
Median rent in in 2021:
Male vs Females
Median age
Most popular occupations of males: management occupations (except farmers) (58.1%); sales and office occupations (24.3%); legal occupations (21.1%); healthcare practitioners and technical occupations (17.9%); business and financial operations occupations (15.6%); education, training, and library occupations (8.4%); production occupations (6.2%)
Most popular occupations of females: healthcare practitioners and technical occupations (38.8%); business and financial operations occupations (34.3%); management occupations (except farmers) (16.7%); legal occupations (6.5%); education, training, and library occupations (6.0%); sales and office occupations (3.7%); arts, design, entertainment, sports, and media occupations (2.0%)
Jean Place neighborhood detailed profile
Area: 0.006 square miles
Population: 11
Population density:
| Jean Place: | 1,880 people per square mile |
| Tampa: | 3,454 people per square mile |
Median household income in 2021:
| Jean Place: | $156,406 |
| Tampa: | $63,404 |
Median rent in in 2021:
| Jean Place: | $3,501 |
| Tampa: | $1,191 |
Male vs Females
| Males: | 4 |
| Females: | 6 |
Median age
| Males: | 43.2 years |
| Females: | 41.2 years |
Most popular occupations of males: management occupations (except farmers) (58.1%); sales and office occupations (24.3%); legal occupations (21.1%); healthcare practitioners and technical occupations (17.9%); business and financial operations occupations (15.6%); education, training, and library occupations (8.4%); production occupations (6.2%)
Most popular occupations of females: healthcare practitioners and technical occupations (38.8%); business and financial operations occupations (34.3%); management occupations (except farmers) (16.7%); legal occupations (6.5%); education, training, and library occupations (6.0%); sales and office occupations (3.7%); arts, design, entertainment, sports, and media occupations (2.0%)
Jean Place neighborhood detailed profile
Jeanine Manor neighborhood in Tampa statistics: (Find on map)
Area: 0.003 square miles
Population: 18
Population density:
Median household income in 2021:
Median rent in in 2021:
Male vs Females
Median age
Housing prices:
Average estimated value of mobile home in 2021 (50.0% of all units):
Most popular occupations of males: sales and office occupations (15.5%); material moving occupations (13.8%); education, training, and library occupations (13.6%); production occupations (10.7%); transportation occupations (10.3%); construction, extraction, and maintenance occupations (9.1%); service occupations (6.7%)
Most popular occupations of females: service occupations (47.0%); sales and office occupations (30.0%); business and financial operations occupations (5.7%); healthcare practitioners and technical occupations (5.7%); management occupations (except farmers) (3.8%); education, training, and library occupations (2.6%); arts, design, entertainment, sports, and media occupations (2.6%)
Jeanine Manor neighborhood detailed profile
Area: 0.003 square miles
Population: 18
Population density:
| Jeanine Manor: | 5,404 people per square mile |
| Tampa: | 3,454 people per square mile |
Median household income in 2021:
| Jeanine Manor: | $40,752 |
| Tampa: | $63,404 |
Median rent in in 2021:
| Jeanine Manor: | $725 |
| Tampa: | $1,191 |
Male vs Females
| Males: | 9 |
| Females: | 8 |
Median age
| Males: | 30.4 years |
| Females: | 30.6 years |
Housing prices:
Average estimated value of mobile home in 2021 (50.0% of all units):
| Jeanine Manor: | $10,218 |
| Tampa: | $95,765 |
Most popular occupations of males: sales and office occupations (15.5%); material moving occupations (13.8%); education, training, and library occupations (13.6%); production occupations (10.7%); transportation occupations (10.3%); construction, extraction, and maintenance occupations (9.1%); service occupations (6.7%)
Most popular occupations of females: service occupations (47.0%); sales and office occupations (30.0%); business and financial operations occupations (5.7%); healthcare practitioners and technical occupations (5.7%); management occupations (except farmers) (3.8%); education, training, and library occupations (2.6%); arts, design, entertainment, sports, and media occupations (2.6%)
Jeanine Manor neighborhood detailed profile
Jenny Lyne Estates neighborhood in Tampa statistics: (Find on map)
Area: 0.008 square miles
Jenny Lyne Estates neighborhood detailed profile
Area: 0.008 square miles
Jenny Lyne Estates neighborhood detailed profile
Jensen Place neighborhood in Tampa statistics: (Find on map)
Area: 0.009 square miles
Population: 144
Population density:
Median household income in 2021:
Median rent in in 2021:
Male vs Females
Median age
Average estimated value of detached houses in 2021 (9.7% of all units):
Most popular occupations of males: service occupations (34.2%); sales and office occupations (21.7%); farming, fishing, and forestry occupations (13.8%); transportation occupations (10.5%); production occupations (9.2%); legal occupations (3.9%); management occupations (except farmers) (3.3%)
Most popular occupations of females: service occupations (40.7%); sales and office occupations (20.8%); management occupations (except farmers) (19.0%); arts, design, entertainment, sports, and media occupations (3.8%); education, training, and library occupations (3.7%); healthcare practitioners and technical occupations (3.7%); transportation occupations (3.7%)
Jensen Place neighborhood detailed profile
Area: 0.009 square miles
Population: 144
Population density:
| Jensen Place: | 16,223 people per square mile |
| Tampa: | 3,454 people per square mile |
Median household income in 2021:
| Jensen Place: | $19,531 |
| Tampa: | $63,404 |
Median rent in in 2021:
| Jensen Place: | $632 |
| Tampa: | $1,191 |
Male vs Females
| Males: | 66 |
| Females: | 77 |
Median age
| Males: | 33.5 years |
| Females: | 39.1 years |
Average estimated value of detached houses in 2021 (9.7% of all units):
| Jensen Place: | $445,098 |
| Tampa: | $477,728 |
Most popular occupations of males: service occupations (34.2%); sales and office occupations (21.7%); farming, fishing, and forestry occupations (13.8%); transportation occupations (10.5%); production occupations (9.2%); legal occupations (3.9%); management occupations (except farmers) (3.3%)
Most popular occupations of females: service occupations (40.7%); sales and office occupations (20.8%); management occupations (except farmers) (19.0%); arts, design, entertainment, sports, and media occupations (3.8%); education, training, and library occupations (3.7%); healthcare practitioners and technical occupations (3.7%); transportation occupations (3.7%)
Jensen Place neighborhood detailed profile
Jetton Place Condo neighborhood in Tampa statistics: (Find on map)
Jetton Place Condo neighborhood detailed profile
Jetton Place Condo neighborhood detailed profile
Jo An Terrace neighborhood in Tampa statistics: (Find on map)
Area: 0.004 square miles
Population: 23
Population density:
Median household income in 2021:
Median rent in in 2021:
Male vs Females
Median age
Most popular occupations of males: construction, extraction, and maintenance occupations (23.2%); material moving occupations (20.9%); sales and office occupations (18.6%); transportation occupations (5.9%); business and financial operations occupations (4.9%); service occupations (4.6%); architecture and engineering occupations (4.4%)
Most popular occupations of females: service occupations (33.3%); transportation occupations (16.4%); healthcare practitioners and technical occupations (15.8%); sales and office occupations (14.1%); education, training, and library occupations (11.9%); material moving occupations (9.6%); business and financial operations occupations (8.3%)
Jo An Terrace neighborhood detailed profile
Area: 0.004 square miles
Population: 23
Population density:
| Jo An Terrace: | 5,932 people per square mile |
| Tampa: | 3,454 people per square mile |
Median household income in 2021:
| Jo An Terrace: | $45,161 |
| Tampa: | $63,404 |
Median rent in in 2021:
| Jo An Terrace: | $910 |
| Tampa: | $1,191 |
Male vs Females
| Males: | 14 |
| Females: | 9 |
Median age
| Males: | 40.1 years |
| Females: | 48.1 years |
Most popular occupations of males: construction, extraction, and maintenance occupations (23.2%); material moving occupations (20.9%); sales and office occupations (18.6%); transportation occupations (5.9%); business and financial operations occupations (4.9%); service occupations (4.6%); architecture and engineering occupations (4.4%)
Most popular occupations of females: service occupations (33.3%); transportation occupations (16.4%); healthcare practitioners and technical occupations (15.8%); sales and office occupations (14.1%); education, training, and library occupations (11.9%); material moving occupations (9.6%); business and financial operations occupations (8.3%)
Jo An Terrace neighborhood detailed profile
Joel Court Condo neighborhood in Tampa statistics: (Find on map)
Population: 2
Population density:
Median household income in 2021:
Median rent in in 2021:
Male vs Females
Median age
Most popular occupations of males: construction, extraction, and maintenance occupations (43.9%); service occupations (28.6%); production occupations (13.0%); management occupations (except farmers) (6.8%); sales and office occupations (4.9%); material moving occupations (4.7%); community and social services occupations (2.8%)
Most popular occupations of females: service occupations (41.6%); sales and office occupations (29.0%); construction, extraction, and maintenance occupations (10.1%); transportation occupations (8.2%); business and financial operations occupations (7.8%); production occupations (5.2%); education, training, and library occupations (2.0%)
Joel Court Condo neighborhood detailed profile
Population: 2
Population density:
| Joel Court Condo: | 5,133 people per square mile |
| Tampa: | 3,454 people per square mile |
Median household income in 2021:
| Joel Court Condo: | $30,326 |
| Tampa: | $63,404 |
Median rent in in 2021:
| Joel Court Condo: | $918 |
| Tampa: | $1,191 |
Male vs Females
| Males: | 1 |
| Females: | 1 |
Median age
| Males: | 18.6 years |
| Females: | 28.5 years |
Most popular occupations of males: construction, extraction, and maintenance occupations (43.9%); service occupations (28.6%); production occupations (13.0%); management occupations (except farmers) (6.8%); sales and office occupations (4.9%); material moving occupations (4.7%); community and social services occupations (2.8%)
Most popular occupations of females: service occupations (41.6%); sales and office occupations (29.0%); construction, extraction, and maintenance occupations (10.1%); transportation occupations (8.2%); business and financial operations occupations (7.8%); production occupations (5.2%); education, training, and library occupations (2.0%)
Joel Court Condo neighborhood detailed profile
John Knox Village neighborhood in Tampa statistics: (Find on map)
Area: 0.022 square miles
John Knox Village neighborhood detailed profile
Area: 0.022 square miles
John Knox Village neighborhood detailed profile
Jones Estates neighborhood in Tampa statistics: (Find on map)
Area: 0.007 square miles
Population: 33
Population density:
Median household income in 2021:
Median rent in in 2021:
Male vs Females
Median age
Average estimated value of detached houses in 2021 (100.0% of all units):
Most popular occupations of males: service occupations (32.3%); sales and office occupations (25.7%); education, training, and library occupations (17.4%); construction, extraction, and maintenance occupations (8.4%); business and financial operations occupations (7.8%); management occupations (except farmers) (7.1%); production occupations (6.0%)
Most popular occupations of females: sales and office occupations (26.3%); business and financial operations occupations (24.5%); healthcare practitioners and technical occupations (19.8%); education, training, and library occupations (15.5%); service occupations (5.8%); community and social services occupations (5.4%); transportation occupations (4.5%)
Jones Estates neighborhood detailed profile
Area: 0.007 square miles
Population: 33
Population density:
| Jones Estates: | 4,762 people per square mile |
| Tampa: | 3,454 people per square mile |
Median household income in 2021:
| Jones Estates: | $43,495 |
| Tampa: | $63,404 |
Median rent in in 2021:
| Jones Estates: | $995 |
| Tampa: | $1,191 |
Male vs Females
| Males: | 12 |
| Females: | 21 |
Median age
| Males: | 22.3 years |
| Females: | 21.7 years |
Average estimated value of detached houses in 2021 (100.0% of all units):
| Jones Estates: | $205,766 |
| Tampa: | $477,728 |
Most popular occupations of males: service occupations (32.3%); sales and office occupations (25.7%); education, training, and library occupations (17.4%); construction, extraction, and maintenance occupations (8.4%); business and financial operations occupations (7.8%); management occupations (except farmers) (7.1%); production occupations (6.0%)
Most popular occupations of females: sales and office occupations (26.3%); business and financial operations occupations (24.5%); healthcare practitioners and technical occupations (19.8%); education, training, and library occupations (15.5%); service occupations (5.8%); community and social services occupations (5.4%); transportation occupations (4.5%)
Jones Estates neighborhood detailed profile
Jules Verne Park neighborhood in Tampa statistics: (Find on map)
Area: 0.090 square miles
Population: 17
Population density:
Median household income in 2021:
Median rent in in 2021:
Male vs Females
Median age
Housing prices:
Average estimated value of detached houses in 2021 (60.0% of all units):
Average estimated value of townhouses or other attached units in 2021 (10.0% of all units):
Average estimated '21 value of housing units in 5-or-more-unit structures (10.0% of all units):
Most popular occupations of males: service occupations (32.3%); management occupations (except farmers) (20.8%); sales and office occupations (15.5%); legal occupations (9.5%); healthcare practitioners and technical occupations (7.2%); business and financial operations occupations (5.5%); life, physical, and social science occupations (2.7%)
Most popular occupations of females: service occupations (19.3%); management occupations (except farmers) (18.3%); sales and office occupations (12.7%); healthcare practitioners and technical occupations (11.1%); business and financial operations occupations (8.4%); arts, design, entertainment, sports, and media occupations (8.1%); legal occupations (6.3%)
Roads and streets: Interbay Blvd; Nichols St; S Crescent Dr; W Ballast Point Blvd; B Ave; A Ave; Ballast Point Blvd.
Jules Verne Park neighborhood detailed profile
Area: 0.090 square miles
Population: 17
Population density:
| Jules Verne Park: | 188 people per square mile |
| Tampa: | 3,454 people per square mile |
Median household income in 2021:
| Jules Verne Park: | $29,868 |
| Tampa: | $63,404 |
Median rent in in 2021:
| Jules Verne Park: | $534 |
| Tampa: | $1,191 |
Male vs Females
| Males: | 9 |
| Females: | 8 |
Median age
| Males: | 17.9 years |
| Females: | 17.7 years |
Housing prices:
Average estimated value of detached houses in 2021 (60.0% of all units):
| Jules Verne Park: | $536,051 |
| Tampa: | $477,728 |
Average estimated value of townhouses or other attached units in 2021 (10.0% of all units):
| This neighborhood: | $448,425 |
| city: | $499,254 |
Average estimated '21 value of housing units in 5-or-more-unit structures (10.0% of all units):
| Jules Verne Park: | $98,863 |
| Tampa: | $443,026 |
Most popular occupations of males: service occupations (32.3%); management occupations (except farmers) (20.8%); sales and office occupations (15.5%); legal occupations (9.5%); healthcare practitioners and technical occupations (7.2%); business and financial operations occupations (5.5%); life, physical, and social science occupations (2.7%)
Most popular occupations of females: service occupations (19.3%); management occupations (except farmers) (18.3%); sales and office occupations (12.7%); healthcare practitioners and technical occupations (11.1%); business and financial operations occupations (8.4%); arts, design, entertainment, sports, and media occupations (8.1%); legal occupations (6.3%)
Roads and streets: Interbay Blvd; Nichols St; S Crescent Dr; W Ballast Point Blvd; B Ave; A Ave; Ballast Point Blvd.
Jules Verne Park neighborhood detailed profile
Julian Estates neighborhood in Tampa statistics: (Find on map)
Area: 0.008 square miles
Roads and streets: Harper Pl.
Julian Estates neighborhood detailed profile
Area: 0.008 square miles
Roads and streets: Harper Pl.
Julian Estates neighborhood detailed profile
Kaitlyn Townhomes at North Street neighborhood in Tampa statistics: (Find on map)
Population: 1
Population density:
Median household income in 2021:
Median rent in in 2021:
Most popular occupations of males: management occupations (except farmers) (37.5%); sales and office occupations (30.8%); construction, extraction, and maintenance occupations (15.1%); transportation occupations (7.0%); service occupations (3.8%); material moving occupations (3.8%); business and financial operations occupations (3.3%)
Most popular occupations of females: healthcare practitioners and technical occupations (29.1%); production occupations (23.8%); sales and office occupations (20.1%); service occupations (15.3%); education, training, and library occupations (8.5%); management occupations (except farmers) (5.8%); legal occupations (5.8%)
Kaitlyn Townhomes at North Street neighborhood detailed profile
Population: 1
Population density:
| Kaitlyn Townhomes at North Street: | 5,224 people per square mile |
| Tampa: | 3,454 people per square mile |
Median household income in 2021:
| Kaitlyn Townhomes at North Street: | $68,243 |
| Tampa: | $63,404 |
Median rent in in 2021:
| Kaitlyn Townhomes at North Street: | $838 |
| Tampa: | $1,191 |
Most popular occupations of males: management occupations (except farmers) (37.5%); sales and office occupations (30.8%); construction, extraction, and maintenance occupations (15.1%); transportation occupations (7.0%); service occupations (3.8%); material moving occupations (3.8%); business and financial operations occupations (3.3%)
Most popular occupations of females: healthcare practitioners and technical occupations (29.1%); production occupations (23.8%); sales and office occupations (20.1%); service occupations (15.3%); education, training, and library occupations (8.5%); management occupations (except farmers) (5.8%); legal occupations (5.8%)
Kaitlyn Townhomes at North Street neighborhood detailed profile
Kansas Avenue Townhomes neighborhood in Tampa statistics: (Find on map)
Kansas Avenue Townhomes neighborhood detailed profile
Kansas Avenue Townhomes neighborhood detailed profile
Karen Heights neighborhood in Tampa statistics: (Find on map)
Area: 0.013 square miles
Population: 20
Population density:
Median household income in 2021:
Median rent in in 2021:
Male vs Females
Median age
Most popular occupations of males: service occupations (25.6%); transportation occupations (20.4%); management occupations (except farmers) (15.0%); sales and office occupations (12.0%); material moving occupations (9.4%); architecture and engineering occupations (6.5%); computer and mathematical occupations (5.7%)
Most popular occupations of females: sales and office occupations (33.5%); service occupations (25.6%); transportation occupations (13.3%); arts, design, entertainment, sports, and media occupations (8.4%); education, training, and library occupations (3.7%); management occupations (except farmers) (3.3%); business and financial operations occupations (3.3%)
Roads and streets: Hall Pl.
Karen Heights neighborhood detailed profile
Area: 0.013 square miles
Population: 20
Population density:
| Karen Heights: | 1,503 people per square mile |
| Tampa: | 3,454 people per square mile |
Median household income in 2021:
| Karen Heights: | $39,904 |
| Tampa: | $63,404 |
Median rent in in 2021:
| Karen Heights: | $552 |
| Tampa: | $1,191 |
Male vs Females
| Males: | 7 |
| Females: | 12 |
Median age
| Males: | 32.7 years |
| Females: | 28.8 years |
Most popular occupations of males: service occupations (25.6%); transportation occupations (20.4%); management occupations (except farmers) (15.0%); sales and office occupations (12.0%); material moving occupations (9.4%); architecture and engineering occupations (6.5%); computer and mathematical occupations (5.7%)
Most popular occupations of females: sales and office occupations (33.5%); service occupations (25.6%); transportation occupations (13.3%); arts, design, entertainment, sports, and media occupations (8.4%); education, training, and library occupations (3.7%); management occupations (except farmers) (3.3%); business and financial operations occupations (3.3%)
Roads and streets: Hall Pl.
Karen Heights neighborhood detailed profile
Kathryn Park neighborhood in Tampa statistics: (Find on map)
Area: 0.047 square miles
Population: 108
Population density:
Median household income in 2021:
Median rent in in 2021:
Male vs Females
Median age
Average estimated value of detached houses in 2021 (67.4% of all units):
Most popular occupations of males: construction, extraction, and maintenance occupations (32.0%); service occupations (23.5%); management occupations (except farmers) (11.8%); sales and office occupations (9.3%); transportation occupations (8.6%); material moving occupations (7.3%); arts, design, entertainment, sports, and media occupations (4.8%)
Most popular occupations of females: sales and office occupations (49.1%); service occupations (35.0%); healthcare practitioners and technical occupations (11.2%); business and financial operations occupations (5.3%); legal occupations (3.0%); management occupations (except farmers) (2.8%); transportation occupations (2.8%)
Roads and streets: E Bird St; E Juneau St; N Ogontz Ave; N 19th St; N Hillsboro Ln; E Mulberry Dr.
Kathryn Park neighborhood detailed profile
Area: 0.047 square miles
Population: 108
Population density:
| Kathryn Park: | 2,303 people per square mile |
| Tampa: | 3,454 people per square mile |
Median household income in 2021:
| Kathryn Park: | $56,355 |
| Tampa: | $63,404 |
Median rent in in 2021:
| Kathryn Park: | $1,069 |
| Tampa: | $1,191 |
Male vs Females
| Males: | 46 |
| Females: | 61 |
Median age
| Males: | 39.4 years |
| Females: | 40.8 years |
Average estimated value of detached houses in 2021 (67.4% of all units):
| Kathryn Park: | $178,889 |
| Tampa: | $477,728 |
Most popular occupations of males: construction, extraction, and maintenance occupations (32.0%); service occupations (23.5%); management occupations (except farmers) (11.8%); sales and office occupations (9.3%); transportation occupations (8.6%); material moving occupations (7.3%); arts, design, entertainment, sports, and media occupations (4.8%)
Most popular occupations of females: sales and office occupations (49.1%); service occupations (35.0%); healthcare practitioners and technical occupations (11.2%); business and financial operations occupations (5.3%); legal occupations (3.0%); management occupations (except farmers) (2.8%); transportation occupations (2.8%)
Roads and streets: E Bird St; E Juneau St; N Ogontz Ave; N 19th St; N Hillsboro Ln; E Mulberry Dr.
Kathryn Park neighborhood detailed profile
Kaywood Heights neighborhood in Tampa statistics: (Find on map)
Area: 0.006 square miles
Population: 26
Population density:
Median household income in 2021:
Median rent in in 2021:
Male vs Females
Median age
Housing prices:
Average estimated value of detached houses in 2021 (90.0% of all units):
Most popular occupations of males: service occupations (17.8%); transportation occupations (16.8%); business and financial operations occupations (8.7%); construction, extraction, and maintenance occupations (7.8%); healthcare practitioners and technical occupations (7.6%); computer and mathematical occupations (5.5%); education, training, and library occupations (3.6%)
Most popular occupations of females: sales and office occupations (43.7%); service occupations (30.0%); management occupations (except farmers) (21.1%); healthcare practitioners and technical occupations (11.7%); legal occupations (5.2%); education, training, and library occupations (5.2%); production occupations (5.0%)
Kaywood Heights neighborhood detailed profile
Area: 0.006 square miles
Population: 26
Population density:
| Kaywood Heights: | 4,275 people per square mile |
| Tampa: | 3,454 people per square mile |
Median household income in 2021:
| Kaywood Heights: | $59,394 |
| Tampa: | $63,404 |
Median rent in in 2021:
| Kaywood Heights: | $1,375 |
| Tampa: | $1,191 |
Male vs Females
| Males: | 14 |
| Females: | 11 |
Median age
| Males: | 42.9 years |
| Females: | 35.8 years |
Housing prices:
Average estimated value of detached houses in 2021 (90.0% of all units):
| Kaywood Heights: | $181,570 |
| Tampa: | $477,728 |
Most popular occupations of males: service occupations (17.8%); transportation occupations (16.8%); business and financial operations occupations (8.7%); construction, extraction, and maintenance occupations (7.8%); healthcare practitioners and technical occupations (7.6%); computer and mathematical occupations (5.5%); education, training, and library occupations (3.6%)
Most popular occupations of females: sales and office occupations (43.7%); service occupations (30.0%); management occupations (except farmers) (21.1%); healthcare practitioners and technical occupations (11.7%); legal occupations (5.2%); education, training, and library occupations (5.2%); production occupations (5.0%)
Kaywood Heights neighborhood detailed profile
Kelkath Estates neighborhood in Tampa statistics: (Find on map)
Area: 0.004 square miles
Kelkath Estates neighborhood detailed profile
Area: 0.004 square miles
Kelkath Estates neighborhood detailed profile
Kelly Ridge neighborhood in Tampa statistics: (Find on map)
Area: 0.004 square miles
Population: 12
Population density:
Median household income in 2021:
Median rent in in 2021:
Male vs Females
Median age
Average estimated value of detached houses in 2021 (60.0% of all units):
Most popular occupations of males: construction, extraction, and maintenance occupations (32.0%); service occupations (23.5%); management occupations (except farmers) (11.8%); sales and office occupations (9.3%); transportation occupations (8.6%); material moving occupations (7.2%); arts, design, entertainment, sports, and media occupations (4.8%)
Most popular occupations of females: sales and office occupations (49.1%); service occupations (35.0%); healthcare practitioners and technical occupations (11.2%); business and financial operations occupations (5.3%); legal occupations (3.0%); management occupations (except farmers) (2.8%); transportation occupations (2.8%)
Roads and streets: Kelly Ridge Ln.
Kelly Ridge neighborhood detailed profile
Area: 0.004 square miles
Population: 12
Population density:
| Kelly Ridge: | 3,272 people per square mile |
| Tampa: | 3,454 people per square mile |
Median household income in 2021:
| Kelly Ridge: | $46,719 |
| Tampa: | $63,404 |
Median rent in in 2021:
| Kelly Ridge: | $886 |
| Tampa: | $1,191 |
Male vs Females
| Males: | 5 |
| Females: | 7 |
Median age
| Males: | 32.7 years |
| Females: | 33.8 years |
Average estimated value of detached houses in 2021 (60.0% of all units):
| Kelly Ridge: | $178,889 |
| Tampa: | $477,728 |
Most popular occupations of males: construction, extraction, and maintenance occupations (32.0%); service occupations (23.5%); management occupations (except farmers) (11.8%); sales and office occupations (9.3%); transportation occupations (8.6%); material moving occupations (7.2%); arts, design, entertainment, sports, and media occupations (4.8%)
Most popular occupations of females: sales and office occupations (49.1%); service occupations (35.0%); healthcare practitioners and technical occupations (11.2%); business and financial operations occupations (5.3%); legal occupations (3.0%); management occupations (except farmers) (2.8%); transportation occupations (2.8%)
Roads and streets: Kelly Ridge Ln.
Kelly Ridge neighborhood detailed profile
Kenilworth Grove neighborhood in Tampa statistics: (Find on map)
Area: 0.004 square miles
Population: 36
Population density:
Median household income in 2021:
Median rent in in 2021:
Male vs Females
Median age
Average estimated value of detached houses in 2021 (92.3% of all units):
Most popular occupations of males: education, training, and library occupations (29.1%); sales and office occupations (18.7%); management occupations (except farmers) (17.6%); construction, extraction, and maintenance occupations (13.8%); business and financial operations occupations (13.5%); material moving occupations (7.6%); architecture and engineering occupations (5.2%)
Most popular occupations of females: healthcare practitioners and technical occupations (38.2%); business and financial operations occupations (31.0%); sales and office occupations (14.1%); material moving occupations (12.1%); management occupations (except farmers) (9.8%); service occupations (3.7%); computer and mathematical occupations (3.5%)
Kenilworth Grove neighborhood detailed profile
Area: 0.004 square miles
Population: 36
Population density:
| Kenilworth Grove: | 8,401 people per square mile |
| Tampa: | 3,454 people per square mile |
Median household income in 2021:
| Kenilworth Grove: | $97,583 |
| Tampa: | $63,404 |
Median rent in in 2021:
| Kenilworth Grove: | $1,726 |
| Tampa: | $1,191 |
Male vs Females
| Males: | 18 |
| Females: | 17 |
Median age
| Males: | 28.7 years |
| Females: | 42.1 years |
Average estimated value of detached houses in 2021 (92.3% of all units):
| Kenilworth Grove: | $294,084 |
| Tampa: | $477,728 |
Most popular occupations of males: education, training, and library occupations (29.1%); sales and office occupations (18.7%); management occupations (except farmers) (17.6%); construction, extraction, and maintenance occupations (13.8%); business and financial operations occupations (13.5%); material moving occupations (7.6%); architecture and engineering occupations (5.2%)
Most popular occupations of females: healthcare practitioners and technical occupations (38.2%); business and financial operations occupations (31.0%); sales and office occupations (14.1%); material moving occupations (12.1%); management occupations (except farmers) (9.8%); service occupations (3.7%); computer and mathematical occupations (3.5%)
Kenilworth Grove neighborhood detailed profile
Kennedy Oaks Condo neighborhood in Tampa statistics: (Find on map)
Area: 0.002 square miles
Population: 6
Population density:
Median household income in 2021:
Median rent in in 2021:
Male vs Females
Median age
Housing prices:
Average estimated value of detached houses in 2021 (66.7% of all units):
Average estimated value of townhouses or other attached units in 2021 (33.3% of all units):
Most popular occupations of males: service occupations (23.4%); sales and office occupations (19.9%); management occupations (except farmers) (19.1%); transportation occupations (17.8%); construction, extraction, and maintenance occupations (16.3%); business and financial operations occupations (13.5%); healthcare practitioners and technical occupations (5.7%)
Most popular occupations of females: sales and office occupations (49.7%); service occupations (23.1%); education, training, and library occupations (21.7%); healthcare practitioners and technical occupations (12.4%); production occupations (6.1%); management occupations (except farmers) (5.6%); business and financial operations occupations (4.7%)
Kennedy Oaks Condo neighborhood detailed profile
Area: 0.002 square miles
Population: 6
Population density:
| Kennedy Oaks Condo: | 3,455 people per square mile |
| Tampa: | 3,454 people per square mile |
Median household income in 2021:
| Kennedy Oaks Condo: | $79,250 |
| Tampa: | $63,404 |
Median rent in in 2021:
| Kennedy Oaks Condo: | $1,144 |
| Tampa: | $1,191 |
Male vs Females
| Males: | 3 |
| Females: | 3 |
Median age
| Males: | 36.4 years |
| Females: | 53.3 years |
Housing prices:
Average estimated value of detached houses in 2021 (66.7% of all units):
| Kennedy Oaks Condo: | $267,148 |
| Tampa: | $477,728 |
Average estimated value of townhouses or other attached units in 2021 (33.3% of all units):
| This neighborhood: | $294,554 |
| city: | $499,254 |
Most popular occupations of males: service occupations (23.4%); sales and office occupations (19.9%); management occupations (except farmers) (19.1%); transportation occupations (17.8%); construction, extraction, and maintenance occupations (16.3%); business and financial operations occupations (13.5%); healthcare practitioners and technical occupations (5.7%)
Most popular occupations of females: sales and office occupations (49.7%); service occupations (23.1%); education, training, and library occupations (21.7%); healthcare practitioners and technical occupations (12.4%); production occupations (6.1%); management occupations (except farmers) (5.6%); business and financial operations occupations (4.7%)
Kennedy Oaks Condo neighborhood detailed profile
Kennedy's Tampa Heights neighborhood in Tampa statistics: (Find on map)
Area: 0.020 square miles
Population: 36
Population density:
Median household income in 2021:
Median rent in in 2021:
Male vs Females
Median age
Average estimated value of detached houses in 2021 (12.5% of all units):
Most popular occupations of males: service occupations (28.1%); sales and office occupations (17.7%); management occupations (except farmers) (14.7%); farming, fishing, and forestry occupations (10.1%); transportation occupations (9.2%); production occupations (6.8%); legal occupations (6.1%)
Most popular occupations of females: service occupations (33.0%); sales and office occupations (26.8%); management occupations (except farmers) (15.4%); healthcare practitioners and technical occupations (5.7%); transportation occupations (4.7%); education, training, and library occupations (3.8%); material moving occupations (2.6%)
Kennedy's Tampa Heights neighborhood detailed profile
Area: 0.020 square miles
Population: 36
Population density:
| Kennedy's Tampa Heights: | 1,768 people per square mile |
| Tampa: | 3,454 people per square mile |
Median household income in 2021:
| Kennedy's Tampa Heights: | $8,091 |
| Tampa: | $63,404 |
Median rent in in 2021:
| Kennedy's Tampa Heights: | $189 |
| Tampa: | $1,191 |
Male vs Females
| Males: | 15 |
| Females: | 20 |
Median age
| Males: | 9.9 years |
| Females: | 9.4 years |
Average estimated value of detached houses in 2021 (12.5% of all units):
| Kennedy's Tampa Heights: | $407,571 |
| Tampa: | $477,728 |
Most popular occupations of males: service occupations (28.1%); sales and office occupations (17.7%); management occupations (except farmers) (14.7%); farming, fishing, and forestry occupations (10.1%); transportation occupations (9.2%); production occupations (6.8%); legal occupations (6.1%)
Most popular occupations of females: service occupations (33.0%); sales and office occupations (26.8%); management occupations (except farmers) (15.4%); healthcare practitioners and technical occupations (5.7%); transportation occupations (4.7%); education, training, and library occupations (3.8%); material moving occupations (2.6%)
Kennedy's Tampa Heights neighborhood detailed profile
Kensington Park Soho Townhomes neighborhood in Tampa statistics: (Find on map)
Area: 0.001 square miles
Kensington Park Soho Townhomes neighborhood detailed profile
Area: 0.001 square miles
Kensington Park Soho Townhomes neighborhood detailed profile
Key's neighborhood in Tampa statistics: (Find on map)
Area: 0.001 square miles
Population: 20
Population density:
Median household income in 2021:
Median rent in in 2021:
Male vs Females
Median age
Average estimated value of detached houses in 2021 (10.0% of all units):
Most popular occupations of males: service occupations (34.2%); sales and office occupations (21.7%); farming, fishing, and forestry occupations (13.8%); transportation occupations (10.5%); production occupations (9.2%); legal occupations (3.9%); management occupations (except farmers) (3.3%)
Most popular occupations of females: service occupations (40.7%); sales and office occupations (20.8%); management occupations (except farmers) (19.0%); arts, design, entertainment, sports, and media occupations (3.8%); education, training, and library occupations (3.7%); healthcare practitioners and technical occupations (3.7%); transportation occupations (3.7%)
Key's neighborhood detailed profile
Area: 0.001 square miles
Population: 20
Population density:
| Key's: | 16,991 people per square mile |
| Tampa: | 3,454 people per square mile |
Median household income in 2021:
| Key's: | $19,531 |
| Tampa: | $63,404 |
Median rent in in 2021:
| Key's: | $632 |
| Tampa: | $1,191 |
Male vs Females
| Males: | 9 |
| Females: | 11 |
Median age
| Males: | 33.5 years |
| Females: | 39.1 years |
Average estimated value of detached houses in 2021 (10.0% of all units):
| Key's: | $445,098 |
| Tampa: | $477,728 |
Most popular occupations of males: service occupations (34.2%); sales and office occupations (21.7%); farming, fishing, and forestry occupations (13.8%); transportation occupations (10.5%); production occupations (9.2%); legal occupations (3.9%); management occupations (except farmers) (3.3%)
Most popular occupations of females: service occupations (40.7%); sales and office occupations (20.8%); management occupations (except farmers) (19.0%); arts, design, entertainment, sports, and media occupations (3.8%); education, training, and library occupations (3.7%); healthcare practitioners and technical occupations (3.7%); transportation occupations (3.7%)
Key's neighborhood detailed profile
Keys at Harbour Island neighborhood in Tampa statistics: (Find on map)
Area: 0.009 square miles
Population: 35
Population density:
Median household income in 2021:
Median rent in in 2021:
Male vs Females
Median age
Housing prices:
Average estimated value of townhouses or other attached units in 2021 (17.9% of all units):
Average estimated '21 value of housing units in 5-or-more-unit structures (89.3% of all units):
Most popular occupations of males: sales and office occupations (30.6%); management occupations (except farmers) (29.0%); business and financial operations occupations (11.6%); architecture and engineering occupations (7.9%); legal occupations (6.3%); healthcare practitioners and technical occupations (5.7%); service occupations (3.3%)
Most popular occupations of females: sales and office occupations (40.2%); business and financial operations occupations (18.8%); management occupations (except farmers) (11.7%); legal occupations (9.7%); healthcare practitioners and technical occupations (5.9%); arts, design, entertainment, sports, and media occupations (5.7%); computer and mathematical occupations (3.8%)
Roads and streets: Hemingway Cir.
Keys at Harbour Island neighborhood detailed profile
Area: 0.009 square miles
Population: 35
Population density:
| Keys at Harbour Island: | 4,074 people per square mile |
| Tampa: | 3,454 people per square mile |
Median household income in 2021:
| Keys at Harbour Island: | $105,375 |
| Tampa: | $63,404 |
Median rent in in 2021:
| Keys at Harbour Island: | $1,908 |
| Tampa: | $1,191 |
Male vs Females
| Males: | 18 |
| Females: | 16 |
Median age
| Males: | 41.9 years |
| Females: | 35.0 years |
Housing prices:
Average estimated value of townhouses or other attached units in 2021 (17.9% of all units):
| This neighborhood: | $570,089 |
| city: | $499,254 |
Average estimated '21 value of housing units in 5-or-more-unit structures (89.3% of all units):
| Keys at Harbour Island: | $333,338 |
| Tampa: | $443,026 |
Most popular occupations of males: sales and office occupations (30.6%); management occupations (except farmers) (29.0%); business and financial operations occupations (11.6%); architecture and engineering occupations (7.9%); legal occupations (6.3%); healthcare practitioners and technical occupations (5.7%); service occupations (3.3%)
Most popular occupations of females: sales and office occupations (40.2%); business and financial operations occupations (18.8%); management occupations (except farmers) (11.7%); legal occupations (9.7%); healthcare practitioners and technical occupations (5.9%); arts, design, entertainment, sports, and media occupations (5.7%); computer and mathematical occupations (3.8%)
Roads and streets: Hemingway Cir.
Keys at Harbour Island neighborhood detailed profile
Keystone Homes I neighborhood in Tampa statistics: (Find on map)
Area: 0.001 square miles
Median household income in 2021:
Median rent in in 2021:
Most popular occupations of males: sales and office occupations (33.7%); healthcare practitioners and technical occupations (22.3%); management occupations (except farmers) (19.3%); legal occupations (14.4%); computer and mathematical occupations (11.5%); transportation occupations (10.4%); arts, design, entertainment, sports, and media occupations (7.3%)
Most popular occupations of females: sales and office occupations (48.9%); community and social services occupations (44.3%); healthcare practitioners and technical occupations (36.4%); management occupations (except farmers) (21.5%); service occupations (19.0%); legal occupations (17.7%); education, training, and library occupations (16.5%)
Keystone Homes I neighborhood detailed profile
Area: 0.001 square miles
Median household income in 2021:
| Keystone Homes I: | $250,001 |
| Tampa: | $63,404 |
Median rent in in 2021:
| Keystone Homes I: | $1,716 |
| Tampa: | $1,191 |
Most popular occupations of males: sales and office occupations (33.7%); healthcare practitioners and technical occupations (22.3%); management occupations (except farmers) (19.3%); legal occupations (14.4%); computer and mathematical occupations (11.5%); transportation occupations (10.4%); arts, design, entertainment, sports, and media occupations (7.3%)
Most popular occupations of females: sales and office occupations (48.9%); community and social services occupations (44.3%); healthcare practitioners and technical occupations (36.4%); management occupations (except farmers) (21.5%); service occupations (19.0%); legal occupations (17.7%); education, training, and library occupations (16.5%)
Keystone Homes I neighborhood detailed profile
Kimberly Lane neighborhood in Tampa statistics: (Find on map)
Area: 0.007 square miles
Kimberly Lane neighborhood detailed profile
Area: 0.007 square miles
Kimberly Lane neighborhood detailed profile
Kimberly Park neighborhood in Tampa statistics: (Find on map)
Median household income in 2021:
Median rent in in 2021:
Most popular occupations of males: service occupations (53.2%); sales and office occupations (20.7%); legal occupations (7.8%); healthcare practitioners and technical occupations (7.2%); management occupations (except farmers) (4.1%); computer and mathematical occupations (2.5%); business and financial operations occupations (2.3%)
Most popular occupations of females: service occupations (29.1%); management occupations (except farmers) (20.6%); healthcare practitioners and technical occupations (11.1%); business and financial operations occupations (10.1%); legal occupations (9.5%); architecture and engineering occupations (6.8%); computer and mathematical occupations (5.4%)
Kimberly Park neighborhood detailed profile
Median household income in 2021:
| Kimberly Park: | $101,667 |
| Tampa: | $63,404 |
Median rent in in 2021:
| Kimberly Park: | $1,765 |
| Tampa: | $1,191 |
Most popular occupations of males: service occupations (53.2%); sales and office occupations (20.7%); legal occupations (7.8%); healthcare practitioners and technical occupations (7.2%); management occupations (except farmers) (4.1%); computer and mathematical occupations (2.5%); business and financial operations occupations (2.3%)
Most popular occupations of females: service occupations (29.1%); management occupations (except farmers) (20.6%); healthcare practitioners and technical occupations (11.1%); business and financial operations occupations (10.1%); legal occupations (9.5%); architecture and engineering occupations (6.8%); computer and mathematical occupations (5.4%)
Kimberly Park neighborhood detailed profile
Kings's Forest neighborhood in Tampa statistics: (Find on map)
Area: 0.119 square miles
Population: 225
Population density:
Median household income in 2021:
Median rent in in 2021:
Male vs Females
Median age
Average estimated value of detached houses in 2021 (89.6% of all units):
Most popular occupations of males: transportation occupations (26.1%); service occupations (24.3%); sales and office occupations (15.2%); management occupations (except farmers) (10.7%); construction, extraction, and maintenance occupations (7.9%); computer and mathematical occupations (4.3%); material moving occupations (4.3%)
Most popular occupations of females: healthcare practitioners and technical occupations (31.0%); sales and office occupations (22.6%); management occupations (except farmers) (12.1%); production occupations (10.9%); service occupations (10.5%); business and financial operations occupations (7.9%); construction, extraction, and maintenance occupations (7.3%)
Roads and streets: Downing Cir; Fawn Cir; Empire Pl; Cromwell Dr; Walis Pl; Sane Pl; Tudor Pl; Thames Pl; Berkley Dr.
Kings's Forest neighborhood detailed profile
Area: 0.119 square miles
Population: 225
Population density:
| Kings's Forest: | 1,895 people per square mile |
| Tampa: | 3,454 people per square mile |
Median household income in 2021:
| Kings's Forest: | $50,162 |
| Tampa: | $63,404 |
Median rent in in 2021:
| Kings's Forest: | $928 |
| Tampa: | $1,191 |
Male vs Females
| Males: | 124 |
| Females: | 101 |
Median age
| Males: | 55.3 years |
| Females: | 40.8 years |
Average estimated value of detached houses in 2021 (89.6% of all units):
| Kings's Forest: | $157,151 |
| Tampa: | $477,728 |
Most popular occupations of males: transportation occupations (26.1%); service occupations (24.3%); sales and office occupations (15.2%); management occupations (except farmers) (10.7%); construction, extraction, and maintenance occupations (7.9%); computer and mathematical occupations (4.3%); material moving occupations (4.3%)
Most popular occupations of females: healthcare practitioners and technical occupations (31.0%); sales and office occupations (22.6%); management occupations (except farmers) (12.1%); production occupations (10.9%); service occupations (10.5%); business and financial operations occupations (7.9%); construction, extraction, and maintenance occupations (7.3%)
Roads and streets: Downing Cir; Fawn Cir; Empire Pl; Cromwell Dr; Walis Pl; Sane Pl; Tudor Pl; Thames Pl; Berkley Dr.
Kings's Forest neighborhood detailed profile
Kingston Court Villas neighborhood in Tampa statistics: (Find on map)
Population: 5
Population density:
Median household income in 2021:
Median rent in in 2021:
Male vs Females
Median age
Most popular occupations of males: service occupations (21.8%); management occupations (except farmers) (16.8%); healthcare practitioners and technical occupations (15.7%); legal occupations (14.7%); sales and office occupations (14.7%); business and financial operations occupations (5.6%); architecture and engineering occupations (5.6%)
Most popular occupations of females: business and financial operations occupations (20.3%); management occupations (except farmers) (17.1%); legal occupations (13.9%); education, training, and library occupations (13.6%); healthcare practitioners and technical occupations (13.1%); sales and office occupations (13.1%); service occupations (6.7%)
Kingston Court Villas neighborhood detailed profile
Population: 5
Population density:
| Kingston Court Villas: | 6,069 people per square mile |
| Tampa: | 3,454 people per square mile |
Median household income in 2021:
| Kingston Court Villas: | $116,212 |
| Tampa: | $63,404 |
Median rent in in 2021:
| Kingston Court Villas: | $1,220 |
| Tampa: | $1,191 |
Male vs Females
| Males: | 2 |
| Females: | 3 |
Median age
| Males: | 31.9 years |
| Females: | 32.2 years |
Most popular occupations of males: service occupations (21.8%); management occupations (except farmers) (16.8%); healthcare practitioners and technical occupations (15.7%); legal occupations (14.7%); sales and office occupations (14.7%); business and financial operations occupations (5.6%); architecture and engineering occupations (5.6%)
Most popular occupations of females: business and financial operations occupations (20.3%); management occupations (except farmers) (17.1%); legal occupations (13.9%); education, training, and library occupations (13.6%); healthcare practitioners and technical occupations (13.1%); sales and office occupations (13.1%); service occupations (6.7%)
Kingston Court Villas neighborhood detailed profile
Kingston Heights neighborhood in Tampa statistics: (Find on map)
Area: 0.038 square miles
Population: 238
Population density:
Median household income in 2021:
Median rent in in 2021:
Male vs Females
Median age
Most popular occupations of males: construction, extraction, and maintenance occupations (23.2%); material moving occupations (20.9%); sales and office occupations (18.6%); transportation occupations (5.9%); business and financial operations occupations (4.9%); service occupations (4.6%); architecture and engineering occupations (4.4%)
Most popular occupations of females: service occupations (33.3%); transportation occupations (16.4%); healthcare practitioners and technical occupations (15.8%); sales and office occupations (14.1%); education, training, and library occupations (11.8%); material moving occupations (9.6%); business and financial operations occupations (8.2%)
Roads and streets: S 69th St; Kingston Dr; Ferlita Way.
Kingston Heights neighborhood detailed profile
Area: 0.038 square miles
Population: 238
Population density:
| Kingston Heights: | 6,274 people per square mile |
| Tampa: | 3,454 people per square mile |
Median household income in 2021:
| Kingston Heights: | $45,161 |
| Tampa: | $63,404 |
Median rent in in 2021:
| Kingston Heights: | $910 |
| Tampa: | $1,191 |
Male vs Females
| Males: | 148 |
| Females: | 90 |
Median age
| Males: | 40.1 years |
| Females: | 48.1 years |
Most popular occupations of males: construction, extraction, and maintenance occupations (23.2%); material moving occupations (20.9%); sales and office occupations (18.6%); transportation occupations (5.9%); business and financial operations occupations (4.9%); service occupations (4.6%); architecture and engineering occupations (4.4%)
Most popular occupations of females: service occupations (33.3%); transportation occupations (16.4%); healthcare practitioners and technical occupations (15.8%); sales and office occupations (14.1%); education, training, and library occupations (11.8%); material moving occupations (9.6%); business and financial operations occupations (8.2%)
Roads and streets: S 69th St; Kingston Dr; Ferlita Way.
Kingston Heights neighborhood detailed profile
Kingwood Park neighborhood in Tampa statistics: (Find on map)
Area: 0.017 square miles
Population: 98
Population density:
Median household income in 2021:
Median rent in in 2021:
Male vs Females
Median age
Most popular occupations of males: sales and office occupations (28.7%); management occupations (except farmers) (25.1%); construction, extraction, and maintenance occupations (16.0%); service occupations (10.5%); transportation occupations (8.5%); computer and mathematical occupations (8.0%); material moving occupations (5.4%)
Most popular occupations of females: sales and office occupations (76.0%); material moving occupations (7.6%); healthcare practitioners and technical occupations (6.1%); service occupations (5.9%); farming, fishing, and forestry occupations (5.9%); legal occupations (4.9%); production occupations (3.8%)
Kingwood Park neighborhood detailed profile
Area: 0.017 square miles
Population: 98
Population density:
| Kingwood Park: | 5,667 people per square mile |
| Tampa: | 3,454 people per square mile |
Median household income in 2021:
| Kingwood Park: | $41,154 |
| Tampa: | $63,404 |
Median rent in in 2021:
| Kingwood Park: | $880 |
| Tampa: | $1,191 |
Male vs Females
| Males: | 45 |
| Females: | 53 |
Median age
| Males: | 31.2 years |
| Females: | 31.8 years |
Most popular occupations of males: sales and office occupations (28.7%); management occupations (except farmers) (25.1%); construction, extraction, and maintenance occupations (16.0%); service occupations (10.5%); transportation occupations (8.5%); computer and mathematical occupations (8.0%); material moving occupations (5.4%)
Most popular occupations of females: sales and office occupations (76.0%); material moving occupations (7.6%); healthcare practitioners and technical occupations (6.1%); service occupations (5.9%); farming, fishing, and forestry occupations (5.9%); legal occupations (4.9%); production occupations (3.8%)
Kingwood Park neighborhood detailed profile
Kinsport Townhomes neighborhood in Tampa statistics: (Find on map)
Area: 0.005 square miles
Population: 33
Population density:
Median household income in 2021:
Median rent in in 2021:
Male vs Females
Median age
Most popular occupations of males: construction, extraction, and maintenance occupations (25.0%); sales and office occupations (18.8%); service occupations (15.6%); transportation occupations (14.3%); arts, design, entertainment, sports, and media occupations (4.6%); healthcare practitioners and technical occupations (4.5%); material moving occupations (4.5%)
Most popular occupations of females: service occupations (32.6%); sales and office occupations (21.2%); management occupations (except farmers) (10.9%); production occupations (10.4%); material moving occupations (7.9%); farming, fishing, and forestry occupations (5.9%); healthcare practitioners and technical occupations (3.9%)
Kinsport Townhomes neighborhood detailed profile
Area: 0.005 square miles
Population: 33
Population density:
| Kinsport Townhomes: | 7,000 people per square mile |
| Tampa: | 3,454 people per square mile |
Median household income in 2021:
| Kinsport Townhomes: | $33,429 |
| Tampa: | $63,404 |
Median rent in in 2021:
| Kinsport Townhomes: | $974 |
| Tampa: | $1,191 |
Male vs Females
| Males: | 17 |
| Females: | 15 |
Median age
| Males: | 44.4 years |
| Females: | 45.6 years |
Most popular occupations of males: construction, extraction, and maintenance occupations (25.0%); sales and office occupations (18.8%); service occupations (15.6%); transportation occupations (14.3%); arts, design, entertainment, sports, and media occupations (4.6%); healthcare practitioners and technical occupations (4.5%); material moving occupations (4.5%)
Most popular occupations of females: service occupations (32.6%); sales and office occupations (21.2%); management occupations (except farmers) (10.9%); production occupations (10.4%); material moving occupations (7.9%); farming, fishing, and forestry occupations (5.9%); healthcare practitioners and technical occupations (3.9%)
Kinsport Townhomes neighborhood detailed profile
Knight's Landing neighborhood in Tampa statistics: (Find on map)
Median household income in 2021:
Median rent in in 2021:
Most popular occupations of males: sales and office occupations (25.2%); service occupations (17.8%); management occupations (except farmers) (14.6%); legal occupations (14.0%); healthcare practitioners and technical occupations (14.0%); business and financial operations occupations (7.2%); architecture and engineering occupations (2.2%)
Most popular occupations of females: service occupations (33.3%); management occupations (except farmers) (25.6%); sales and office occupations (21.7%); healthcare practitioners and technical occupations (12.0%); business and financial operations occupations (11.0%); computer and mathematical occupations (8.2%); education, training, and library occupations (4.5%)
Knight's Landing neighborhood detailed profile
Median household income in 2021:
| Knight's Landing: | $62,446 |
| Tampa: | $63,404 |
Median rent in in 2021:
| Knight's Landing: | $1,392 |
| Tampa: | $1,191 |
Most popular occupations of males: sales and office occupations (25.2%); service occupations (17.8%); management occupations (except farmers) (14.6%); legal occupations (14.0%); healthcare practitioners and technical occupations (14.0%); business and financial operations occupations (7.2%); architecture and engineering occupations (2.2%)
Most popular occupations of females: service occupations (33.3%); management occupations (except farmers) (25.6%); sales and office occupations (21.7%); healthcare practitioners and technical occupations (12.0%); business and financial operations occupations (11.0%); computer and mathematical occupations (8.2%); education, training, and library occupations (4.5%)
Knight's Landing neighborhood detailed profile
Knollwood neighborhood in Tampa statistics: (Find on map)
Area: 0.022 square miles
Population: 32
Population density:
Median household income in 2021:
Median rent in in 2021:
Male vs Females
Median age
Housing prices:
Average estimated value of detached houses in 2021 (90.9% of all units):
Average estimated value of townhouses or other attached units in 2021 (4.5% of all units):
Most popular occupations of males: management occupations (except farmers) (32.4%); construction, extraction, and maintenance occupations (27.9%); education, training, and library occupations (12.6%); service occupations (9.0%); computer and mathematical occupations (7.2%); business and financial operations occupations (6.3%); architecture and engineering occupations (5.2%)
Most popular occupations of females: education, training, and library occupations (35.9%); service occupations (21.7%); community and social services occupations (18.5%); management occupations (except farmers) (18.4%); healthcare practitioners and technical occupations (9.8%); sales and office occupations (7.6%); arts, design, entertainment, sports, and media occupations (7.0%)
Roads and streets: E Knollwood St; Elizabeth St.
Knollwood neighborhood detailed profile
Area: 0.022 square miles
Population: 32
Population density:
| Knollwood: | 1,488 people per square mile |
| Tampa: | 3,454 people per square mile |
Median household income in 2021:
| Knollwood: | $84,807 |
| Tampa: | $63,404 |
Median rent in in 2021:
| Knollwood: | $1,146 |
| Tampa: | $1,191 |
Male vs Females
| Males: | 16 |
| Females: | 16 |
Median age
| Males: | 65.6 years |
| Females: | 54.2 years |
Housing prices:
Average estimated value of detached houses in 2021 (90.9% of all units):
| Knollwood: | $388,094 |
| Tampa: | $477,728 |
Average estimated value of townhouses or other attached units in 2021 (4.5% of all units):
| This neighborhood: | $60,791 |
| city: | $499,254 |
Most popular occupations of males: management occupations (except farmers) (32.4%); construction, extraction, and maintenance occupations (27.9%); education, training, and library occupations (12.6%); service occupations (9.0%); computer and mathematical occupations (7.2%); business and financial operations occupations (6.3%); architecture and engineering occupations (5.2%)
Most popular occupations of females: education, training, and library occupations (35.9%); service occupations (21.7%); community and social services occupations (18.5%); management occupations (except farmers) (18.4%); healthcare practitioners and technical occupations (9.8%); sales and office occupations (7.6%); arts, design, entertainment, sports, and media occupations (7.0%)
Roads and streets: E Knollwood St; Elizabeth St.
Knollwood neighborhood detailed profile
Knollwood Estates neighborhood in Tampa statistics: (Find on map)
Population: 4
Population density:
Median household income in 2021:
Median rent in in 2021:
Male vs Females
Median age
Average estimated value of detached houses in 2021 (100.0% of all units):
Most popular occupations of males: service occupations (32.3%); sales and office occupations (25.7%); education, training, and library occupations (17.4%); construction, extraction, and maintenance occupations (8.4%); business and financial operations occupations (7.8%); management occupations (except farmers) (6.9%); production occupations (6.0%)
Most popular occupations of females: sales and office occupations (26.3%); business and financial operations occupations (24.5%); healthcare practitioners and technical occupations (19.8%); education, training, and library occupations (15.5%); service occupations (5.8%); community and social services occupations (5.4%); transportation occupations (4.4%)
Knollwood Estates neighborhood detailed profile
Population: 4
Population density:
| Knollwood Estates: | 4,193 people per square mile |
| Tampa: | 3,454 people per square mile |
Median household income in 2021:
| Knollwood Estates: | $43,495 |
| Tampa: | $63,404 |
Median rent in in 2021:
| Knollwood Estates: | $995 |
| Tampa: | $1,191 |
Male vs Females
| Males: | 1 |
| Females: | 2 |
Median age
| Males: | 22.3 years |
| Females: | 21.7 years |
Average estimated value of detached houses in 2021 (100.0% of all units):
| Knollwood Estates: | $205,766 |
| Tampa: | $477,728 |
Most popular occupations of males: service occupations (32.3%); sales and office occupations (25.7%); education, training, and library occupations (17.4%); construction, extraction, and maintenance occupations (8.4%); business and financial operations occupations (7.8%); management occupations (except farmers) (6.9%); production occupations (6.0%)
Most popular occupations of females: sales and office occupations (26.3%); business and financial operations occupations (24.5%); healthcare practitioners and technical occupations (19.8%); education, training, and library occupations (15.5%); service occupations (5.8%); community and social services occupations (5.4%); transportation occupations (4.4%)
Knollwood Estates neighborhood detailed profile
Krentel Park neighborhood in Tampa statistics: (Find on map)
Area: 0.012 square miles
Population: 72
Population density:
Median household income in 2021:
Median rent in in 2021:
Male vs Females
Median age
Most popular occupations of males: management occupations (except farmers) (21.5%); sales and office occupations (14.2%); business and financial operations occupations (13.0%); legal occupations (10.7%); service occupations (10.1%); healthcare practitioners and technical occupations (7.5%); computer and mathematical occupations (4.7%)
Most popular occupations of females: healthcare practitioners and technical occupations (23.6%); legal occupations (12.9%); sales and office occupations (12.9%); management occupations (except farmers) (12.1%); service occupations (11.7%); business and financial operations occupations (10.6%); education, training, and library occupations (8.0%)
Krentel Park neighborhood detailed profile
Area: 0.012 square miles
Population: 72
Population density:
| Krentel Park: | 5,774 people per square mile |
| Tampa: | 3,454 people per square mile |
Median household income in 2021:
| Krentel Park: | $116,212 |
| Tampa: | $63,404 |
Median rent in in 2021:
| Krentel Park: | $1,203 |
| Tampa: | $1,191 |
Male vs Females
| Males: | 33 |
| Females: | 39 |
Median age
| Males: | 37.6 years |
| Females: | 38.1 years |
Most popular occupations of males: management occupations (except farmers) (21.5%); sales and office occupations (14.2%); business and financial operations occupations (13.0%); legal occupations (10.7%); service occupations (10.1%); healthcare practitioners and technical occupations (7.5%); computer and mathematical occupations (4.7%)
Most popular occupations of females: healthcare practitioners and technical occupations (23.6%); legal occupations (12.9%); sales and office occupations (12.9%); management occupations (except farmers) (12.1%); service occupations (11.7%); business and financial operations occupations (10.6%); education, training, and library occupations (8.0%)
Krentel Park neighborhood detailed profile
Kruse Elise Acreage neighborhood in Tampa statistics: (Find on map)
Area: 0.005 square miles
Population: 10
Population density:
Median household income in 2021:
Median rent in in 2021:
Male vs Females
Median age
Most popular occupations of males: management occupations (except farmers) (58.1%); sales and office occupations (24.4%); legal occupations (21.2%); healthcare practitioners and technical occupations (17.9%); business and financial operations occupations (15.6%); education, training, and library occupations (8.4%); production occupations (6.3%)
Most popular occupations of females: healthcare practitioners and technical occupations (38.8%); business and financial operations occupations (34.3%); management occupations (except farmers) (16.7%); legal occupations (6.5%); education, training, and library occupations (6.1%); sales and office occupations (3.7%); arts, design, entertainment, sports, and media occupations (2.0%)
Kruse Elise Acreage neighborhood detailed profile
Area: 0.005 square miles
Population: 10
Population density:
| Kruse Elise Acreage: | 2,021 people per square mile |
| Tampa: | 3,454 people per square mile |
Median household income in 2021:
| Kruse Elise Acreage: | $156,406 |
| Tampa: | $63,404 |
Median rent in in 2021:
| Kruse Elise Acreage: | $3,501 |
| Tampa: | $1,191 |
Male vs Females
| Males: | 4 |
| Females: | 5 |
Median age
| Males: | 43.2 years |
| Females: | 41.2 years |
Most popular occupations of males: management occupations (except farmers) (58.1%); sales and office occupations (24.4%); legal occupations (21.2%); healthcare practitioners and technical occupations (17.9%); business and financial operations occupations (15.6%); education, training, and library occupations (8.4%); production occupations (6.3%)
Most popular occupations of females: healthcare practitioners and technical occupations (38.8%); business and financial operations occupations (34.3%); management occupations (except farmers) (16.7%); legal occupations (6.5%); education, training, and library occupations (6.1%); sales and office occupations (3.7%); arts, design, entertainment, sports, and media occupations (2.0%)
Kruse Elise Acreage neighborhood detailed profile
L A M Industrial Park neighborhood in Tampa statistics: (Find on map)
Area: 0.005 square miles
Population: 1
Population density:
Median household income in 2021:
Median rent in in 2021:
Most popular occupations of males: sales and office occupations (39.3%); material moving occupations (34.1%); service occupations (26.6%); production occupations (17.8%); management occupations (except farmers) (15.0%); business and financial operations occupations (14.0%); architecture and engineering occupations (11.6%)
Most popular occupations of females: arts, design, entertainment, sports, and media occupations (34.7%); business and financial operations occupations (30.3%); sales and office occupations (30.1%); service occupations (16.2%); management occupations (except farmers) (9.2%); education, training, and library occupations (5.8%); healthcare practitioners and technical occupations (4.0%)
L A M Industrial Park neighborhood detailed profile
Area: 0.005 square miles
Population: 1
Population density:
| L A M Industrial Park: | 189 people per square mile |
| Tampa: | 3,454 people per square mile |
Median household income in 2021:
| L A M Industrial Park: | $37,765 |
| Tampa: | $63,404 |
Median rent in in 2021:
| L A M Industrial Park: | $948 |
| Tampa: | $1,191 |
Most popular occupations of males: sales and office occupations (39.3%); material moving occupations (34.1%); service occupations (26.6%); production occupations (17.8%); management occupations (except farmers) (15.0%); business and financial operations occupations (14.0%); architecture and engineering occupations (11.6%)
Most popular occupations of females: arts, design, entertainment, sports, and media occupations (34.7%); business and financial operations occupations (30.3%); sales and office occupations (30.1%); service occupations (16.2%); management occupations (except farmers) (9.2%); education, training, and library occupations (5.8%); healthcare practitioners and technical occupations (4.0%)
L A M Industrial Park neighborhood detailed profile
La Belle Terrace neighborhood in Tampa statistics: (Find on map)
Area: 0.010 square miles
Population: 34
Population density:
Median household income in 2021:
Median rent in in 2021:
Male vs Females
Median age
Most popular occupations of males: sales and office occupations (19.8%); service occupations (16.9%); management occupations (except farmers) (14.5%); healthcare practitioners and technical occupations (13.2%); business and financial operations occupations (9.4%); computer and mathematical occupations (7.3%); construction, extraction, and maintenance occupations (5.6%)
Most popular occupations of females: management occupations (except farmers) (21.5%); service occupations (16.1%); healthcare practitioners and technical occupations (14.7%); sales and office occupations (14.4%); education, training, and library occupations (10.3%); legal occupations (6.9%); business and financial operations occupations (6.8%)
La Belle Terrace neighborhood detailed profile
Area: 0.010 square miles
Population: 34
Population density:
| La Belle Terrace: | 3,463 people per square mile |
| Tampa: | 3,454 people per square mile |
Median household income in 2021:
| La Belle Terrace: | $78,669 |
| Tampa: | $63,404 |
Median rent in in 2021:
| La Belle Terrace: | $1,186 |
| Tampa: | $1,191 |
Male vs Females
| Males: | 18 |
| Females: | 15 |
Median age
| Males: | 40.4 years |
| Females: | 39.5 years |
Most popular occupations of males: sales and office occupations (19.8%); service occupations (16.9%); management occupations (except farmers) (14.5%); healthcare practitioners and technical occupations (13.2%); business and financial operations occupations (9.4%); computer and mathematical occupations (7.3%); construction, extraction, and maintenance occupations (5.6%)
Most popular occupations of females: management occupations (except farmers) (21.5%); service occupations (16.1%); healthcare practitioners and technical occupations (14.7%); sales and office occupations (14.4%); education, training, and library occupations (10.3%); legal occupations (6.9%); business and financial operations occupations (6.8%)
La Belle Terrace neighborhood detailed profile
La Casa neighborhood in Tampa statistics: (Find on map)
Area: 0.051 square miles
Population: 378
Population density:
Median household income in 2021:
Median rent in in 2021:
Male vs Females
Median age
Average estimated value of detached houses in 2021 (44.0% of all units):
Most popular occupations of males: construction, extraction, and maintenance occupations (26.4%); arts, design, entertainment, sports, and media occupations (19.1%); service occupations (17.6%); business and financial operations occupations (10.3%); sales and office occupations (9.6%); healthcare practitioners and technical occupations (9.5%); farming, fishing, and forestry occupations (7.2%)
Most popular occupations of females: service occupations (32.9%); sales and office occupations (28.2%); healthcare practitioners and technical occupations (13.7%); management occupations (except farmers) (9.9%); material moving occupations (8.4%); education, training, and library occupations (6.8%); business and financial operations occupations (3.7%)
Roads and streets: N 17th St; E 12th Ave; N 16th St; E 14th Ave; E 15th Ave; E 13th Ave; Hacienda Ct.
La Casa neighborhood detailed profile
Area: 0.051 square miles
Population: 378
Population density:
| La Casa: | 7,480 people per square mile |
| Tampa: | 3,454 people per square mile |
Median household income in 2021:
| La Casa: | $23,376 |
| Tampa: | $63,404 |
Median rent in in 2021:
| La Casa: | $560 |
| Tampa: | $1,191 |
Male vs Females
| Males: | 187 |
| Females: | 190 |
Median age
| Males: | 40.8 years |
| Females: | 36.3 years |
Average estimated value of detached houses in 2021 (44.0% of all units):
| La Casa: | $297,327 |
| Tampa: | $477,728 |
Most popular occupations of males: construction, extraction, and maintenance occupations (26.4%); arts, design, entertainment, sports, and media occupations (19.1%); service occupations (17.6%); business and financial operations occupations (10.3%); sales and office occupations (9.6%); healthcare practitioners and technical occupations (9.5%); farming, fishing, and forestry occupations (7.2%)
Most popular occupations of females: service occupations (32.9%); sales and office occupations (28.2%); healthcare practitioners and technical occupations (13.7%); management occupations (except farmers) (9.9%); material moving occupations (8.4%); education, training, and library occupations (6.8%); business and financial operations occupations (3.7%)
Roads and streets: N 17th St; E 12th Ave; N 16th St; E 14th Ave; E 15th Ave; E 13th Ave; Hacienda Ct.
La Casa neighborhood detailed profile
La Paloma neighborhood in Tampa statistics: (Find on map)
Area: 0.014 square miles
Population: 120
Population density:
Median household income in 2021:
Median rent in in 2021:
Male vs Females
Median age
Most popular occupations of males: construction, extraction, and maintenance occupations (44.1%); sales and office occupations (19.8%); transportation occupations (10.8%); service occupations (9.6%); material moving occupations (8.6%); management occupations (except farmers) (3.7%); computer and mathematical occupations (1.9%)
Most popular occupations of females: sales and office occupations (48.1%); service occupations (23.7%); healthcare practitioners and technical occupations (13.3%); construction, extraction, and maintenance occupations (8.2%); transportation occupations (7.6%); education, training, and library occupations (7.4%); production occupations (7.0%)
La Paloma neighborhood detailed profile
Area: 0.014 square miles
Population: 120
Population density:
| La Paloma: | 8,457 people per square mile |
| Tampa: | 3,454 people per square mile |
Median household income in 2021:
| La Paloma: | $23,819 |
| Tampa: | $63,404 |
Median rent in in 2021:
| La Paloma: | $695 |
| Tampa: | $1,191 |
Male vs Females
| Males: | 60 |
| Females: | 60 |
Median age
| Males: | 43.8 years |
| Females: | 58.4 years |
Most popular occupations of males: construction, extraction, and maintenance occupations (44.1%); sales and office occupations (19.8%); transportation occupations (10.8%); service occupations (9.6%); material moving occupations (8.6%); management occupations (except farmers) (3.7%); computer and mathematical occupations (1.9%)
Most popular occupations of females: sales and office occupations (48.1%); service occupations (23.7%); healthcare practitioners and technical occupations (13.3%); construction, extraction, and maintenance occupations (8.2%); transportation occupations (7.6%); education, training, and library occupations (7.4%); production occupations (7.0%)
La Paloma neighborhood detailed profile
La Rentree II Townhomes neighborhood in Tampa statistics: (Find on map)
Population: 5
Population density:
Median household income in 2021:
Median rent in in 2021:
Male vs Females
Median age
Housing prices:
Most popular occupations of males: service occupations (42.1%); sales and office occupations (16.4%); production occupations (8.6%); management occupations (except farmers) (7.3%); construction, extraction, and maintenance occupations (5.8%); computer and mathematical occupations (5.5%); architecture and engineering occupations (4.9%)
Most popular occupations of females: service occupations (24.1%); sales and office occupations (21.9%); legal occupations (19.0%); healthcare practitioners and technical occupations (12.3%); education, training, and library occupations (9.9%); management occupations (except farmers) (5.6%); computer and mathematical occupations (3.2%)
La Rentree II Townhomes neighborhood detailed profile
Population: 5
Population density:
| La Rentree II Townhomes: | 20,452 people per square mile |
| Tampa: | 3,454 people per square mile |
Median household income in 2021:
| La Rentree II Townhomes: | $48,864 |
| Tampa: | $63,404 |
Median rent in in 2021:
| La Rentree II Townhomes: | $942 |
| Tampa: | $1,191 |
Male vs Females
| Males: | 2 |
| Females: | 2 |
Median age
| Males: | 36.4 years |
| Females: | 36.6 years |
Housing prices:
Most popular occupations of males: service occupations (42.1%); sales and office occupations (16.4%); production occupations (8.6%); management occupations (except farmers) (7.3%); construction, extraction, and maintenance occupations (5.8%); computer and mathematical occupations (5.5%); architecture and engineering occupations (4.9%)
Most popular occupations of females: service occupations (24.1%); sales and office occupations (21.9%); legal occupations (19.0%); healthcare practitioners and technical occupations (12.3%); education, training, and library occupations (9.9%); management occupations (except farmers) (5.6%); computer and mathematical occupations (3.2%)
La Rentree II Townhomes neighborhood detailed profile
La Rue Grande neighborhood in Tampa statistics: (Find on map)
Area: 0.004 square miles
Population: 6
Population density:
Median household income in 2021:
Median rent in in 2021:
Male vs Females
Median age
Most popular occupations of males: business and financial operations occupations (22.5%); healthcare practitioners and technical occupations (22.5%); sales and office occupations (18.3%); architecture and engineering occupations (8.0%); construction, extraction, and maintenance occupations (7.5%); service occupations (7.0%); transportation occupations (6.1%)
Most popular occupations of females: sales and office occupations (55.4%); education, training, and library occupations (23.8%); service occupations (8.5%); business and financial operations occupations (8.0%); computer and mathematical occupations (7.7%); management occupations (except farmers) (7.0%); arts, design, entertainment, sports, and media occupations (4.6%)
La Rue Grande neighborhood detailed profile
Area: 0.004 square miles
Population: 6
Population density:
| La Rue Grande: | 1,568 people per square mile |
| Tampa: | 3,454 people per square mile |
Median household income in 2021:
| La Rue Grande: | $81,719 |
| Tampa: | $63,404 |
Median rent in in 2021:
| La Rue Grande: | $688 |
| Tampa: | $1,191 |
Male vs Females
| Males: | 4 |
| Females: | 2 |
Median age
| Males: | 38.1 years |
| Females: | 46.4 years |
Most popular occupations of males: business and financial operations occupations (22.5%); healthcare practitioners and technical occupations (22.5%); sales and office occupations (18.3%); architecture and engineering occupations (8.0%); construction, extraction, and maintenance occupations (7.5%); service occupations (7.0%); transportation occupations (6.1%)
Most popular occupations of females: sales and office occupations (55.4%); education, training, and library occupations (23.8%); service occupations (8.5%); business and financial operations occupations (8.0%); computer and mathematical occupations (7.7%); management occupations (except farmers) (7.0%); arts, design, entertainment, sports, and media occupations (4.6%)
La Rue Grande neighborhood detailed profile
La Sette Belle Townhomes neighborhood in Tampa statistics: (Find on map)
Population: 1
Population density:
Median household income in 2021:
Median rent in in 2021:
Most popular occupations of males: sales and office occupations (29.2%); service occupations (24.1%); healthcare practitioners and technical occupations (8.7%); transportation occupations (8.2%); computer and mathematical occupations (7.7%); material moving occupations (6.2%); construction, extraction, and maintenance occupations (5.6%)
Most popular occupations of females: management occupations (except farmers) (57.5%); sales and office occupations (18.8%); education, training, and library occupations (11.3%); service occupations (7.0%); healthcare practitioners and technical occupations (6.5%); computer and mathematical occupations (5.4%); production occupations (3.2%)
La Sette Belle Townhomes neighborhood detailed profile
Population: 1
Population density:
| La Sette Belle Townhomes: | 1,458 people per square mile |
| Tampa: | 3,454 people per square mile |
Median household income in 2021:
| La Sette Belle Townhomes: | $89,955 |
| Tampa: | $63,404 |
Median rent in in 2021:
| La Sette Belle Townhomes: | $1,223 |
| Tampa: | $1,191 |
Most popular occupations of males: sales and office occupations (29.2%); service occupations (24.1%); healthcare practitioners and technical occupations (8.7%); transportation occupations (8.2%); computer and mathematical occupations (7.7%); material moving occupations (6.2%); construction, extraction, and maintenance occupations (5.6%)
Most popular occupations of females: management occupations (except farmers) (57.5%); sales and office occupations (18.8%); education, training, and library occupations (11.3%); service occupations (7.0%); healthcare practitioners and technical occupations (6.5%); computer and mathematical occupations (5.4%); production occupations (3.2%)
La Sette Belle Townhomes neighborhood detailed profile
La Ventura Condo neighborhood in Tampa statistics: (Find on map)
Population: 1
Population density:
Median household income in 2021:
Median rent in in 2021:
Housing prices:
Most popular occupations of males: management occupations (except farmers) (22.0%); sales and office occupations (18.4%); education, training, and library occupations (11.4%); computer and mathematical occupations (10.0%); legal occupations (9.8%); service occupations (7.7%); architecture and engineering occupations (4.3%)
Most popular occupations of females: sales and office occupations (38.5%); management occupations (except farmers) (13.3%); healthcare practitioners and technical occupations (12.7%); business and financial operations occupations (8.9%); service occupations (7.8%); education, training, and library occupations (5.5%); legal occupations (5.2%)
La Ventura Condo neighborhood detailed profile
Population: 1
Population density:
| La Ventura Condo: | 1,649 people per square mile |
| Tampa: | 3,454 people per square mile |
Median household income in 2021:
| La Ventura Condo: | $70,278 |
| Tampa: | $63,404 |
Median rent in in 2021:
| La Ventura Condo: | $966 |
| Tampa: | $1,191 |
Housing prices:
Most popular occupations of males: management occupations (except farmers) (22.0%); sales and office occupations (18.4%); education, training, and library occupations (11.4%); computer and mathematical occupations (10.0%); legal occupations (9.8%); service occupations (7.7%); architecture and engineering occupations (4.3%)
Most popular occupations of females: sales and office occupations (38.5%); management occupations (except farmers) (13.3%); healthcare practitioners and technical occupations (12.7%); business and financial operations occupations (8.9%); service occupations (7.8%); education, training, and library occupations (5.5%); legal occupations (5.2%)
La Ventura Condo neighborhood detailed profile
Lago Oaks Professional Office Condo neighborhood in Tampa statistics: (Find on map)
Area: 0.002 square miles
Population: 3
Population density:
Median household income in 2021:
Median rent in in 2021:
Male vs Females
Median age
Most popular occupations of males: management occupations (except farmers) (17.5%); sales and office occupations (15.7%); transportation occupations (13.9%); business and financial operations occupations (11.9%); healthcare practitioners and technical occupations (7.7%); construction, extraction, and maintenance occupations (6.4%); computer and mathematical occupations (4.9%)
Most popular occupations of females: management occupations (except farmers) (27.7%); sales and office occupations (26.0%); education, training, and library occupations (12.1%); business and financial operations occupations (8.1%); arts, design, entertainment, sports, and media occupations (7.8%); healthcare practitioners and technical occupations (6.9%); community and social services occupations (5.2%)
Lago Oaks Professional Office Condo neighborhood detailed profile
Area: 0.002 square miles
Population: 3
Population density:
| Lago Oaks Professional Office Condo: | 1,294 people per square mile |
| Tampa: | 3,454 people per square mile |
Median household income in 2021:
| Lago Oaks Professional Office Condo: | $77,000 |
| Tampa: | $63,404 |
Median rent in in 2021:
| Lago Oaks Professional Office Condo: | $1,075 |
| Tampa: | $1,191 |
Male vs Females
| Males: | 2 |
| Females: | 1 |
Median age
| Males: | 50.5 years |
| Females: | 61.3 years |
Most popular occupations of males: management occupations (except farmers) (17.5%); sales and office occupations (15.7%); transportation occupations (13.9%); business and financial operations occupations (11.9%); healthcare practitioners and technical occupations (7.7%); construction, extraction, and maintenance occupations (6.4%); computer and mathematical occupations (4.9%)
Most popular occupations of females: management occupations (except farmers) (27.7%); sales and office occupations (26.0%); education, training, and library occupations (12.1%); business and financial operations occupations (8.1%); arts, design, entertainment, sports, and media occupations (7.8%); healthcare practitioners and technical occupations (6.9%); community and social services occupations (5.2%)
Lago Oaks Professional Office Condo neighborhood detailed profile
Lago Vista neighborhood in Tampa statistics: (Find on map)
Area: 0.111 square miles
Roads and streets: Pico Dr; Lago Vista Dr; la Serena Dr; Palma Vista Ln; la Habra Ct; Vallejo Pl; del Prado Ct; Palmeras Ct; el Amador Ct; el Monte Ct.
Lago Vista neighborhood detailed profile
Area: 0.111 square miles
Roads and streets: Pico Dr; Lago Vista Dr; la Serena Dr; Palma Vista Ln; la Habra Ct; Vallejo Pl; del Prado Ct; Palmeras Ct; el Amador Ct; el Monte Ct.
Lago Vista neighborhood detailed profile
Lake Carroll Court neighborhood in Tampa statistics: (Find on map)
Area: 0.014 square miles
Roads and streets: Winthrop Way.
Lake Carroll Court neighborhood detailed profile
Area: 0.014 square miles
Roads and streets: Winthrop Way.
Lake Carroll Court neighborhood detailed profile
Lake Carroll Cove neighborhood in Tampa statistics: (Find on map)
Area: 0.052 square miles
Roads and streets: Carroll Cove Pl; Boot Lake Cir; Carroll Shore Pl.
Lake Carroll Cove neighborhood detailed profile
Area: 0.052 square miles
Roads and streets: Carroll Cove Pl; Boot Lake Cir; Carroll Shore Pl.
Lake Carroll Cove neighborhood detailed profile
Lake Carroll Drive neighborhood in Tampa statistics: (Find on map)
Area: 0.016 square miles
Lake Carroll Drive neighborhood detailed profile
Area: 0.016 square miles
Lake Carroll Drive neighborhood detailed profile
Lake Carroll Grove Estates neighborhood in Tampa statistics: (Find on map)
Area: 0.023 square miles
Roads and streets: Carroll Pl.
Lake Carroll Grove Estates neighborhood detailed profile
Area: 0.023 square miles
Roads and streets: Carroll Pl.
Lake Carroll Grove Estates neighborhood detailed profile
Lake Carroll Manor neighborhood in Tampa statistics: (Find on map)
Area: 0.011 square miles
Population: 32
Population density:
Median household income in 2021:
Median rent in in 2021:
Male vs Females
Median age
Most popular occupations of males: service occupations (25.7%); management occupations (except farmers) (19.5%); sales and office occupations (13.6%); business and financial operations occupations (8.7%); computer and mathematical occupations (7.8%); healthcare practitioners and technical occupations (6.0%); life, physical, and social science occupations (3.2%)
Most popular occupations of females: sales and office occupations (32.1%); healthcare practitioners and technical occupations (23.0%); management occupations (except farmers) (12.0%); service occupations (7.0%); business and financial operations occupations (6.4%); education, training, and library occupations (6.4%); computer and mathematical occupations (5.0%)
Lake Carroll Manor neighborhood detailed profile
Area: 0.011 square miles
Population: 32
Population density:
| Lake Carroll Manor: | 3,001 people per square mile |
| Tampa: | 3,454 people per square mile |
Median household income in 2021:
| Lake Carroll Manor: | $72,721 |
| Tampa: | $63,404 |
Median rent in in 2021:
| Lake Carroll Manor: | $1,250 |
| Tampa: | $1,191 |
Male vs Females
| Males: | 16 |
| Females: | 16 |
Median age
| Males: | 42.3 years |
| Females: | 45.2 years |
Most popular occupations of males: service occupations (25.7%); management occupations (except farmers) (19.5%); sales and office occupations (13.6%); business and financial operations occupations (8.7%); computer and mathematical occupations (7.8%); healthcare practitioners and technical occupations (6.0%); life, physical, and social science occupations (3.2%)
Most popular occupations of females: sales and office occupations (32.1%); healthcare practitioners and technical occupations (23.0%); management occupations (except farmers) (12.0%); service occupations (7.0%); business and financial operations occupations (6.4%); education, training, and library occupations (6.4%); computer and mathematical occupations (5.0%)
Lake Carroll Manor neighborhood detailed profile
Lake Carroll View neighborhood in Tampa statistics: (Find on map)
Area: 0.002 square miles
Lake Carroll View neighborhood detailed profile
Area: 0.002 square miles
Lake Carroll View neighborhood detailed profile
Lake Chase Condo neighborhood in Tampa statistics: (Find on map)
Area: 0.103 square miles
Roads and streets: Lakechase Island Way; White Lake Ct; Windsor Lake Ct.
Lake Chase Condo neighborhood detailed profile
Area: 0.103 square miles
Roads and streets: Lakechase Island Way; White Lake Ct; Windsor Lake Ct.
Lake Chase Condo neighborhood detailed profile
Lake Crest Manor neighborhood in Tampa statistics: (Find on map)
Area: 0.019 square miles
Lake Crest Manor neighborhood detailed profile
Area: 0.019 square miles
Lake Crest Manor neighborhood detailed profile
Lake Dorothea Park neighborhood in Tampa statistics: (Find on map)
Area: 0.002 square miles
Lake Dorothea Park neighborhood detailed profile
Area: 0.002 square miles
Lake Dorothea Park neighborhood detailed profile
Lake Egypt Estates neighborhood in Tampa statistics: (Find on map)
Area: 0.084 square miles
Roads and streets: Egypt Lake Dr; St Vincent St W; W Robson St; W Clinton St; W Clinton Cir; W Robson Cir.
Lake Egypt Estates neighborhood detailed profile
Area: 0.084 square miles
Roads and streets: Egypt Lake Dr; St Vincent St W; W Robson St; W Clinton St; W Clinton Cir; W Robson Cir.
Lake Egypt Estates neighborhood detailed profile
Lake Ellen Estates neighborhood in Tampa statistics: (Find on map)
Area: 0.025 square miles
Roads and streets: Lake Ellen Cir.
Lake Ellen Estates neighborhood detailed profile
Area: 0.025 square miles
Roads and streets: Lake Ellen Cir.
Lake Ellen Estates neighborhood detailed profile
Lake Ellen Grove neighborhood in Tampa statistics: (Find on map)
Area: 0.031 square miles
Roads and streets: Carte Dr; Sebring Blvd; Greenmoor Pl.
Lake Ellen Grove neighborhood detailed profile
Area: 0.031 square miles
Roads and streets: Carte Dr; Sebring Blvd; Greenmoor Pl.
Lake Ellen Grove neighborhood detailed profile
Lake Ellen Landings Townhomes Condo neighborhood in Tampa statistics: (Find on map)
Area: 0.002 square miles
Lake Ellen Landings Townhomes Condo neighborhood detailed profile
Area: 0.002 square miles
Lake Ellen Landings Townhomes Condo neighborhood detailed profile
Lake Ellen Shores neighborhood in Tampa statistics: (Find on map)
Area: 0.021 square miles
Roads and streets: Saint Charlotte Dr; Yent Pl; Lake Ellen Ln.
Lake Ellen Shores neighborhood detailed profile
Area: 0.021 square miles
Roads and streets: Saint Charlotte Dr; Yent Pl; Lake Ellen Ln.
Lake Ellen Shores neighborhood detailed profile
Lake Ellen Villas neighborhood in Tampa statistics: (Find on map)
Area: 0.005 square miles
Lake Ellen Villas neighborhood detailed profile
Area: 0.005 square miles
Lake Ellen Villas neighborhood detailed profile
Lake Ellen Walk neighborhood in Tampa statistics: (Find on map)
Area: 0.010 square miles
Roads and streets: Waterbridge Dr; Cypress Head Ct; Arborview Pl; Lorna Pl.
Lake Ellen Walk neighborhood detailed profile
Area: 0.010 square miles
Roads and streets: Waterbridge Dr; Cypress Head Ct; Arborview Pl; Lorna Pl.
Lake Ellen Walk neighborhood detailed profile
Lake Gass Estate neighborhood in Tampa statistics: (Find on map)
Area: 0.036 square miles
Population: 70
Population density:
Median household income in 2021:
Median rent in in 2021:
Male vs Females
Median age
Most popular occupations of males: management occupations (except farmers) (17.5%); sales and office occupations (15.7%); transportation occupations (13.9%); business and financial operations occupations (11.9%); healthcare practitioners and technical occupations (7.7%); construction, extraction, and maintenance occupations (6.4%); computer and mathematical occupations (4.9%)
Most popular occupations of females: management occupations (except farmers) (27.7%); sales and office occupations (26.0%); education, training, and library occupations (12.1%); business and financial operations occupations (8.1%); arts, design, entertainment, sports, and media occupations (7.8%); healthcare practitioners and technical occupations (6.9%); community and social services occupations (5.2%)
Lake Gass Estate neighborhood detailed profile
Area: 0.036 square miles
Population: 70
Population density:
| Lake Gass Estate: | 1,964 people per square mile |
| Tampa: | 3,454 people per square mile |
Median household income in 2021:
| Lake Gass Estate: | $77,000 |
| Tampa: | $63,404 |
Median rent in in 2021:
| Lake Gass Estate: | $1,075 |
| Tampa: | $1,191 |
Male vs Females
| Males: | 38 |
| Females: | 32 |
Median age
| Males: | 50.5 years |
| Females: | 61.3 years |
Most popular occupations of males: management occupations (except farmers) (17.5%); sales and office occupations (15.7%); transportation occupations (13.9%); business and financial operations occupations (11.9%); healthcare practitioners and technical occupations (7.7%); construction, extraction, and maintenance occupations (6.4%); computer and mathematical occupations (4.9%)
Most popular occupations of females: management occupations (except farmers) (27.7%); sales and office occupations (26.0%); education, training, and library occupations (12.1%); business and financial operations occupations (8.1%); arts, design, entertainment, sports, and media occupations (7.8%); healthcare practitioners and technical occupations (6.9%); community and social services occupations (5.2%)
Lake Gass Estate neighborhood detailed profile
Lake Leta Trace neighborhood in Tampa statistics: (Find on map)
Area: 0.028 square miles
Population: 49
Population density:
Median household income in 2021:
Median rent in in 2021:
Male vs Females
Median age
Average estimated value of detached houses in 2021 (100.0% of all units):
Most popular occupations of males: sales and office occupations (52.2%); business and financial operations occupations (10.2%); construction, extraction, and maintenance occupations (9.2%); material moving occupations (4.0%); transportation occupations (3.9%); management occupations (except farmers) (3.8%); healthcare practitioners and technical occupations (3.8%)
Most popular occupations of females: sales and office occupations (68.9%); business and financial operations occupations (15.0%); education, training, and library occupations (6.5%); management occupations (except farmers) (6.1%); arts, design, entertainment, sports, and media occupations (4.9%); service occupations (2.1%); healthcare practitioners and technical occupations (1.5%)
Roads and streets: Lake Leta Blvd; Leta Trace Ct.
Lake Leta Trace neighborhood detailed profile
Area: 0.028 square miles
Population: 49
Population density:
| Lake Leta Trace: | 1,721 people per square mile |
| Tampa: | 3,454 people per square mile |
Median household income in 2021:
| Lake Leta Trace: | $155,917 |
| Tampa: | $63,404 |
Median rent in in 2021:
| Lake Leta Trace: | $1,815 |
| Tampa: | $1,191 |
Male vs Females
| Males: | 24 |
| Females: | 24 |
Median age
| Males: | 51.4 years |
| Females: | 54.5 years |
Average estimated value of detached houses in 2021 (100.0% of all units):
| Lake Leta Trace: | $333,465 |
| Tampa: | $477,728 |
Most popular occupations of males: sales and office occupations (52.2%); business and financial operations occupations (10.2%); construction, extraction, and maintenance occupations (9.2%); material moving occupations (4.0%); transportation occupations (3.9%); management occupations (except farmers) (3.8%); healthcare practitioners and technical occupations (3.8%)
Most popular occupations of females: sales and office occupations (68.9%); business and financial operations occupations (15.0%); education, training, and library occupations (6.5%); management occupations (except farmers) (6.1%); arts, design, entertainment, sports, and media occupations (4.9%); service occupations (2.1%); healthcare practitioners and technical occupations (1.5%)
Roads and streets: Lake Leta Blvd; Leta Trace Ct.
Lake Leta Trace neighborhood detailed profile
Lake Magdalene Arms Estates neighborhood in Tampa statistics: (Find on map)
Area: 0.088 square miles
Population: 22
Population density:
Median household income in 2021:
Median rent in in 2021:
Male vs Females
Median age
Housing prices:
Average estimated value of detached houses in 2021 (16.7% of all units):
Average estimated '21 value of housing units in 3-to-4-unit structures (16.7% of all units):
Most popular occupations of males: service occupations (93.1%); management occupations (except farmers) (51.7%); computer and mathematical occupations (37.3%); healthcare practitioners and technical occupations (24.1%); transportation occupations (22.0%); sales and office occupations (20.9%); construction, extraction, and maintenance occupations (8.2%)
Most popular occupations of females: service occupations (30.1%); sales and office occupations (16.4%); transportation occupations (14.5%); computer and mathematical occupations (11.8%); business and financial operations occupations (10.9%); life, physical, and social science occupations (9.4%); education, training, and library occupations (7.0%)
Roads and streets: Moran Dr; Lake Magdalene Dr; Lake George Pl; Lake George Ln.
Lake Magdalene Arms Estates neighborhood detailed profile
Area: 0.088 square miles
Population: 22
Population density:
| Lake Magdalene Arms Estates: | 251 people per square mile |
| Tampa: | 3,454 people per square mile |
Median household income in 2021:
| Lake Magdalene Arms Estates: | $20,022 |
| Tampa: | $63,404 |
Median rent in in 2021:
| Lake Magdalene Arms Estates: | $665 |
| Tampa: | $1,191 |
Male vs Females
| Males: | 11 |
| Females: | 11 |
Median age
| Males: | 15.8 years |
| Females: | 32.5 years |
Housing prices:
Average estimated value of detached houses in 2021 (16.7% of all units):
| Lake Magdalene Arms Estates: | $2,133,771 |
| Tampa: | $477,728 |
Average estimated '21 value of housing units in 3-to-4-unit structures (16.7% of all units):
| Lake Magdalene Arms Estates: | $165,463 |
| city: | $249,678 |
Most popular occupations of males: service occupations (93.1%); management occupations (except farmers) (51.7%); computer and mathematical occupations (37.3%); healthcare practitioners and technical occupations (24.1%); transportation occupations (22.0%); sales and office occupations (20.9%); construction, extraction, and maintenance occupations (8.2%)
Most popular occupations of females: service occupations (30.1%); sales and office occupations (16.4%); transportation occupations (14.5%); computer and mathematical occupations (11.8%); business and financial operations occupations (10.9%); life, physical, and social science occupations (9.4%); education, training, and library occupations (7.0%)
Roads and streets: Moran Dr; Lake Magdalene Dr; Lake George Pl; Lake George Ln.
Lake Magdalene Arms Estates neighborhood detailed profile
Lake Magdalene For Rest neighborhood in Tampa statistics: (Find on map)
Area: 0.092 square miles
Population: 1
Population density:
Median household income in 2021:
Median rent in in 2021:
Most popular occupations of males: service occupations (25.0%); management occupations (except farmers) (24.0%); sales and office occupations (13.8%); arts, design, entertainment, sports, and media occupations (10.1%); computer and mathematical occupations (9.7%); healthcare practitioners and technical occupations (4.7%); transportation occupations (4.2%)
Most popular occupations of females: sales and office occupations (27.8%); service occupations (26.5%); business and financial operations occupations (19.1%); healthcare practitioners and technical occupations (13.0%); transportation occupations (4.5%); computer and mathematical occupations (4.3%); life, physical, and social science occupations (2.8%)
Roads and streets: Lake Magdalene Cir; N Rome Ave; Kaye Dr.
Lake Magdalene For Rest neighborhood detailed profile
Area: 0.092 square miles
Population: 1
Population density:
| Lake Magdalene For Rest: | 11 people per square mile |
| Tampa: | 3,454 people per square mile |
Median household income in 2021:
| Lake Magdalene For Rest: | $546 |
| Tampa: | $63,404 |
Median rent in in 2021:
| Lake Magdalene For Rest: | $11 |
| Tampa: | $1,191 |
Most popular occupations of males: service occupations (25.0%); management occupations (except farmers) (24.0%); sales and office occupations (13.8%); arts, design, entertainment, sports, and media occupations (10.1%); computer and mathematical occupations (9.7%); healthcare practitioners and technical occupations (4.7%); transportation occupations (4.2%)
Most popular occupations of females: sales and office occupations (27.8%); service occupations (26.5%); business and financial operations occupations (19.1%); healthcare practitioners and technical occupations (13.0%); transportation occupations (4.5%); computer and mathematical occupations (4.3%); life, physical, and social science occupations (2.8%)
Roads and streets: Lake Magdalene Cir; N Rome Ave; Kaye Dr.
Lake Magdalene For Rest neighborhood detailed profile
Lake Magdalene Manors neighborhood in Tampa statistics: (Find on map)
Area: 0.165 square miles
Population: 124
Population density:
Median household income in 2021:
Median rent in in 2021:
Male vs Females
Median age
Housing prices:
Average estimated value of detached houses in 2021 (24.2% of all units):
Average estimated value of townhouses or other attached units in 2021 (1.5% of all units):
Average estimated '21 value of housing units in 3-to-4-unit structures (16.7% of all units):
Average estimated '21 value of housing units in 5-or-more-unit structures (6.1% of all units):
Most popular occupations of males: service occupations (93.1%); management occupations (except farmers) (51.7%); computer and mathematical occupations (37.3%); healthcare practitioners and technical occupations (24.1%); transportation occupations (22.0%); sales and office occupations (20.9%); construction, extraction, and maintenance occupations (8.2%)
Most popular occupations of females: service occupations (30.1%); sales and office occupations (16.4%); transportation occupations (14.5%); computer and mathematical occupations (11.8%); business and financial operations occupations (10.9%); life, physical, and social science occupations (9.4%); education, training, and library occupations (7.0%)
Roads and streets: Magdalene Manor Dr; Shady Shores Dr; Oberlin Manor Way; Seaforth Manor Way; Magdalene Hill Dr; Bryanhurst Manor Ct; Magdaline Cove Pl; Amesbury Manor Ct; Ashland Manor Way; Magdalene Lake Cove; Glen Manor Ct.
Lake Magdalene Manors neighborhood detailed profile
Area: 0.165 square miles
Population: 124
Population density:
| Lake Magdalene Manors: | 753 people per square mile |
| Tampa: | 3,454 people per square mile |
Median household income in 2021:
| Lake Magdalene Manors: | $32,595 |
| Tampa: | $63,404 |
Median rent in in 2021:
| Lake Magdalene Manors: | $1,082 |
| Tampa: | $1,191 |
Male vs Females
| Males: | 62 |
| Females: | 61 |
Median age
| Males: | 25.7 years |
| Females: | 52.9 years |
Housing prices:
Average estimated value of detached houses in 2021 (24.2% of all units):
| Lake Magdalene Manors: | $2,133,771 |
| Tampa: | $477,728 |
Average estimated value of townhouses or other attached units in 2021 (1.5% of all units):
| This neighborhood: | $148,144 |
| city: | $499,254 |
Average estimated '21 value of housing units in 3-to-4-unit structures (16.7% of all units):
| Lake Magdalene Manors: | $165,463 |
| city: | $249,678 |
Average estimated '21 value of housing units in 5-or-more-unit structures (6.1% of all units):
| Lake Magdalene Manors: | $190,332 |
| Tampa: | $443,026 |
Most popular occupations of males: service occupations (93.1%); management occupations (except farmers) (51.7%); computer and mathematical occupations (37.3%); healthcare practitioners and technical occupations (24.1%); transportation occupations (22.0%); sales and office occupations (20.9%); construction, extraction, and maintenance occupations (8.2%)
Most popular occupations of females: service occupations (30.1%); sales and office occupations (16.4%); transportation occupations (14.5%); computer and mathematical occupations (11.8%); business and financial operations occupations (10.9%); life, physical, and social science occupations (9.4%); education, training, and library occupations (7.0%)
Roads and streets: Magdalene Manor Dr; Shady Shores Dr; Oberlin Manor Way; Seaforth Manor Way; Magdalene Hill Dr; Bryanhurst Manor Ct; Magdaline Cove Pl; Amesbury Manor Ct; Ashland Manor Way; Magdalene Lake Cove; Glen Manor Ct.
Lake Magdalene Manors neighborhood detailed profile
Lake Magdalene Park neighborhood in Tampa statistics: (Find on map)
Median household income in 2021:
Median rent in in 2021:
Most popular occupations of males: service occupations (93.1%); management occupations (except farmers) (51.7%); computer and mathematical occupations (37.3%); healthcare practitioners and technical occupations (24.1%); transportation occupations (22.0%); sales and office occupations (20.9%); construction, extraction, and maintenance occupations (8.2%)
Most popular occupations of females: service occupations (30.1%); sales and office occupations (16.4%); transportation occupations (14.5%); computer and mathematical occupations (11.8%); business and financial operations occupations (10.9%); life, physical, and social science occupations (9.4%); education, training, and library occupations (7.0%)
Lake Magdalene Park neighborhood detailed profile
Median household income in 2021:
| Lake Magdalene Park: | $32,595 |
| Tampa: | $63,404 |
Median rent in in 2021:
| Lake Magdalene Park: | $1,082 |
| Tampa: | $1,191 |
Most popular occupations of males: service occupations (93.1%); management occupations (except farmers) (51.7%); computer and mathematical occupations (37.3%); healthcare practitioners and technical occupations (24.1%); transportation occupations (22.0%); sales and office occupations (20.9%); construction, extraction, and maintenance occupations (8.2%)
Most popular occupations of females: service occupations (30.1%); sales and office occupations (16.4%); transportation occupations (14.5%); computer and mathematical occupations (11.8%); business and financial operations occupations (10.9%); life, physical, and social science occupations (9.4%); education, training, and library occupations (7.0%)
Lake Magdalene Park neighborhood detailed profile
Lake Magdalene Vista neighborhood in Tampa statistics: (Find on map)
Area: 0.020 square miles
Population: 87
Population density:
Median household income in 2021:
Median rent in in 2021:
Male vs Females
Median age
Average estimated value of detached houses in 2021 (100.0% of all units):
Most popular occupations of males: service occupations (35.2%); management occupations (except farmers) (34.5%); arts, design, entertainment, sports, and media occupations (14.5%); sales and office occupations (9.0%); transportation occupations (8.4%); healthcare practitioners and technical occupations (6.8%); production occupations (5.7%)
Most popular occupations of females: sales and office occupations (30.8%); service occupations (26.9%); business and financial operations occupations (26.1%); healthcare practitioners and technical occupations (16.2%); management occupations (except farmers) (13.3%); transportation occupations (5.5%); education, training, and library occupations (3.4%)
Roads and streets: Warman Ct; Warman St.
Lake Magdalene Vista neighborhood detailed profile
Area: 0.020 square miles
Population: 87
Population density:
| Lake Magdalene Vista: | 4,356 people per square mile |
| Tampa: | 3,454 people per square mile |
Median household income in 2021:
| Lake Magdalene Vista: | $82,303 |
| Tampa: | $63,404 |
Median rent in in 2021:
| Lake Magdalene Vista: | $977 |
| Tampa: | $1,191 |
Male vs Females
| Males: | 44 |
| Females: | 43 |
Median age
| Males: | 41.8 years |
| Females: | 33.6 years |
Average estimated value of detached houses in 2021 (100.0% of all units):
| Lake Magdalene Vista: | $275,559 |
| Tampa: | $477,728 |
Most popular occupations of males: service occupations (35.2%); management occupations (except farmers) (34.5%); arts, design, entertainment, sports, and media occupations (14.5%); sales and office occupations (9.0%); transportation occupations (8.4%); healthcare practitioners and technical occupations (6.8%); production occupations (5.7%)
Most popular occupations of females: sales and office occupations (30.8%); service occupations (26.9%); business and financial operations occupations (26.1%); healthcare practitioners and technical occupations (16.2%); management occupations (except farmers) (13.3%); transportation occupations (5.5%); education, training, and library occupations (3.4%)
Roads and streets: Warman Ct; Warman St.
Lake Magdalene Vista neighborhood detailed profile
Lake Magdalene Woods neighborhood in Tampa statistics: (Find on map)
Area: 0.021 square miles
Population: 15
Population density:
Median household income in 2021:
Median rent in in 2021:
Male vs Females
Median age
Housing prices:
Average estimated value of detached houses in 2021 (25.0% of all units):
Average estimated '21 value of housing units in 3-to-4-unit structures (12.5% of all units):
Most popular occupations of males: service occupations (93.1%); management occupations (except farmers) (51.7%); computer and mathematical occupations (37.3%); healthcare practitioners and technical occupations (24.1%); transportation occupations (22.0%); sales and office occupations (20.9%); construction, extraction, and maintenance occupations (8.2%)
Most popular occupations of females: service occupations (30.1%); sales and office occupations (16.4%); transportation occupations (14.5%); computer and mathematical occupations (11.8%); business and financial operations occupations (10.9%); life, physical, and social science occupations (9.4%); education, training, and library occupations (7.0%)
Roads and streets: Magdalene Woods Dr; Woods End Ct.
Lake Magdalene Woods neighborhood detailed profile
Area: 0.021 square miles
Population: 15
Population density:
| Lake Magdalene Woods: | 726 people per square mile |
| Tampa: | 3,454 people per square mile |
Median household income in 2021:
| Lake Magdalene Woods: | $32,595 |
| Tampa: | $63,404 |
Median rent in in 2021:
| Lake Magdalene Woods: | $1,082 |
| Tampa: | $1,191 |
Male vs Females
| Males: | 7 |
| Females: | 7 |
Median age
| Males: | 25.7 years |
| Females: | 52.9 years |
Housing prices:
Average estimated value of detached houses in 2021 (25.0% of all units):
| Lake Magdalene Woods: | $2,133,771 |
| Tampa: | $477,728 |
Average estimated '21 value of housing units in 3-to-4-unit structures (12.5% of all units):
| Lake Magdalene Woods: | $165,463 |
| city: | $249,678 |
Most popular occupations of males: service occupations (93.1%); management occupations (except farmers) (51.7%); computer and mathematical occupations (37.3%); healthcare practitioners and technical occupations (24.1%); transportation occupations (22.0%); sales and office occupations (20.9%); construction, extraction, and maintenance occupations (8.2%)
Most popular occupations of females: service occupations (30.1%); sales and office occupations (16.4%); transportation occupations (14.5%); computer and mathematical occupations (11.8%); business and financial operations occupations (10.9%); life, physical, and social science occupations (9.4%); education, training, and library occupations (7.0%)
Roads and streets: Magdalene Woods Dr; Woods End Ct.
Lake Magdalene Woods neighborhood detailed profile
Lake Marie Mobile Estates neighborhood in Tampa statistics: (Find on map)
Area: 0.010 square miles
Lake Marie Mobile Estates neighborhood detailed profile
Area: 0.010 square miles
Lake Marie Mobile Estates neighborhood detailed profile
Lake Morley Terrace Estates neighborhood in Tampa statistics: (Find on map)
Area: 0.038 square miles
Population: 169
Population density:
Median household income in 2021:
Median rent in in 2021:
Male vs Females
Median age
Average estimated value of detached houses in 2021 (100.0% of all units):
Most popular occupations of males: service occupations (35.2%); management occupations (except farmers) (34.5%); arts, design, entertainment, sports, and media occupations (14.5%); sales and office occupations (9.0%); transportation occupations (8.4%); healthcare practitioners and technical occupations (6.8%); production occupations (5.7%)
Most popular occupations of females: sales and office occupations (30.8%); service occupations (26.9%); business and financial operations occupations (26.1%); healthcare practitioners and technical occupations (16.2%); management occupations (except farmers) (13.3%); transportation occupations (5.5%); education, training, and library occupations (3.4%)
Roads and streets: Hardy Dr; Lejuene Ln; W Hardy Dr.
Lake Morley Terrace Estates neighborhood detailed profile
Area: 0.038 square miles
Population: 169
Population density:
| Lake Morley Terrace Estates: | 4,401 people per square mile |
| Tampa: | 3,454 people per square mile |
Median household income in 2021:
| Lake Morley Terrace Estates: | $82,303 |
| Tampa: | $63,404 |
Median rent in in 2021:
| Lake Morley Terrace Estates: | $977 |
| Tampa: | $1,191 |
Male vs Females
| Males: | 86 |
| Females: | 83 |
Median age
| Males: | 41.8 years |
| Females: | 33.6 years |
Average estimated value of detached houses in 2021 (100.0% of all units):
| Lake Morley Terrace Estates: | $275,559 |
| Tampa: | $477,728 |
Most popular occupations of males: service occupations (35.2%); management occupations (except farmers) (34.5%); arts, design, entertainment, sports, and media occupations (14.5%); sales and office occupations (9.0%); transportation occupations (8.4%); healthcare practitioners and technical occupations (6.8%); production occupations (5.7%)
Most popular occupations of females: sales and office occupations (30.8%); service occupations (26.9%); business and financial operations occupations (26.1%); healthcare practitioners and technical occupations (16.2%); management occupations (except farmers) (13.3%); transportation occupations (5.5%); education, training, and library occupations (3.4%)
Roads and streets: Hardy Dr; Lejuene Ln; W Hardy Dr.
Lake Morley Terrace Estates neighborhood detailed profile
Lake Place Condo neighborhood in Tampa statistics: (Find on map)
Area: 0.224 square miles
Population: 1,368
Population density:
Median household income in 2021:
Median rent in in 2021:
Male vs Females
Median age
Most popular occupations of males: sales and office occupations (28.5%); architecture and engineering occupations (26.7%); business and financial operations occupations (13.5%); production occupations (8.6%); management occupations (except farmers) (6.7%); material moving occupations (5.2%); computer and mathematical occupations (5.0%)
Most popular occupations of females: service occupations (35.3%); sales and office occupations (19.5%); management occupations (except farmers) (17.2%); business and financial operations occupations (15.1%); education, training, and library occupations (9.1%); production occupations (8.6%); arts, design, entertainment, sports, and media occupations (3.4%)
Roads and streets: Hollowell Rd; Metheny Cir; Farragut Dr; Lake Place Ln; Hanley Rd; Leeward Dr; Martinshire Blvd; Hulsey Rd; Hollowell Dr; Lake Place Ct; Sade St; Twelve Oaks Blvd; Rockshire Ct; Ascot Ct; Sleepy Creek Ct; Lake View Ct; Frostwood Ct; Liberty Pl; Friendship Ct; Westwind Dr; Cordial Ct; Albion Ct; Marlin Ct; Sage Ct; Mardale Ct; Middlewood Ct; Wilmette Ct; Grapevine Ct; Derby Ct; Freedom Ct; Messa Ct; Verona Ct.
Lake Place Condo neighborhood detailed profile
Area: 0.224 square miles
Population: 1,368
Population density:
| Lake Place Condo: | 6,108 people per square mile |
| Tampa: | 3,454 people per square mile |
Median household income in 2021:
| Lake Place Condo: | $60,396 |
| Tampa: | $63,404 |
Median rent in in 2021:
| Lake Place Condo: | $1,761 |
| Tampa: | $1,191 |
Male vs Females
| Males: | 767 |
| Females: | 601 |
Median age
| Males: | 42.8 years |
| Females: | 55.9 years |
Most popular occupations of males: sales and office occupations (28.5%); architecture and engineering occupations (26.7%); business and financial operations occupations (13.5%); production occupations (8.6%); management occupations (except farmers) (6.7%); material moving occupations (5.2%); computer and mathematical occupations (5.0%)
Most popular occupations of females: service occupations (35.3%); sales and office occupations (19.5%); management occupations (except farmers) (17.2%); business and financial operations occupations (15.1%); education, training, and library occupations (9.1%); production occupations (8.6%); arts, design, entertainment, sports, and media occupations (3.4%)
Roads and streets: Hollowell Rd; Metheny Cir; Farragut Dr; Lake Place Ln; Hanley Rd; Leeward Dr; Martinshire Blvd; Hulsey Rd; Hollowell Dr; Lake Place Ct; Sade St; Twelve Oaks Blvd; Rockshire Ct; Ascot Ct; Sleepy Creek Ct; Lake View Ct; Frostwood Ct; Liberty Pl; Friendship Ct; Westwind Dr; Cordial Ct; Albion Ct; Marlin Ct; Sage Ct; Mardale Ct; Middlewood Ct; Wilmette Ct; Grapevine Ct; Derby Ct; Freedom Ct; Messa Ct; Verona Ct.
Lake Place Condo neighborhood detailed profile
Lake Platt West neighborhood in Tampa statistics: (Find on map)
Area: 0.007 square miles
Population: 11
Population density:
Median household income in 2021:
Median rent in in 2021:
Male vs Females
Median age
Most popular occupations of males: computer and mathematical occupations (27.4%); management occupations (except farmers) (16.2%); sales and office occupations (15.6%); service occupations (8.2%); education, training, and library occupations (6.0%); healthcare practitioners and technical occupations (5.2%); business and financial operations occupations (5.0%)
Most popular occupations of females: sales and office occupations (37.8%); healthcare practitioners and technical occupations (14.8%); service occupations (14.8%); business and financial operations occupations (7.9%); education, training, and library occupations (6.3%); management occupations (except farmers) (5.0%); production occupations (4.7%)
Lake Platt West neighborhood detailed profile
Area: 0.007 square miles
Population: 11
Population density:
| Lake Platt West: | 1,475 people per square mile |
| Tampa: | 3,454 people per square mile |
Median household income in 2021:
| Lake Platt West: | $74,600 |
| Tampa: | $63,404 |
Median rent in in 2021:
| Lake Platt West: | $994 |
| Tampa: | $1,191 |
Male vs Females
| Males: | 4 |
| Females: | 6 |
Median age
| Males: | 40.2 years |
| Females: | 42.2 years |
Most popular occupations of males: computer and mathematical occupations (27.4%); management occupations (except farmers) (16.2%); sales and office occupations (15.6%); service occupations (8.2%); education, training, and library occupations (6.0%); healthcare practitioners and technical occupations (5.2%); business and financial operations occupations (5.0%)
Most popular occupations of females: sales and office occupations (37.8%); healthcare practitioners and technical occupations (14.8%); service occupations (14.8%); business and financial operations occupations (7.9%); education, training, and library occupations (6.3%); management occupations (except farmers) (5.0%); production occupations (4.7%)
Lake Platt West neighborhood detailed profile
Lake Pointe neighborhood in Tampa statistics: (Find on map)
Area: 0.010 square miles
Lake Pointe neighborhood detailed profile
Area: 0.010 square miles
Lake Pointe neighborhood detailed profile
Lake Ridge neighborhood in Tampa statistics: (Find on map)
Area: 0.054 square miles
Roads and streets: Graham Ln; Vera Ave; Gaines St.
Lake Ridge neighborhood detailed profile
Area: 0.054 square miles
Roads and streets: Graham Ln; Vera Ave; Gaines St.
Lake Ridge neighborhood detailed profile
Lake Robles neighborhood in Tampa statistics: (Find on map)
Area: 0.007 square miles
Population: 44
Population density:
Median household income in 2021:
Median rent in in 2021:
Male vs Females
Median age
Most popular occupations of males: service occupations (513.4%); construction, extraction, and maintenance occupations (325.5%); production occupations (192.5%); material moving occupations (132.9%); management occupations (except farmers) (100.0%); transportation occupations (96.3%); sales and office occupations (59.6%)
Most popular occupations of females: service occupations (54.7%); healthcare practitioners and technical occupations (18.7%); management occupations (except farmers) (8.4%); transportation occupations (7.1%); sales and office occupations (6.7%); life, physical, and social science occupations (6.1%); material moving occupations (4.4%)
Lake Robles neighborhood detailed profile
Area: 0.007 square miles
Population: 44
Population density:
| Lake Robles: | 5,936 people per square mile |
| Tampa: | 3,454 people per square mile |
Median household income in 2021:
| Lake Robles: | $10,837 |
| Tampa: | $63,404 |
Median rent in in 2021:
| Lake Robles: | $145 |
| Tampa: | $1,191 |
Male vs Females
| Males: | 19 |
| Females: | 25 |
Median age
| Males: | 8.3 years |
| Females: | 28.6 years |
Most popular occupations of males: service occupations (513.4%); construction, extraction, and maintenance occupations (325.5%); production occupations (192.5%); material moving occupations (132.9%); management occupations (except farmers) (100.0%); transportation occupations (96.3%); sales and office occupations (59.6%)
Most popular occupations of females: service occupations (54.7%); healthcare practitioners and technical occupations (18.7%); management occupations (except farmers) (8.4%); transportation occupations (7.1%); sales and office occupations (6.7%); life, physical, and social science occupations (6.1%); material moving occupations (4.4%)
Lake Robles neighborhood detailed profile
Lake Shore Estates neighborhood in Tampa statistics: (Find on map)
Area: 0.009 square miles
Lake Shore Estates neighborhood detailed profile
Area: 0.009 square miles
Lake Shore Estates neighborhood detailed profile
Lake View Heights neighborhood in Tampa statistics: (Find on map)
Area: 0.026 square miles
Lake View Heights neighborhood detailed profile
Area: 0.026 square miles
Lake View Heights neighborhood detailed profile
Lake View Park neighborhood in Tampa statistics: (Find on map)
Area: 0.045 square miles
Roads and streets: W Minnehaha St; N Clearview Ave; Donald Ave.
Lake View Park neighborhood detailed profile
Area: 0.045 square miles
Roads and streets: W Minnehaha St; N Clearview Ave; Donald Ave.
Lake View Park neighborhood detailed profile
Lakeside Terrace neighborhood in Tampa statistics: (Find on map)
Area: 0.076 square miles
Lakeside Terrace neighborhood detailed profile
Area: 0.076 square miles
Lakeside Terrace neighborhood detailed profile
Lakeside Townhomes neighborhood in Tampa statistics: (Find on map)
Area: 0.023 square miles
Roads and streets: Heards Ferry Dr.
Lakeside Townhomes neighborhood detailed profile
Area: 0.023 square miles
Roads and streets: Heards Ferry Dr.
Lakeside Townhomes neighborhood detailed profile
Lakeview Villas at Pebble Creek Village neighborhood in Tampa statistics: (Find on map)
Area: 0.011 square miles
Lakeview Villas at Pebble Creek Village neighborhood detailed profile
Area: 0.011 square miles
Lakeview Villas at Pebble Creek Village neighborhood detailed profile
Lakewood Crest neighborhood in Tampa statistics: (Find on map)
Area: 0.038 square miles
Roads and streets: Dunquin Pl; Limerick Dr; Connacht Way; Ulster Ct; Kilkenny Dr.
Lakewood Crest neighborhood detailed profile
Area: 0.038 square miles
Roads and streets: Dunquin Pl; Limerick Dr; Connacht Way; Ulster Ct; Kilkenny Dr.
Lakewood Crest neighborhood detailed profile
Lakewood Estates neighborhood in Tampa statistics: (Find on map)
Area: 0.088 square miles
Population: 288
Population density:
Median household income in 2021:
Median rent in in 2021:
Male vs Females
Median age
Average estimated value of detached houses in 2021 (100.0% of all units):
Most popular occupations of males: service occupations (25.7%); management occupations (except farmers) (23.8%); sales and office occupations (15.8%); arts, design, entertainment, sports, and media occupations (10.0%); transportation occupations (8.4%); architecture and engineering occupations (5.9%); healthcare practitioners and technical occupations (4.7%)
Most popular occupations of females: sales and office occupations (35.6%); service occupations (22.3%); business and financial operations occupations (18.6%); healthcare practitioners and technical occupations (17.7%); transportation occupations (5.6%); legal occupations (3.2%); management occupations (except farmers) (2.1%)
Roads and streets: Briarwood Ave; Wedgewood Dr; Ashwood Dr.
Lakewood Estates neighborhood detailed profile
Area: 0.088 square miles
Population: 288
Population density:
| Lakewood Estates: | 3,288 people per square mile |
| Tampa: | 3,454 people per square mile |
Median household income in 2021:
| Lakewood Estates: | $105,379 |
| Tampa: | $63,404 |
Median rent in in 2021:
| Lakewood Estates: | $1,124 |
| Tampa: | $1,191 |
Male vs Females
| Males: | 143 |
| Females: | 145 |
Median age
| Males: | 50.2 years |
| Females: | 52.4 years |
Average estimated value of detached houses in 2021 (100.0% of all units):
| Lakewood Estates: | $295,489 |
| Tampa: | $477,728 |
Most popular occupations of males: service occupations (25.7%); management occupations (except farmers) (23.8%); sales and office occupations (15.8%); arts, design, entertainment, sports, and media occupations (10.0%); transportation occupations (8.4%); architecture and engineering occupations (5.9%); healthcare practitioners and technical occupations (4.7%)
Most popular occupations of females: sales and office occupations (35.6%); service occupations (22.3%); business and financial operations occupations (18.6%); healthcare practitioners and technical occupations (17.7%); transportation occupations (5.6%); legal occupations (3.2%); management occupations (except farmers) (2.1%)
Roads and streets: Briarwood Ave; Wedgewood Dr; Ashwood Dr.
Lakewood Estates neighborhood detailed profile
Lakewood Gardens neighborhood in Tampa statistics: (Find on map)
Area: 0.005 square miles
Lakewood Gardens neighborhood detailed profile
Area: 0.005 square miles
Lakewood Gardens neighborhood detailed profile
Lakewood Manor neighborhood in Tampa statistics: (Find on map)
Area: 0.038 square miles
Population: 163
Population density:
Median household income in 2021:
Median rent in in 2021:
Male vs Females
Median age
Average estimated value of detached houses in 2021 (94.0% of all units):
Most popular occupations of males: service occupations (23.6%); sales and office occupations (22.6%); education, training, and library occupations (12.3%); production occupations (8.5%); computer and mathematical occupations (5.8%); business and financial operations occupations (5.5%); construction, extraction, and maintenance occupations (5.0%)
Most popular occupations of females: sales and office occupations (26.8%); healthcare practitioners and technical occupations (17.0%); business and financial operations occupations (16.8%); service occupations (11.5%); education, training, and library occupations (10.5%); management occupations (except farmers) (5.0%); community and social services occupations (4.2%)
Roads and streets: E Idlewild Ave.
Lakewood Manor neighborhood detailed profile
Area: 0.038 square miles
Population: 163
Population density:
| Lakewood Manor: | 4,236 people per square mile |
| Tampa: | 3,454 people per square mile |
Median household income in 2021:
| Lakewood Manor: | $51,356 |
| Tampa: | $63,404 |
Median rent in in 2021:
| Lakewood Manor: | $1,043 |
| Tampa: | $1,191 |
Male vs Females
| Males: | 63 |
| Females: | 100 |
Median age
| Males: | 36.8 years |
| Females: | 38.8 years |
Average estimated value of detached houses in 2021 (94.0% of all units):
| Lakewood Manor: | $214,716 |
| Tampa: | $477,728 |
Most popular occupations of males: service occupations (23.6%); sales and office occupations (22.6%); education, training, and library occupations (12.3%); production occupations (8.5%); computer and mathematical occupations (5.8%); business and financial operations occupations (5.5%); construction, extraction, and maintenance occupations (5.0%)
Most popular occupations of females: sales and office occupations (26.8%); healthcare practitioners and technical occupations (17.0%); business and financial operations occupations (16.8%); service occupations (11.5%); education, training, and library occupations (10.5%); management occupations (except farmers) (5.0%); community and social services occupations (4.2%)
Roads and streets: E Idlewild Ave.
Lakewood Manor neighborhood detailed profile
Lamar Devilla Condo neighborhood in Tampa statistics: (Find on map)
Median household income in 2021:
Median rent in in 2021:
Most popular occupations of males: management occupations (except farmers) (46.3%); material moving occupations (13.9%); legal occupations (12.0%); service occupations (11.1%); sales and office occupations (6.5%); transportation occupations (5.6%); farming, fishing, and forestry occupations (5.4%)
Most popular occupations of females: sales and office occupations (52.0%); service occupations (24.4%); healthcare practitioners and technical occupations (14.0%); management occupations (except farmers) (11.4%); arts, design, entertainment, sports, and media occupations (11.0%); transportation occupations (9.0%); business and financial operations occupations (7.0%)
Lamar Devilla Condo neighborhood detailed profile
Median household income in 2021:
| Lamar Devilla Condo: | $48,750 |
| Tampa: | $63,404 |
Median rent in in 2021:
| Lamar Devilla Condo: | $719 |
| Tampa: | $1,191 |
Most popular occupations of males: management occupations (except farmers) (46.3%); material moving occupations (13.9%); legal occupations (12.0%); service occupations (11.1%); sales and office occupations (6.5%); transportation occupations (5.6%); farming, fishing, and forestry occupations (5.4%)
Most popular occupations of females: sales and office occupations (52.0%); service occupations (24.4%); healthcare practitioners and technical occupations (14.0%); management occupations (except farmers) (11.4%); arts, design, entertainment, sports, and media occupations (11.0%); transportation occupations (9.0%); business and financial operations occupations (7.0%)
Lamar Devilla Condo neighborhood detailed profile
Lamour Court neighborhood in Tampa statistics: (Find on map)
Area: 0.008 square miles
Population: 33
Population density:
Median household income in 2021:
Median rent in in 2021:
Male vs Females
Median age
Average estimated value of detached houses in 2021 (63.6% of all units):
Most popular occupations of males: sales and office occupations (50.1%); transportation occupations (22.1%); service occupations (17.1%); production occupations (8.6%); construction, extraction, and maintenance occupations (6.5%); management occupations (except farmers) (3.1%); arts, design, entertainment, sports, and media occupations (2.5%)
Most popular occupations of females: service occupations (73.8%); construction, extraction, and maintenance occupations (8.6%); education, training, and library occupations (6.4%); production occupations (5.9%); sales and office occupations (4.9%); computer and mathematical occupations (3.0%); arts, design, entertainment, sports, and media occupations (2.7%)
Lamour Court neighborhood detailed profile
Area: 0.008 square miles
Population: 33
Population density:
| Lamour Court: | 4,136 people per square mile |
| Tampa: | 3,454 people per square mile |
Median household income in 2021:
| Lamour Court: | $42,580 |
| Tampa: | $63,404 |
Median rent in in 2021:
| Lamour Court: | $920 |
| Tampa: | $1,191 |
Male vs Females
| Males: | 16 |
| Females: | 17 |
Median age
| Males: | 29.2 years |
| Females: | 59.0 years |
Average estimated value of detached houses in 2021 (63.6% of all units):
| Lamour Court: | $1,090,811 |
| Tampa: | $477,728 |
Most popular occupations of males: sales and office occupations (50.1%); transportation occupations (22.1%); service occupations (17.1%); production occupations (8.6%); construction, extraction, and maintenance occupations (6.5%); management occupations (except farmers) (3.1%); arts, design, entertainment, sports, and media occupations (2.5%)
Most popular occupations of females: service occupations (73.8%); construction, extraction, and maintenance occupations (8.6%); education, training, and library occupations (6.4%); production occupations (5.9%); sales and office occupations (4.9%); computer and mathematical occupations (3.0%); arts, design, entertainment, sports, and media occupations (2.7%)
Lamour Court neighborhood detailed profile
Land Lackey Estates neighborhood in Tampa statistics: (Find on map)
Area: 0.032 square miles
Roads and streets: Land Ave; Varn Ave; C Ave.
Land Lackey Estates neighborhood detailed profile
Area: 0.032 square miles
Roads and streets: Land Ave; Varn Ave; C Ave.
Land Lackey Estates neighborhood detailed profile
Landcraft Deleon Townhomes neighborhood in Tampa statistics: (Find on map)
Area: 0.001 square miles
Population: 8
Population density:
Median household income in 2021:
Median rent in in 2021:
Male vs Females
Median age
Housing prices:
Average estimated value of townhouses or other attached units in 2021 (66.7% of all units):
Average estimated '21 value of housing units in 5-or-more-unit structures (33.3% of all units):
Most popular occupations of males: legal occupations (36.2%); architecture and engineering occupations (13.4%); sales and office occupations (13.1%); education, training, and library occupations (13.0%); management occupations (except farmers) (12.3%); computer and mathematical occupations (7.8%); production occupations (7.8%)
Most popular occupations of females: management occupations (except farmers) (24.3%); service occupations (18.1%); healthcare practitioners and technical occupations (11.3%); education, training, and library occupations (10.7%); sales and office occupations (10.7%); business and financial operations occupations (9.6%); legal occupations (9.6%)
Landcraft Deleon Townhomes neighborhood detailed profile
Area: 0.001 square miles
Population: 8
Population density:
| Landcraft Deleon Townhomes: | 7,392 people per square mile |
| Tampa: | 3,454 people per square mile |
Median household income in 2021:
| Landcraft Deleon Townhomes: | $188,966 |
| Tampa: | $63,404 |
Median rent in in 2021:
| Landcraft Deleon Townhomes: | $3,501 |
| Tampa: | $1,191 |
Male vs Females
| Males: | 5 |
| Females: | 3 |
Median age
| Males: | 44.3 years |
| Females: | 43.4 years |
Housing prices:
Average estimated value of townhouses or other attached units in 2021 (66.7% of all units):
| This neighborhood: | $382,367 |
| city: | $499,254 |
Average estimated '21 value of housing units in 5-or-more-unit structures (33.3% of all units):
| Landcraft Deleon Townhomes: | $222,658 |
| Tampa: | $443,026 |
Most popular occupations of males: legal occupations (36.2%); architecture and engineering occupations (13.4%); sales and office occupations (13.1%); education, training, and library occupations (13.0%); management occupations (except farmers) (12.3%); computer and mathematical occupations (7.8%); production occupations (7.8%)
Most popular occupations of females: management occupations (except farmers) (24.3%); service occupations (18.1%); healthcare practitioners and technical occupations (11.3%); education, training, and library occupations (10.7%); sales and office occupations (10.7%); business and financial operations occupations (9.6%); legal occupations (9.6%)
Landcraft Deleon Townhomes neighborhood detailed profile
Landmark South Condo neighborhood in Tampa statistics: (Find on map)
Population: 2
Population density:
Median household income in 2021:
Median rent in in 2021:
Male vs Females
Median age
Most popular occupations of males: sales and office occupations (28.5%); legal occupations (26.2%); business and financial operations occupations (21.5%); service occupations (9.9%); healthcare practitioners and technical occupations (9.3%); management occupations (except farmers) (7.6%); architecture and engineering occupations (6.4%)
Most popular occupations of females: management occupations (except farmers) (38.0%); healthcare practitioners and technical occupations (35.2%); business and financial operations occupations (15.2%); legal occupations (13.9%); sales and office occupations (13.0%); education, training, and library occupations (9.6%); arts, design, entertainment, sports, and media occupations (3.2%)
Landmark South Condo neighborhood detailed profile
Population: 2
Population density:
| Landmark South Condo: | 2,057 people per square mile |
| Tampa: | 3,454 people per square mile |
Median household income in 2021:
| Landmark South Condo: | $92,065 |
| Tampa: | $63,404 |
Median rent in in 2021:
| Landmark South Condo: | $1,454 |
| Tampa: | $1,191 |
Male vs Females
| Males: | 1 |
| Females: | 0 |
Median age
| Males: | 31.6 years |
| Females: | 25.9 years |
Most popular occupations of males: sales and office occupations (28.5%); legal occupations (26.2%); business and financial operations occupations (21.5%); service occupations (9.9%); healthcare practitioners and technical occupations (9.3%); management occupations (except farmers) (7.6%); architecture and engineering occupations (6.4%)
Most popular occupations of females: management occupations (except farmers) (38.0%); healthcare practitioners and technical occupations (35.2%); business and financial operations occupations (15.2%); legal occupations (13.9%); sales and office occupations (13.0%); education, training, and library occupations (9.6%); arts, design, entertainment, sports, and media occupations (3.2%)
Landmark South Condo neighborhood detailed profile
Lane Farms neighborhood in Tampa statistics: (Find on map)
Area: 0.029 square miles
Lane Farms neighborhood detailed profile
Area: 0.029 square miles
Lane Farms neighborhood detailed profile
Larsen Place neighborhood in Tampa statistics: (Find on map)
Area: 0.004 square miles
Population: 14
Population density:
Median household income in 2021:
Median rent in in 2021:
Male vs Females
Median age
Housing prices:
Average estimated value of detached houses in 2021 (100.0% of all units):
Average estimated value of townhouses or other attached units in 2021 (20.0% of all units):
Most popular occupations of males: management occupations (except farmers) (21.2%); service occupations (17.2%); transportation occupations (15.4%); arts, design, entertainment, sports, and media occupations (12.6%); healthcare practitioners and technical occupations (11.9%); sales and office occupations (11.3%); construction, extraction, and maintenance occupations (10.2%)
Most popular occupations of females: business and financial operations occupations (22.9%); education, training, and library occupations (22.9%); sales and office occupations (22.2%); management occupations (except farmers) (20.8%); healthcare practitioners and technical occupations (19.0%); service occupations (7.8%); production occupations (5.3%)
Larsen Place neighborhood detailed profile
Area: 0.004 square miles
Population: 14
Population density:
| Larsen Place: | 3,777 people per square mile |
| Tampa: | 3,454 people per square mile |
Median household income in 2021:
| Larsen Place: | $78,894 |
| Tampa: | $63,404 |
Median rent in in 2021:
| Larsen Place: | $1,796 |
| Tampa: | $1,191 |
Male vs Females
| Males: | 7 |
| Females: | 6 |
Median age
| Males: | 31.3 years |
| Females: | 42.2 years |
Housing prices:
Average estimated value of detached houses in 2021 (100.0% of all units):
| Larsen Place: | $360,862 |
| Tampa: | $477,728 |
Average estimated value of townhouses or other attached units in 2021 (20.0% of all units):
| This neighborhood: | $294,554 |
| city: | $499,254 |
Most popular occupations of males: management occupations (except farmers) (21.2%); service occupations (17.2%); transportation occupations (15.4%); arts, design, entertainment, sports, and media occupations (12.6%); healthcare practitioners and technical occupations (11.9%); sales and office occupations (11.3%); construction, extraction, and maintenance occupations (10.2%)
Most popular occupations of females: business and financial operations occupations (22.9%); education, training, and library occupations (22.9%); sales and office occupations (22.2%); management occupations (except farmers) (20.8%); healthcare practitioners and technical occupations (19.0%); service occupations (7.8%); production occupations (5.3%)
Larsen Place neighborhood detailed profile
Las Palmas neighborhood in Tampa statistics: (Find on map)
Area: 0.011 square miles
Population: 19
Population density:
Median household income in 2021:
Median rent in in 2021:
Male vs Females
Median age
Average estimated value of detached houses in 2021 (71.4% of all units):
Most popular occupations of males: sales and office occupations (22.7%); service occupations (21.3%); construction, extraction, and maintenance occupations (16.5%); transportation occupations (12.3%); production occupations (12.1%); management occupations (except farmers) (11.7%); healthcare practitioners and technical occupations (2.1%)
Most popular occupations of females: material moving occupations (30.9%); sales and office occupations (20.6%); service occupations (17.2%); education, training, and library occupations (9.7%); management occupations (except farmers) (5.7%); production occupations (5.7%); computer and mathematical occupations (4.7%)
Las Palmas neighborhood detailed profile
Area: 0.011 square miles
Population: 19
Population density:
| Las Palmas: | 1,736 people per square mile |
| Tampa: | 3,454 people per square mile |
Median household income in 2021:
| Las Palmas: | $48,000 |
| Tampa: | $63,404 |
Median rent in in 2021:
| Las Palmas: | $790 |
| Tampa: | $1,191 |
Male vs Females
| Males: | 10 |
| Females: | 9 |
Median age
| Males: | 26.5 years |
| Females: | 51.4 years |
Average estimated value of detached houses in 2021 (71.4% of all units):
| Las Palmas: | $183,766 |
| Tampa: | $477,728 |
Most popular occupations of males: sales and office occupations (22.7%); service occupations (21.3%); construction, extraction, and maintenance occupations (16.5%); transportation occupations (12.3%); production occupations (12.1%); management occupations (except farmers) (11.7%); healthcare practitioners and technical occupations (2.1%)
Most popular occupations of females: material moving occupations (30.9%); sales and office occupations (20.6%); service occupations (17.2%); education, training, and library occupations (9.7%); management occupations (except farmers) (5.7%); production occupations (5.7%); computer and mathematical occupations (4.7%)
Las Palmas neighborhood detailed profile
Las Palmas De Ybor Condo neighborhood in Tampa statistics: (Find on map)
Las Palmas De Ybor Condo neighborhood detailed profile
Las Palmas De Ybor Condo neighborhood detailed profile
Las Palmas Townhomes neighborhood in Tampa statistics: (Find on map)
Area: 0.022 square miles
Las Palmas Townhomes neighborhood detailed profile
Area: 0.022 square miles
Las Palmas Townhomes neighborhood detailed profile
Las Palmas at Ballast Point Townhomes neighborhood in Tampa statistics: (Find on map)
Area: 0.002 square miles
Population: 8
Population density:
Median household income in 2021:
Median rent in in 2021:
Male vs Females
Median age
Most popular occupations of males: arts, design, entertainment, sports, and media occupations (18.9%); healthcare practitioners and technical occupations (18.0%); sales and office occupations (15.0%); legal occupations (11.6%); computer and mathematical occupations (9.9%); material moving occupations (9.5%); transportation occupations (7.8%)
Most popular occupations of females: sales and office occupations (122.9%); management occupations (except farmers) (71.4%); computer and mathematical occupations (28.6%); business and financial operations occupations (28.4%); service occupations (19.1%); legal occupations (15.7%); healthcare practitioners and technical occupations (11.3%)
Las Palmas at Ballast Point Townhomes neighborhood detailed profile
Area: 0.002 square miles
Population: 8
Population density:
| Las Palmas at Ballast Point Townhomes: | 4,627 people per square mile |
| Tampa: | 3,454 people per square mile |
Median household income in 2021:
| Las Palmas at Ballast Point Townhomes: | $65,761 |
| Tampa: | $63,404 |
Median rent in in 2021:
| Las Palmas at Ballast Point Townhomes: | $1,149 |
| Tampa: | $1,191 |
Male vs Females
| Males: | 5 |
| Females: | 2 |
Median age
| Males: | 46.1 years |
| Females: | 49.5 years |
Most popular occupations of males: arts, design, entertainment, sports, and media occupations (18.9%); healthcare practitioners and technical occupations (18.0%); sales and office occupations (15.0%); legal occupations (11.6%); computer and mathematical occupations (9.9%); material moving occupations (9.5%); transportation occupations (7.8%)
Most popular occupations of females: sales and office occupations (122.9%); management occupations (except farmers) (71.4%); computer and mathematical occupations (28.6%); business and financial operations occupations (28.4%); service occupations (19.1%); legal occupations (15.7%); healthcare practitioners and technical occupations (11.3%)
Las Palmas at Ballast Point Townhomes neighborhood detailed profile
Las Villas De Orleans Townhomes neighborhood in Tampa statistics: (Find on map)
Population: 3
Population density:
Median household income in 2021:
Median rent in in 2021:
Male vs Females
Median age
Average estimated '21 value of housing units in 5-or-more-unit structures (100.0% of all units):
Most popular occupations of males: sales and office occupations (28.5%); management occupations (except farmers) (20.1%); healthcare practitioners and technical occupations (12.6%); business and financial operations occupations (11.3%); computer and mathematical occupations (7.8%); service occupations (5.2%); life, physical, and social science occupations (4.8%)
Most popular occupations of females: sales and office occupations (25.4%); management occupations (except farmers) (23.6%); healthcare practitioners and technical occupations (14.9%); community and social services occupations (8.5%); business and financial operations occupations (7.1%); computer and mathematical occupations (7.1%); legal occupations (5.0%)
Las Villas De Orleans Townhomes neighborhood detailed profile
Population: 3
Population density:
| Las Villas De Orleans Townhomes: | 9,876 people per square mile |
| Tampa: | 3,454 people per square mile |
Median household income in 2021:
| Las Villas De Orleans Townhomes: | $157,969 |
| Tampa: | $63,404 |
Median rent in in 2021:
| Las Villas De Orleans Townhomes: | $2,133 |
| Tampa: | $1,191 |
Male vs Females
| Males: | 1 |
| Females: | 1 |
Median age
| Males: | 39.8 years |
| Females: | 34.0 years |
Average estimated '21 value of housing units in 5-or-more-unit structures (100.0% of all units):
| Las Villas De Orleans Townhomes: | $487,854 |
| Tampa: | $443,026 |
Most popular occupations of males: sales and office occupations (28.5%); management occupations (except farmers) (20.1%); healthcare practitioners and technical occupations (12.6%); business and financial operations occupations (11.3%); computer and mathematical occupations (7.8%); service occupations (5.2%); life, physical, and social science occupations (4.8%)
Most popular occupations of females: sales and office occupations (25.4%); management occupations (except farmers) (23.6%); healthcare practitioners and technical occupations (14.9%); community and social services occupations (8.5%); business and financial operations occupations (7.1%); computer and mathematical occupations (7.1%); legal occupations (5.0%)
Las Villas De Orleans Townhomes neighborhood detailed profile
Las Ybor City Homes Condo neighborhood in Tampa statistics: (Find on map)
Las Ybor City Homes Condo neighborhood detailed profile
Las Ybor City Homes Condo neighborhood detailed profile
Laurel Oaks Office Condo neighborhood in Tampa statistics: (Find on map)
Area: 0.004 square miles
Laurel Oaks Office Condo neighborhood detailed profile
Area: 0.004 square miles
Laurel Oaks Office Condo neighborhood detailed profile
Laurel Terrace neighborhood in Tampa statistics: (Find on map)
Area: 0.058 square miles
Roads and streets: N 27th St; N 29th St; 99th Ave; E Okara Rd; 97th Ave; 98th Ave.
Laurel Terrace neighborhood detailed profile
Area: 0.058 square miles
Roads and streets: N 27th St; N 29th St; 99th Ave; E Okara Rd; 97th Ave; 98th Ave.
Laurel Terrace neighborhood detailed profile
Laurelon Village of Meadowood Condo neighborhood in Tampa statistics: (Find on map)
Area: 0.007 square miles
Population: 35
Population density:
Median household income in 2021:
Median rent in in 2021:
Male vs Females
Median age
Most popular occupations of males: service occupations (31.6%); management occupations (except farmers) (21.4%); material moving occupations (14.6%); construction, extraction, and maintenance occupations (11.8%); sales and office occupations (10.4%); education, training, and library occupations (3.4%); healthcare practitioners and technical occupations (2.9%)
Most popular occupations of females: sales and office occupations (54.3%); education, training, and library occupations (18.4%); production occupations (12.3%); service occupations (10.5%); business and financial operations occupations (3.0%); management occupations (except farmers) (2.5%); healthcare practitioners and technical occupations (2.1%)
Roads and streets: Laurelon Village Rd; Laurelon Pl.
Laurelon Village of Meadowood Condo neighborhood detailed profile
Area: 0.007 square miles
Population: 35
Population density:
| Laurelon Village of Meadowood Condo: | 5,321 people per square mile |
| Tampa: | 3,454 people per square mile |
Median household income in 2021:
| Laurelon Village of Meadowood Condo: | $38,179 |
| Tampa: | $63,404 |
Median rent in in 2021:
| Laurelon Village of Meadowood Condo: | $1,103 |
| Tampa: | $1,191 |
Male vs Females
| Males: | 19 |
| Females: | 16 |
Median age
| Males: | 27.6 years |
| Females: | 30.6 years |
Most popular occupations of males: service occupations (31.6%); management occupations (except farmers) (21.4%); material moving occupations (14.6%); construction, extraction, and maintenance occupations (11.8%); sales and office occupations (10.4%); education, training, and library occupations (3.4%); healthcare practitioners and technical occupations (2.9%)
Most popular occupations of females: sales and office occupations (54.3%); education, training, and library occupations (18.4%); production occupations (12.3%); service occupations (10.5%); business and financial operations occupations (3.0%); management occupations (except farmers) (2.5%); healthcare practitioners and technical occupations (2.1%)
Roads and streets: Laurelon Village Rd; Laurelon Pl.
Laurelon Village of Meadowood Condo neighborhood detailed profile
Le Clare Shores neighborhood in Tampa statistics: (Find on map)
Area: 0.051 square miles
Population: 20
Population density:
Median household income in 2021:
Median rent in in 2021:
Male vs Females
Median age
Housing prices:
Average estimated value of detached houses in 2021 (100.0% of all units):
Average estimated value of townhouses or other attached units in 2021 (14.3% of all units):
Most popular occupations of males: management occupations (except farmers) (38.2%); sales and office occupations (17.3%); computer and mathematical occupations (16.1%); service occupations (7.1%); legal occupations (5.4%); business and financial operations occupations (5.1%); material moving occupations (4.3%)
Most popular occupations of females: sales and office occupations (52.1%); healthcare practitioners and technical occupations (13.4%); service occupations (8.9%); management occupations (except farmers) (8.2%); business and financial operations occupations (7.5%); education, training, and library occupations (7.5%); legal occupations (3.0%)
Roads and streets: Corvette Dr; Le Clare Shores Dr; Stanza Ct.
Le Clare Shores neighborhood detailed profile
Area: 0.051 square miles
Population: 20
Population density:
| Le Clare Shores: | 389 people per square mile |
| Tampa: | 3,454 people per square mile |
Median household income in 2021:
| Le Clare Shores: | $186,607 |
| Tampa: | $63,404 |
Median rent in in 2021:
| Le Clare Shores: | $1,366 |
| Tampa: | $1,191 |
Male vs Females
| Males: | 9 |
| Females: | 11 |
Median age
| Males: | 49.8 years |
| Females: | 47.3 years |
Housing prices:
Average estimated value of detached houses in 2021 (100.0% of all units):
| Le Clare Shores: | $510,524 |
| Tampa: | $477,728 |
Average estimated value of townhouses or other attached units in 2021 (14.3% of all units):
| This neighborhood: | $222,087 |
| city: | $499,254 |
Most popular occupations of males: management occupations (except farmers) (38.2%); sales and office occupations (17.3%); computer and mathematical occupations (16.1%); service occupations (7.1%); legal occupations (5.4%); business and financial operations occupations (5.1%); material moving occupations (4.3%)
Most popular occupations of females: sales and office occupations (52.1%); healthcare practitioners and technical occupations (13.4%); service occupations (8.9%); management occupations (except farmers) (8.2%); business and financial operations occupations (7.5%); education, training, and library occupations (7.5%); legal occupations (3.0%)
Roads and streets: Corvette Dr; Le Clare Shores Dr; Stanza Ct.
Le Clare Shores neighborhood detailed profile
Le Refuge Condo neighborhood in Tampa statistics: (Find on map)
Le Refuge Condo neighborhood detailed profile
Le Refuge Condo neighborhood detailed profile
Legacy Park Townhomes neighborhood in Tampa statistics: (Find on map)
Area: 0.022 square miles
Legacy Park Townhomes neighborhood detailed profile
Area: 0.022 square miles
Legacy Park Townhomes neighborhood detailed profile
Leighton Place neighborhood in Tampa statistics: (Find on map)
Area: 0.014 square miles
Roads and streets: Leighton Dr.
Leighton Place neighborhood detailed profile
Area: 0.014 square miles
Roads and streets: Leighton Dr.
Leighton Place neighborhood detailed profile
Leila Avenue Villas neighborhood in Tampa statistics: (Find on map)
Area: 0.007 square miles
Population: 56
Population density:
Median household income in 2021:
Median rent in in 2021:
Male vs Females
Median age
Most popular occupations of males: sales and office occupations (34.8%); material moving occupations (23.7%); management occupations (except farmers) (14.7%); education, training, and library occupations (8.3%); transportation occupations (8.1%); service occupations (4.5%); arts, design, entertainment, sports, and media occupations (4.1%)
Most popular occupations of females: sales and office occupations (44.4%); management occupations (except farmers) (25.3%); business and financial operations occupations (10.8%); legal occupations (6.9%); computer and mathematical occupations (4.7%); service occupations (2.9%); community and social services occupations (2.4%)
Leila Avenue Villas neighborhood detailed profile
Area: 0.007 square miles
Population: 56
Population density:
| Leila Avenue Villas: | 8,438 people per square mile |
| Tampa: | 3,454 people per square mile |
Median household income in 2021:
| Leila Avenue Villas: | $64,539 |
| Tampa: | $63,404 |
Median rent in in 2021:
| Leila Avenue Villas: | $1,636 |
| Tampa: | $1,191 |
Male vs Females
| Males: | 27 |
| Females: | 29 |
Median age
| Males: | 51.7 years |
| Females: | 36.9 years |
Most popular occupations of males: sales and office occupations (34.8%); material moving occupations (23.7%); management occupations (except farmers) (14.7%); education, training, and library occupations (8.3%); transportation occupations (8.1%); service occupations (4.5%); arts, design, entertainment, sports, and media occupations (4.1%)
Most popular occupations of females: sales and office occupations (44.4%); management occupations (except farmers) (25.3%); business and financial operations occupations (10.8%); legal occupations (6.9%); computer and mathematical occupations (4.7%); service occupations (2.9%); community and social services occupations (2.4%)
Leila Avenue Villas neighborhood detailed profile
Leonard Terrace neighborhood in Tampa statistics: (Find on map)
Area: 0.006 square miles
Population: 27
Population density:
Median household income in 2021:
Median rent in in 2021:
Male vs Females
Median age
Most popular occupations of males: service occupations (23.6%); construction, extraction, and maintenance occupations (16.6%); sales and office occupations (16.1%); production occupations (16.1%); management occupations (except farmers) (9.0%); material moving occupations (9.0%); business and financial operations occupations (6.5%)
Most popular occupations of females: sales and office occupations (43.6%); management occupations (except farmers) (18.0%); education, training, and library occupations (9.8%); construction, extraction, and maintenance occupations (8.5%); business and financial operations occupations (8.3%); healthcare practitioners and technical occupations (7.5%); material moving occupations (7.4%)
Leonard Terrace neighborhood detailed profile
Area: 0.006 square miles
Population: 27
Population density:
| Leonard Terrace: | 4,379 people per square mile |
| Tampa: | 3,454 people per square mile |
Median household income in 2021:
| Leonard Terrace: | $50,592 |
| Tampa: | $63,404 |
Median rent in in 2021:
| Leonard Terrace: | $788 |
| Tampa: | $1,191 |
Male vs Females
| Males: | 17 |
| Females: | 10 |
Median age
| Males: | 38.0 years |
| Females: | 40.5 years |
Most popular occupations of males: service occupations (23.6%); construction, extraction, and maintenance occupations (16.6%); sales and office occupations (16.1%); production occupations (16.1%); management occupations (except farmers) (9.0%); material moving occupations (9.0%); business and financial operations occupations (6.5%)
Most popular occupations of females: sales and office occupations (43.6%); management occupations (except farmers) (18.0%); education, training, and library occupations (9.8%); construction, extraction, and maintenance occupations (8.5%); business and financial operations occupations (8.3%); healthcare practitioners and technical occupations (7.5%); material moving occupations (7.4%)
Leonard Terrace neighborhood detailed profile
Leone Estates neighborhood in Tampa statistics: (Find on map)
Area: 0.003 square miles
Leone Estates neighborhood detailed profile
Area: 0.003 square miles
Leone Estates neighborhood detailed profile
Lewis Heights neighborhood in Tampa statistics: (Find on map)
Area: 0.005 square miles
Population: 29
Population density:
Median household income in 2021:
Median rent in in 2021:
Male vs Females
Median age
Most popular occupations of males: service occupations (29.1%); construction, extraction, and maintenance occupations (14.0%); sales and office occupations (11.5%); production occupations (10.4%); management occupations (except farmers) (9.1%); material moving occupations (8.8%); architecture and engineering occupations (7.4%)
Most popular occupations of females: service occupations (27.0%); sales and office occupations (25.1%); healthcare practitioners and technical occupations (10.9%); material moving occupations (9.6%); management occupations (except farmers) (8.4%); production occupations (8.4%); arts, design, entertainment, sports, and media occupations (7.2%)
Roads and streets: E Curtis St.
Lewis Heights neighborhood detailed profile
Area: 0.005 square miles
Population: 29
Population density:
| Lewis Heights: | 5,395 people per square mile |
| Tampa: | 3,454 people per square mile |
Median household income in 2021:
| Lewis Heights: | $60,800 |
| Tampa: | $63,404 |
Median rent in in 2021:
| Lewis Heights: | $936 |
| Tampa: | $1,191 |
Male vs Females
| Males: | 12 |
| Females: | 17 |
Median age
| Males: | 36.4 years |
| Females: | 30.5 years |
Most popular occupations of males: service occupations (29.1%); construction, extraction, and maintenance occupations (14.0%); sales and office occupations (11.5%); production occupations (10.4%); management occupations (except farmers) (9.1%); material moving occupations (8.8%); architecture and engineering occupations (7.4%)
Most popular occupations of females: service occupations (27.0%); sales and office occupations (25.1%); healthcare practitioners and technical occupations (10.9%); material moving occupations (9.6%); management occupations (except farmers) (8.4%); production occupations (8.4%); arts, design, entertainment, sports, and media occupations (7.2%)
Roads and streets: E Curtis St.
Lewis Heights neighborhood detailed profile
Lin Lan Terrace neighborhood in Tampa statistics: (Find on map)
Area: 0.006 square miles
Lin Lan Terrace neighborhood detailed profile
Area: 0.006 square miles
Lin Lan Terrace neighborhood detailed profile
Lincoln Gardens neighborhood in Tampa statistics: (Find on map)
Area: 0.055 square miles
Roads and streets: Pine St; W Walnut St; N Harold Ave; N Grady Ave.
Lincoln Gardens neighborhood detailed profile
Area: 0.055 square miles
Roads and streets: Pine St; W Walnut St; N Harold Ave; N Grady Ave.
Lincoln Gardens neighborhood detailed profile
Lincoln Square neighborhood in Tampa statistics: (Find on map)
Area: 0.004 square miles
Population: 14
Population density:
Median household income in 2021:
Median rent in in 2021:
Male vs Females
Median age
Housing prices:
Average estimated value of detached houses in 2021 (100.0% of all units):
Average estimated value of townhouses or other attached units in 2021 (20.0% of all units):
Most popular occupations of males: management occupations (except farmers) (21.2%); service occupations (17.2%); transportation occupations (15.1%); arts, design, entertainment, sports, and media occupations (12.6%); healthcare practitioners and technical occupations (11.9%); sales and office occupations (11.3%); construction, extraction, and maintenance occupations (10.0%)
Most popular occupations of females: business and financial operations occupations (22.9%); education, training, and library occupations (22.9%); sales and office occupations (22.2%); management occupations (except farmers) (20.4%); healthcare practitioners and technical occupations (19.0%); service occupations (7.8%); legal occupations (5.2%)
Lincoln Square neighborhood detailed profile
Area: 0.004 square miles
Population: 14
Population density:
| Lincoln Square: | 3,603 people per square mile |
| Tampa: | 3,454 people per square mile |
Median household income in 2021:
| Lincoln Square: | $78,894 |
| Tampa: | $63,404 |
Median rent in in 2021:
| Lincoln Square: | $1,796 |
| Tampa: | $1,191 |
Male vs Females
| Males: | 7 |
| Females: | 6 |
Median age
| Males: | 31.3 years |
| Females: | 42.2 years |
Housing prices:
Average estimated value of detached houses in 2021 (100.0% of all units):
| Lincoln Square: | $360,862 |
| Tampa: | $477,728 |
Average estimated value of townhouses or other attached units in 2021 (20.0% of all units):
| This neighborhood: | $294,554 |
| city: | $499,254 |
Most popular occupations of males: management occupations (except farmers) (21.2%); service occupations (17.2%); transportation occupations (15.1%); arts, design, entertainment, sports, and media occupations (12.6%); healthcare practitioners and technical occupations (11.9%); sales and office occupations (11.3%); construction, extraction, and maintenance occupations (10.0%)
Most popular occupations of females: business and financial operations occupations (22.9%); education, training, and library occupations (22.9%); sales and office occupations (22.2%); management occupations (except farmers) (20.4%); healthcare practitioners and technical occupations (19.0%); service occupations (7.8%); legal occupations (5.2%)
Lincoln Square neighborhood detailed profile
Lincoln Terrace neighborhood in Tampa statistics: (Find on map)
Area: 0.004 square miles
Population: 15
Population density:
Median household income in 2021:
Median rent in in 2021:
Male vs Females
Median age
Housing prices:
Average estimated value of detached houses in 2021 (71.4% of all units):
Average estimated value of townhouses or other attached units in 2021 (28.6% of all units):
Most popular occupations of males: service occupations (23.4%); sales and office occupations (19.9%); management occupations (except farmers) (19.1%); transportation occupations (17.3%); construction, extraction, and maintenance occupations (16.3%); business and financial operations occupations (13.5%); healthcare practitioners and technical occupations (5.6%)
Most popular occupations of females: sales and office occupations (49.7%); service occupations (23.1%); education, training, and library occupations (21.7%); healthcare practitioners and technical occupations (12.1%); production occupations (5.9%); management occupations (except farmers) (5.6%); business and financial operations occupations (4.6%)
Lincoln Terrace neighborhood detailed profile
Area: 0.004 square miles
Population: 15
Population density:
| Lincoln Terrace: | 3,771 people per square mile |
| Tampa: | 3,454 people per square mile |
Median household income in 2021:
| Lincoln Terrace: | $79,250 |
| Tampa: | $63,404 |
Median rent in in 2021:
| Lincoln Terrace: | $1,144 |
| Tampa: | $1,191 |
Male vs Females
| Males: | 7 |
| Females: | 8 |
Median age
| Males: | 36.4 years |
| Females: | 53.3 years |
Housing prices:
Average estimated value of detached houses in 2021 (71.4% of all units):
| Lincoln Terrace: | $267,148 |
| Tampa: | $477,728 |
Average estimated value of townhouses or other attached units in 2021 (28.6% of all units):
| This neighborhood: | $294,554 |
| city: | $499,254 |
Most popular occupations of males: service occupations (23.4%); sales and office occupations (19.9%); management occupations (except farmers) (19.1%); transportation occupations (17.3%); construction, extraction, and maintenance occupations (16.3%); business and financial operations occupations (13.5%); healthcare practitioners and technical occupations (5.6%)
Most popular occupations of females: sales and office occupations (49.7%); service occupations (23.1%); education, training, and library occupations (21.7%); healthcare practitioners and technical occupations (12.1%); production occupations (5.9%); management occupations (except farmers) (5.6%); business and financial operations occupations (4.6%)
Lincoln Terrace neighborhood detailed profile
Linda Court neighborhood in Tampa statistics: (Find on map)
Area: 0.005 square miles
Population: 16
Population density:
Median household income in 2021:
Median rent in in 2021:
Male vs Females
Median age
Average estimated value of detached houses in 2021 (66.7% of all units):
Most popular occupations of males: construction, extraction, and maintenance occupations (32.0%); service occupations (23.5%); management occupations (except farmers) (11.8%); sales and office occupations (9.3%); transportation occupations (8.7%); material moving occupations (7.2%); arts, design, entertainment, sports, and media occupations (4.7%)
Most popular occupations of females: sales and office occupations (49.1%); service occupations (35.0%); healthcare practitioners and technical occupations (11.3%); business and financial operations occupations (5.3%); legal occupations (3.0%); management occupations (except farmers) (2.8%); transportation occupations (2.8%)
Linda Court neighborhood detailed profile
Area: 0.005 square miles
Population: 16
Population density:
| Linda Court: | 3,095 people per square mile |
| Tampa: | 3,454 people per square mile |
Median household income in 2021:
| Linda Court: | $46,719 |
| Tampa: | $63,404 |
Median rent in in 2021:
| Linda Court: | $886 |
| Tampa: | $1,191 |
Male vs Females
| Males: | 7 |
| Females: | 9 |
Median age
| Males: | 32.7 years |
| Females: | 33.8 years |
Average estimated value of detached houses in 2021 (66.7% of all units):
| Linda Court: | $178,889 |
| Tampa: | $477,728 |
Most popular occupations of males: construction, extraction, and maintenance occupations (32.0%); service occupations (23.5%); management occupations (except farmers) (11.8%); sales and office occupations (9.3%); transportation occupations (8.7%); material moving occupations (7.2%); arts, design, entertainment, sports, and media occupations (4.7%)
Most popular occupations of females: sales and office occupations (49.1%); service occupations (35.0%); healthcare practitioners and technical occupations (11.3%); business and financial operations occupations (5.3%); legal occupations (3.0%); management occupations (except farmers) (2.8%); transportation occupations (2.8%)
Linda Court neighborhood detailed profile
Linebaugh Avenue Estates neighborhood in Tampa statistics: (Find on map)
Area: 0.004 square miles
Linebaugh Avenue Estates neighborhood detailed profile
Area: 0.004 square miles
Linebaugh Avenue Estates neighborhood detailed profile
Linebaugh Estates neighborhood in Tampa statistics: (Find on map)
Area: 0.039 square miles
Population: 137
Population density:
Median household income in 2021:
Median rent in in 2021:
Male vs Females
Median age
Most popular occupations of males: construction, extraction, and maintenance occupations (27.2%); service occupations (14.3%); management occupations (except farmers) (14.1%); transportation occupations (8.4%); material moving occupations (7.9%); legal occupations (7.4%); production occupations (6.9%)
Most popular occupations of females: sales and office occupations (48.9%); education, training, and library occupations (24.4%); business and financial operations occupations (10.2%); service occupations (10.2%); healthcare practitioners and technical occupations (8.5%); management occupations (except farmers) (6.2%); construction, extraction, and maintenance occupations (6.2%)
Roads and streets: Dartmouth Ave; Highland Ave; Ashley St; 103rd Ave; 101st Ave.
Linebaugh Estates neighborhood detailed profile
Area: 0.039 square miles
Population: 137
Population density:
| Linebaugh Estates: | 3,486 people per square mile |
| Tampa: | 3,454 people per square mile |
Median household income in 2021:
| Linebaugh Estates: | $58,505 |
| Tampa: | $63,404 |
Median rent in in 2021:
| Linebaugh Estates: | $561 |
| Tampa: | $1,191 |
Male vs Females
| Males: | 70 |
| Females: | 67 |
Median age
| Males: | 42.5 years |
| Females: | 54.4 years |
Most popular occupations of males: construction, extraction, and maintenance occupations (27.2%); service occupations (14.3%); management occupations (except farmers) (14.1%); transportation occupations (8.4%); material moving occupations (7.9%); legal occupations (7.4%); production occupations (6.9%)
Most popular occupations of females: sales and office occupations (48.9%); education, training, and library occupations (24.4%); business and financial operations occupations (10.2%); service occupations (10.2%); healthcare practitioners and technical occupations (8.5%); management occupations (except farmers) (6.2%); construction, extraction, and maintenance occupations (6.2%)
Roads and streets: Dartmouth Ave; Highland Ave; Ashley St; 103rd Ave; 101st Ave.
Linebaugh Estates neighborhood detailed profile
Linebaugh Plaza One neighborhood in Tampa statistics: (Find on map)
Area: 0.019 square miles
Population: 12
Population density:
Median household income in 2021:
Median rent in in 2021:
Male vs Females
Median age
Most popular occupations of males: sales and office occupations (51.6%); service occupations (24.5%); management occupations (except farmers) (16.0%); transportation occupations (12.8%); construction, extraction, and maintenance occupations (11.3%); production occupations (11.2%); material moving occupations (5.1%)
Most popular occupations of females: sales and office occupations (55.6%); healthcare practitioners and technical occupations (14.5%); arts, design, entertainment, sports, and media occupations (9.5%); management occupations (except farmers) (6.2%); business and financial operations occupations (4.4%); production occupations (3.9%); computer and mathematical occupations (3.3%)
Linebaugh Plaza One neighborhood detailed profile
Area: 0.019 square miles
Population: 12
Population density:
| Linebaugh Plaza One: | 628 people per square mile |
| Tampa: | 3,454 people per square mile |
Median household income in 2021:
| Linebaugh Plaza One: | $34,734 |
| Tampa: | $63,404 |
Median rent in in 2021:
| Linebaugh Plaza One: | $643 |
| Tampa: | $1,191 |
Male vs Females
| Males: | 6 |
| Females: | 6 |
Median age
| Males: | 19.1 years |
| Females: | 25.2 years |
Most popular occupations of males: sales and office occupations (51.6%); service occupations (24.5%); management occupations (except farmers) (16.0%); transportation occupations (12.8%); construction, extraction, and maintenance occupations (11.3%); production occupations (11.2%); material moving occupations (5.1%)
Most popular occupations of females: sales and office occupations (55.6%); healthcare practitioners and technical occupations (14.5%); arts, design, entertainment, sports, and media occupations (9.5%); management occupations (except farmers) (6.2%); business and financial operations occupations (4.4%); production occupations (3.9%); computer and mathematical occupations (3.3%)
Linebaugh Plaza One neighborhood detailed profile
Lipscomb Villa neighborhood in Tampa statistics: (Find on map)
Area: 0.003 square miles
Lipscomb Villa neighborhood detailed profile
Area: 0.003 square miles
Lipscomb Villa neighborhood detailed profile
Little Cuba neighborhood in Tampa statistics: (Find on map)
Area: 0.025 square miles
Population: 69
Population density:
Median household income in 2021:
Median rent in in 2021:
Male vs Females
Median age
Average estimated value of detached houses in 2021 (80.6% of all units):
Most popular occupations of males: service occupations (41.4%); construction, extraction, and maintenance occupations (20.7%); material moving occupations (19.5%); sales and office occupations (15.4%); transportation occupations (13.8%); production occupations (5.3%); management occupations (except farmers) (4.6%)
Most popular occupations of females: sales and office occupations (70.7%); service occupations (13.8%); education, training, and library occupations (7.3%); business and financial operations occupations (4.9%); management occupations (except farmers) (3.3%); community and social services occupations (2.8%); arts, design, entertainment, sports, and media occupations (1.8%)
Roads and streets: E 23rd Ave; E 22nd Ave; N 31st St; N 32nd St.
Little Cuba neighborhood detailed profile
Area: 0.025 square miles
Population: 69
Population density:
| Little Cuba: | 2,749 people per square mile |
| Tampa: | 3,454 people per square mile |
Median household income in 2021:
| Little Cuba: | $21,691 |
| Tampa: | $63,404 |
Median rent in in 2021:
| Little Cuba: | $1,018 |
| Tampa: | $1,191 |
Male vs Females
| Males: | 19 |
| Females: | 49 |
Median age
| Males: | 47.0 years |
| Females: | 34.0 years |
Average estimated value of detached houses in 2021 (80.6% of all units):
| Little Cuba: | $138,700 |
| Tampa: | $477,728 |
Most popular occupations of males: service occupations (41.4%); construction, extraction, and maintenance occupations (20.7%); material moving occupations (19.5%); sales and office occupations (15.4%); transportation occupations (13.8%); production occupations (5.3%); management occupations (except farmers) (4.6%)
Most popular occupations of females: sales and office occupations (70.7%); service occupations (13.8%); education, training, and library occupations (7.3%); business and financial operations occupations (4.9%); management occupations (except farmers) (3.3%); community and social services occupations (2.8%); arts, design, entertainment, sports, and media occupations (1.8%)
Roads and streets: E 23rd Ave; E 22nd Ave; N 31st St; N 32nd St.
Little Cuba neighborhood detailed profile
Little Eleven neighborhood in Tampa statistics: (Find on map)
Area: 0.003 square miles
Population: 13
Population density:
Median household income in 2021:
Median rent in in 2021:
Male vs Females
Median age
Most popular occupations of males: service occupations (25.6%); transportation occupations (20.4%); management occupations (except farmers) (15.0%); sales and office occupations (12.0%); material moving occupations (9.4%); architecture and engineering occupations (6.5%); computer and mathematical occupations (5.7%)
Most popular occupations of females: sales and office occupations (33.5%); service occupations (25.6%); transportation occupations (13.3%); arts, design, entertainment, sports, and media occupations (8.4%); education, training, and library occupations (3.7%); management occupations (except farmers) (3.3%); business and financial operations occupations (3.3%)
Little Eleven neighborhood detailed profile
Area: 0.003 square miles
Population: 13
Population density:
| Little Eleven: | 4,478 people per square mile |
| Tampa: | 3,454 people per square mile |
Median household income in 2021:
| Little Eleven: | $64,514 |
| Tampa: | $63,404 |
Median rent in in 2021:
| Little Eleven: | $893 |
| Tampa: | $1,191 |
Male vs Females
| Males: | 5 |
| Females: | 8 |
Median age
| Males: | 52.8 years |
| Females: | 46.6 years |
Most popular occupations of males: service occupations (25.6%); transportation occupations (20.4%); management occupations (except farmers) (15.0%); sales and office occupations (12.0%); material moving occupations (9.4%); architecture and engineering occupations (6.5%); computer and mathematical occupations (5.7%)
Most popular occupations of females: sales and office occupations (33.5%); service occupations (25.6%); transportation occupations (13.3%); arts, design, entertainment, sports, and media occupations (8.4%); education, training, and library occupations (3.7%); management occupations (except farmers) (3.3%); business and financial operations occupations (3.3%)
Little Eleven neighborhood detailed profile
Little Henry neighborhood in Tampa statistics: (Find on map)
Area: 0.004 square miles
Population: 11
Population density:
Median household income in 2021:
Median rent in in 2021:
Male vs Females
Median age
Average estimated value of detached houses in 2021 (50.0% of all units):
Most popular occupations of males: service occupations (24.3%); architecture and engineering occupations (19.4%); construction, extraction, and maintenance occupations (14.8%); management occupations (except farmers) (13.5%); sales and office occupations (8.0%); material moving occupations (5.7%); legal occupations (4.6%)
Most popular occupations of females: transportation occupations (53.6%); sales and office occupations (27.8%); management occupations (except farmers) (9.2%); arts, design, entertainment, sports, and media occupations (9.2%); education, training, and library occupations (8.4%); business and financial operations occupations (5.6%); service occupations (5.5%)
Little Henry neighborhood detailed profile
Area: 0.004 square miles
Population: 11
Population density:
| Little Henry: | 3,100 people per square mile |
| Tampa: | 3,454 people per square mile |
Median household income in 2021:
| Little Henry: | $20,592 |
| Tampa: | $63,404 |
Median rent in in 2021:
| Little Henry: | $245 |
| Tampa: | $1,191 |
Male vs Females
| Males: | 5 |
| Females: | 5 |
Median age
| Males: | 50.4 years |
| Females: | 43.5 years |
Average estimated value of detached houses in 2021 (50.0% of all units):
| Little Henry: | $151,998 |
| Tampa: | $477,728 |
Most popular occupations of males: service occupations (24.3%); architecture and engineering occupations (19.4%); construction, extraction, and maintenance occupations (14.8%); management occupations (except farmers) (13.5%); sales and office occupations (8.0%); material moving occupations (5.7%); legal occupations (4.6%)
Most popular occupations of females: transportation occupations (53.6%); sales and office occupations (27.8%); management occupations (except farmers) (9.2%); arts, design, entertainment, sports, and media occupations (9.2%); education, training, and library occupations (8.4%); business and financial operations occupations (5.6%); service occupations (5.5%)
Little Henry neighborhood detailed profile
Live Oak Place neighborhood in Tampa statistics: (Find on map)
Population: 1
Population density:
Median household income in 2021:
Median rent in in 2021:
Most popular occupations of males: healthcare practitioners and technical occupations (40.0%); management occupations (except farmers) (35.7%); business and financial operations occupations (16.9%); legal occupations (13.9%); sales and office occupations (10.4%); production occupations (6.9%); construction, extraction, and maintenance occupations (6.5%)
Most popular occupations of females: sales and office occupations (60.8%); healthcare practitioners and technical occupations (21.5%); business and financial operations occupations (20.9%); management occupations (except farmers) (17.7%); education, training, and library occupations (13.3%); legal occupations (5.8%); arts, design, entertainment, sports, and media occupations (4.4%)
Live Oak Place neighborhood detailed profile
Population: 1
Population density:
| Live Oak Place: | 1,917 people per square mile |
| Tampa: | 3,454 people per square mile |
Median household income in 2021:
| Live Oak Place: | $250,001 |
| Tampa: | $63,404 |
Median rent in in 2021:
| Live Oak Place: | $1,648 |
| Tampa: | $1,191 |
Most popular occupations of males: healthcare practitioners and technical occupations (40.0%); management occupations (except farmers) (35.7%); business and financial operations occupations (16.9%); legal occupations (13.9%); sales and office occupations (10.4%); production occupations (6.9%); construction, extraction, and maintenance occupations (6.5%)
Most popular occupations of females: sales and office occupations (60.8%); healthcare practitioners and technical occupations (21.5%); business and financial operations occupations (20.9%); management occupations (except farmers) (17.7%); education, training, and library occupations (13.3%); legal occupations (5.8%); arts, design, entertainment, sports, and media occupations (4.4%)
Live Oak Place neighborhood detailed profile
Live Oak Preserve neighborhood in Tampa statistics: (Find on map)
Area: 1.519 square miles
Roads and streets: Bluff Oak Blvd; Oak Preserve Blvd; Cormorant Ct; Shumard Oak Dr.
Live Oak Preserve neighborhood detailed profile
Area: 1.519 square miles
Roads and streets: Bluff Oak Blvd; Oak Preserve Blvd; Cormorant Ct; Shumard Oak Dr.
Live Oak Preserve neighborhood detailed profile
Live Oaks Square neighborhood in Tampa statistics: (Find on map)
Area: 2.735 square miles
Population: 8,639
Population density:
Median household income in 2021:
Median rent in in 2021:
Male vs Females
Median age
Average estimated value of detached houses in 2021 (71.6% of all units):
Most popular occupations of males: construction, extraction, and maintenance occupations (24.4%); service occupations (22.6%); sales and office occupations (12.9%); management occupations (except farmers) (10.4%); material moving occupations (7.8%); production occupations (4.3%); arts, design, entertainment, sports, and media occupations (3.7%)
Most popular occupations of females: sales and office occupations (48.2%); service occupations (28.7%); management occupations (except farmers) (4.9%); business and financial operations occupations (4.6%); production occupations (3.1%); education, training, and library occupations (2.5%); legal occupations (2.3%)
Highways in this neighborhood: State Hwy 600 (US Hwy 41, US Hwy 92, E Hillsborough Ave); E Busch Blvd (State Hwy 580).
Roads and streets: N 22nd St; N 30th St; Rowlett Park Dr; E Annie St; 99th Ave; E Henry Ave; 97th Ave; N 26th St; E Powhatan Ave; E Yukon St; Deleuil Ave; N 18th St; N 20th St; N 27th St; E Paris St; E Idlewild Ave; N 29th St; E Comanche Ave; E Waters Ave; N 24th St; E Okara Rd; E Sligh Ave; E Hanna Ave; 98th Ave; E Sewaha St; N 19th St; E Clifton St; E 93rd Ave; N 32nd St; N 36th St; N 34th St; N 37th St; N 40th St; N 21st St; N 16th St; N 28th St; N 23rd St; E Mohawk Ave; Diana Ct; E Veve Ln; Elmer St; E Seward St; E Riverhills Dr; N 39th St; Ruth Pl; E Minnehaha St; E Wood St; E Grove St; E Eskimo Ave; E Humphrey St; E Okaloosa Ave; E Skagway Ave; County Hospital; Mary Ave; N 17th St; S Ramona Cir; N Ramona Cir; E Diana St; Margaret Ave; E Flora St; E Rampart St; E Nedro Rd; Fairbanks St; E Fern St; Howell St; E Crawford St; E North St; Rockaway Ct; S Club Ct; Elm Ct; N Rowlett Park Dr; Semmes St; E Juneau St; E Stanley Matthew Cir; E Grove St Cir; Linda Ct; Kelly Ridge Ln; Besito Ct; W Club Ln; Angela Ct; Seagrave Ct; Alameda Ct; Sabina Ct; N Elmer St; Tanbark Ct; Wissahickon Ave; Redwing Ct; 29th St; Oak Tree Ct; Spiral Ct; Saybrook Ct; N 31st St.
Railroad features: Amtrak RR (Csx RR).
Other features: Hillsborough Riv.
Live Oaks Square neighborhood detailed profile
Area: 2.735 square miles
Population: 8,639
Population density:
| Live Oaks Square: | 3,158 people per square mile |
| Tampa: | 3,454 people per square mile |
Median household income in 2021:
| Live Oaks Square: | $56,316 |
| Tampa: | $63,404 |
Median rent in in 2021:
| Live Oaks Square: | $881 |
| Tampa: | $1,191 |
Male vs Females
| Males: | 3,888 |
| Females: | 4,750 |
Median age
| Males: | 33.7 years |
| Females: | 36.6 years |
Average estimated value of detached houses in 2021 (71.6% of all units):
| Live Oaks Square: | $186,990 |
| Tampa: | $477,728 |
Most popular occupations of males: construction, extraction, and maintenance occupations (24.4%); service occupations (22.6%); sales and office occupations (12.9%); management occupations (except farmers) (10.4%); material moving occupations (7.8%); production occupations (4.3%); arts, design, entertainment, sports, and media occupations (3.7%)
Most popular occupations of females: sales and office occupations (48.2%); service occupations (28.7%); management occupations (except farmers) (4.9%); business and financial operations occupations (4.6%); production occupations (3.1%); education, training, and library occupations (2.5%); legal occupations (2.3%)
Highways in this neighborhood: State Hwy 600 (US Hwy 41, US Hwy 92, E Hillsborough Ave); E Busch Blvd (State Hwy 580).
Roads and streets: N 22nd St; N 30th St; Rowlett Park Dr; E Annie St; 99th Ave; E Henry Ave; 97th Ave; N 26th St; E Powhatan Ave; E Yukon St; Deleuil Ave; N 18th St; N 20th St; N 27th St; E Paris St; E Idlewild Ave; N 29th St; E Comanche Ave; E Waters Ave; N 24th St; E Okara Rd; E Sligh Ave; E Hanna Ave; 98th Ave; E Sewaha St; N 19th St; E Clifton St; E 93rd Ave; N 32nd St; N 36th St; N 34th St; N 37th St; N 40th St; N 21st St; N 16th St; N 28th St; N 23rd St; E Mohawk Ave; Diana Ct; E Veve Ln; Elmer St; E Seward St; E Riverhills Dr; N 39th St; Ruth Pl; E Minnehaha St; E Wood St; E Grove St; E Eskimo Ave; E Humphrey St; E Okaloosa Ave; E Skagway Ave; County Hospital; Mary Ave; N 17th St; S Ramona Cir; N Ramona Cir; E Diana St; Margaret Ave; E Flora St; E Rampart St; E Nedro Rd; Fairbanks St; E Fern St; Howell St; E Crawford St; E North St; Rockaway Ct; S Club Ct; Elm Ct; N Rowlett Park Dr; Semmes St; E Juneau St; E Stanley Matthew Cir; E Grove St Cir; Linda Ct; Kelly Ridge Ln; Besito Ct; W Club Ln; Angela Ct; Seagrave Ct; Alameda Ct; Sabina Ct; N Elmer St; Tanbark Ct; Wissahickon Ave; Redwing Ct; 29th St; Oak Tree Ct; Spiral Ct; Saybrook Ct; N 31st St.
Railroad features: Amtrak RR (Csx RR).
Other features: Hillsborough Riv.
Live Oaks Square neighborhood detailed profile
Livingston Heights neighborhood in Tampa statistics: (Find on map)
Area: 0.024 square miles
Population: 33
Population density:
Median household income in 2021:
Median rent in in 2021:
Male vs Females
Median age
Average estimated value of detached houses in 2021 (91.7% of all units):
Most popular occupations of males: construction, extraction, and maintenance occupations (49.5%); transportation occupations (27.5%); material moving occupations (15.6%); sales and office occupations (13.9%); production occupations (9.8%); service occupations (7.3%); management occupations (except farmers) (6.1%)
Most popular occupations of females: sales and office occupations (55.3%); healthcare practitioners and technical occupations (11.4%); service occupations (9.6%); material moving occupations (9.6%); management occupations (except farmers) (7.9%); business and financial operations occupations (4.4%); education, training, and library occupations (1.8%)
Livingston Heights neighborhood detailed profile
Area: 0.024 square miles
Population: 33
Population density:
| Livingston Heights: | 1,363 people per square mile |
| Tampa: | 3,454 people per square mile |
Median household income in 2021:
| Livingston Heights: | $48,750 |
| Tampa: | $63,404 |
Median rent in in 2021:
| Livingston Heights: | $869 |
| Tampa: | $1,191 |
Male vs Females
| Males: | 17 |
| Females: | 16 |
Median age
| Males: | 43.8 years |
| Females: | 41.9 years |
Average estimated value of detached houses in 2021 (91.7% of all units):
| Livingston Heights: | $132,228 |
| Tampa: | $477,728 |
Most popular occupations of males: construction, extraction, and maintenance occupations (49.5%); transportation occupations (27.5%); material moving occupations (15.6%); sales and office occupations (13.9%); production occupations (9.8%); service occupations (7.3%); management occupations (except farmers) (6.1%)
Most popular occupations of females: sales and office occupations (55.3%); healthcare practitioners and technical occupations (11.4%); service occupations (9.6%); material moving occupations (9.6%); management occupations (except farmers) (7.9%); business and financial operations occupations (4.4%); education, training, and library occupations (1.8%)
Livingston Heights neighborhood detailed profile
Locicero Columbia Park neighborhood in Tampa statistics: (Find on map)
Area: 0.027 square miles
Population: 94
Population density:
Median household income in 2021:
Median rent in in 2021:
Male vs Females
Median age
Average estimated value of detached houses in 2021 (79.3% of all units):
Most popular occupations of males: construction, extraction, and maintenance occupations (35.1%); sales and office occupations (22.7%); transportation occupations (15.5%); business and financial operations occupations (12.0%); service occupations (10.8%); management occupations (except farmers) (8.9%); production occupations (4.0%)
Most popular occupations of females: business and financial operations occupations (33.7%); sales and office occupations (30.9%); healthcare practitioners and technical occupations (17.7%); material moving occupations (17.7%); service occupations (12.3%); production occupations (6.6%); farming, fishing, and forestry occupations (2.3%)
Roads and streets: Locicero Dr (Thomas Cir).
Locicero Columbia Park neighborhood detailed profile
Area: 0.027 square miles
Population: 94
Population density:
| Locicero Columbia Park: | 3,495 people per square mile |
| Tampa: | 3,454 people per square mile |
Median household income in 2021:
| Locicero Columbia Park: | $58,594 |
| Tampa: | $63,404 |
Median rent in in 2021:
| Locicero Columbia Park: | $973 |
| Tampa: | $1,191 |
Male vs Females
| Males: | 47 |
| Females: | 46 |
Median age
| Males: | 29.7 years |
| Females: | 34.0 years |
Average estimated value of detached houses in 2021 (79.3% of all units):
| Locicero Columbia Park: | $103,345 |
| Tampa: | $477,728 |
Most popular occupations of males: construction, extraction, and maintenance occupations (35.1%); sales and office occupations (22.7%); transportation occupations (15.5%); business and financial operations occupations (12.0%); service occupations (10.8%); management occupations (except farmers) (8.9%); production occupations (4.0%)
Most popular occupations of females: business and financial operations occupations (33.7%); sales and office occupations (30.9%); healthcare practitioners and technical occupations (17.7%); material moving occupations (17.7%); service occupations (12.3%); production occupations (6.6%); farming, fishing, and forestry occupations (2.3%)
Roads and streets: Locicero Dr (Thomas Cir).
Locicero Columbia Park neighborhood detailed profile
Log Cabin Hills neighborhood in Tampa statistics: (Find on map)
Log Cabin Hills neighborhood detailed profile
Log Cabin Hills neighborhood detailed profile
Logan Gate Village neighborhood in Tampa statistics: (Find on map)
Area: 0.430 square miles
Population: 2,455
Population density:
Median household income in 2021:
Median rent in in 2021:
Male vs Females
Median age
Housing prices:
Average estimated value of detached houses in 2021 (57.2% of all units):
Average estimated value of townhouses or other attached units in 2021 (11.7% of all units):
Most popular occupations of males: service occupations (22.9%); transportation occupations (17.1%); management occupations (except farmers) (13.4%); sales and office occupations (12.7%); construction, extraction, and maintenance occupations (11.4%); computer and mathematical occupations (7.1%); material moving occupations (5.2%)
Most popular occupations of females: sales and office occupations (32.6%); service occupations (28.2%); material moving occupations (8.8%); management occupations (except farmers) (7.2%); production occupations (4.5%); education, training, and library occupations (3.9%); arts, design, entertainment, sports, and media occupations (3.7%)
Roads and streets: Monterey Blvd; Spanish Moss Cir; Reef Cir; Cardiff Dr; Rosemary Dr; Truciou Pl; Mondragon Dr; Swain Ave; Logan Gate Blvd; Gilda Dr; Crystal Brook Dr; Nicole Ln; Monteron Ln; Queensland Ln; Nia Ln; Citrus Valley Dr; Brucie Pl; Villager Ct; Limpet Dr; Regency St; Almendariz Way; Montique Ave; Kiwi Ave; Lunita Ct; White Cliff Way; Logan Pl; Titina Way; Alexandria Dr; Polly Pl; Ajay Ct; Genie Pl; Floral Oak Dr; Sybila Pl; Alida Pl; Cheche Pl; Pota Pl; Bert Pl; Sugar Foot Ct.
Other features: Brushy Crk.
Logan Gate Village neighborhood detailed profile
Area: 0.430 square miles
Population: 2,455
Population density:
| Logan Gate Village: | 5,711 people per square mile |
| Tampa: | 3,454 people per square mile |
Median household income in 2021:
| Logan Gate Village: | $40,595 |
| Tampa: | $63,404 |
Median rent in in 2021:
| Logan Gate Village: | $902 |
| Tampa: | $1,191 |
Male vs Females
| Males: | 904 |
| Females: | 1,550 |
Median age
| Males: | 24.8 years |
| Females: | 28.4 years |
Housing prices:
Average estimated value of detached houses in 2021 (57.2% of all units):
| Logan Gate Village: | $238,025 |
| Tampa: | $477,728 |
Average estimated value of townhouses or other attached units in 2021 (11.7% of all units):
| This neighborhood: | $281,680 |
| city: | $499,254 |
Most popular occupations of males: service occupations (22.9%); transportation occupations (17.1%); management occupations (except farmers) (13.4%); sales and office occupations (12.7%); construction, extraction, and maintenance occupations (11.4%); computer and mathematical occupations (7.1%); material moving occupations (5.2%)
Most popular occupations of females: sales and office occupations (32.6%); service occupations (28.2%); material moving occupations (8.8%); management occupations (except farmers) (7.2%); production occupations (4.5%); education, training, and library occupations (3.9%); arts, design, entertainment, sports, and media occupations (3.7%)
Roads and streets: Monterey Blvd; Spanish Moss Cir; Reef Cir; Cardiff Dr; Rosemary Dr; Truciou Pl; Mondragon Dr; Swain Ave; Logan Gate Blvd; Gilda Dr; Crystal Brook Dr; Nicole Ln; Monteron Ln; Queensland Ln; Nia Ln; Citrus Valley Dr; Brucie Pl; Villager Ct; Limpet Dr; Regency St; Almendariz Way; Montique Ave; Kiwi Ave; Lunita Ct; White Cliff Way; Logan Pl; Titina Way; Alexandria Dr; Polly Pl; Ajay Ct; Genie Pl; Floral Oak Dr; Sybila Pl; Alida Pl; Cheche Pl; Pota Pl; Bert Pl; Sugar Foot Ct.
Other features: Brushy Crk.
Logan Gate Village neighborhood detailed profile
Logan Place neighborhood in Tampa statistics: (Find on map)
Area: 0.011 square miles
Population: 48
Population density:
Median household income in 2021:
Median rent in in 2021:
Male vs Females
Median age
Housing prices:
Average estimated value of detached houses in 2021 (30.0% of all units):
Average estimated value of townhouses or other attached units in 2021 (10.0% of all units):
Most popular occupations of males: management occupations (except farmers) (21.2%); service occupations (16.4%); sales and office occupations (15.1%); computer and mathematical occupations (12.5%); transportation occupations (11.3%); construction, extraction, and maintenance occupations (10.4%); material moving occupations (3.6%)
Most popular occupations of females: service occupations (32.5%); sales and office occupations (31.5%); management occupations (except farmers) (15.0%); business and financial operations occupations (4.6%); healthcare practitioners and technical occupations (4.3%); arts, design, entertainment, sports, and media occupations (3.8%); material moving occupations (3.8%)
Roads and streets: Lunita Ct; Logan Pl.
Logan Place neighborhood detailed profile
Area: 0.011 square miles
Population: 48
Population density:
| Logan Place: | 4,388 people per square mile |
| Tampa: | 3,454 people per square mile |
Median household income in 2021:
| Logan Place: | $56,638 |
| Tampa: | $63,404 |
Median rent in in 2021:
| Logan Place: | $1,246 |
| Tampa: | $1,191 |
Male vs Females
| Males: | 19 |
| Females: | 29 |
Median age
| Males: | 27.8 years |
| Females: | 38.1 years |
Housing prices:
Average estimated value of detached houses in 2021 (30.0% of all units):
| Logan Place: | $255,888 |
| Tampa: | $477,728 |
Average estimated value of townhouses or other attached units in 2021 (10.0% of all units):
| This neighborhood: | $281,680 |
| city: | $499,254 |
Most popular occupations of males: management occupations (except farmers) (21.2%); service occupations (16.4%); sales and office occupations (15.1%); computer and mathematical occupations (12.5%); transportation occupations (11.3%); construction, extraction, and maintenance occupations (10.4%); material moving occupations (3.6%)
Most popular occupations of females: service occupations (32.5%); sales and office occupations (31.5%); management occupations (except farmers) (15.0%); business and financial operations occupations (4.6%); healthcare practitioners and technical occupations (4.3%); arts, design, entertainment, sports, and media occupations (3.8%); material moving occupations (3.8%)
Roads and streets: Lunita Ct; Logan Pl.
Logan Place neighborhood detailed profile
Logan's Bayshore neighborhood in Tampa statistics: (Find on map)
Area: 0.002 square miles
Median household income in 2021:
Median rent in in 2021:
Most popular occupations of males: service occupations (53.2%); sales and office occupations (20.7%); legal occupations (7.8%); healthcare practitioners and technical occupations (7.2%); management occupations (except farmers) (4.1%); computer and mathematical occupations (3.0%); business and financial operations occupations (2.3%)
Most popular occupations of females: service occupations (29.1%); management occupations (except farmers) (20.6%); healthcare practitioners and technical occupations (11.1%); business and financial operations occupations (10.1%); legal occupations (9.5%); architecture and engineering occupations (6.8%); arts, design, entertainment, sports, and media occupations (5.9%)
Logan's Bayshore neighborhood detailed profile
Area: 0.002 square miles
Median household income in 2021:
| Logan's Bayshore: | $101,667 |
| Tampa: | $63,404 |
Median rent in in 2021:
| Logan's Bayshore: | $1,765 |
| Tampa: | $1,191 |
Most popular occupations of males: service occupations (53.2%); sales and office occupations (20.7%); legal occupations (7.8%); healthcare practitioners and technical occupations (7.2%); management occupations (except farmers) (4.1%); computer and mathematical occupations (3.0%); business and financial operations occupations (2.3%)
Most popular occupations of females: service occupations (29.1%); management occupations (except farmers) (20.6%); healthcare practitioners and technical occupations (11.1%); business and financial operations occupations (10.1%); legal occupations (9.5%); architecture and engineering occupations (6.8%); arts, design, entertainment, sports, and media occupations (5.9%)
Logan's Bayshore neighborhood detailed profile
Logan's Park neighborhood in Tampa statistics: (Find on map)
Area: 0.006 square miles
Population: 35
Population density:
Median household income in 2021:
Median rent in in 2021:
Male vs Females
Median age
Most popular occupations of males: management occupations (except farmers) (51.1%); computer and mathematical occupations (13.3%); service occupations (11.1%); arts, design, entertainment, sports, and media occupations (5.7%); business and financial operations occupations (5.2%); sales and office occupations (4.4%); production occupations (4.3%)
Most popular occupations of females: sales and office occupations (34.6%); management occupations (except farmers) (26.3%); service occupations (25.6%); healthcare practitioners and technical occupations (15.5%); legal occupations (12.2%); business and financial operations occupations (11.9%); life, physical, and social science occupations (9.0%)
Logan's Park neighborhood detailed profile
Area: 0.006 square miles
Population: 35
Population density:
| Logan's Park: | 5,574 people per square mile |
| Tampa: | 3,454 people per square mile |
Median household income in 2021:
| Logan's Park: | $31,728 |
| Tampa: | $63,404 |
Median rent in in 2021:
| Logan's Park: | $1,318 |
| Tampa: | $1,191 |
Male vs Females
| Males: | 19 |
| Females: | 15 |
Median age
| Males: | 41.6 years |
| Females: | 26.8 years |
Most popular occupations of males: management occupations (except farmers) (51.1%); computer and mathematical occupations (13.3%); service occupations (11.1%); arts, design, entertainment, sports, and media occupations (5.7%); business and financial operations occupations (5.2%); sales and office occupations (4.4%); production occupations (4.3%)
Most popular occupations of females: sales and office occupations (34.6%); management occupations (except farmers) (26.3%); service occupations (25.6%); healthcare practitioners and technical occupations (15.5%); legal occupations (12.2%); business and financial operations occupations (11.9%); life, physical, and social science occupations (9.0%)
Logan's Park neighborhood detailed profile
Lois Townhomes neighborhood in Tampa statistics: (Find on map)
Population: 1
Population density:
Median household income in 2021:
Median rent in in 2021:
Most popular occupations of males: service occupations (36.4%); business and financial operations occupations (23.1%); management occupations (except farmers) (17.2%); sales and office occupations (12.4%); construction, extraction, and maintenance occupations (8.0%); production occupations (6.9%); transportation occupations (5.8%)
Most popular occupations of females: sales and office occupations (32.2%); healthcare practitioners and technical occupations (19.1%); legal occupations (12.8%); business and financial operations occupations (12.0%); management occupations (except farmers) (11.5%); transportation occupations (10.4%); service occupations (8.2%)
Lois Townhomes neighborhood detailed profile
Population: 1
Population density:
| Lois Townhomes: | 1,821 people per square mile |
| Tampa: | 3,454 people per square mile |
Median household income in 2021:
| Lois Townhomes: | $51,469 |
| Tampa: | $63,404 |
Median rent in in 2021:
| Lois Townhomes: | $1,243 |
| Tampa: | $1,191 |
Most popular occupations of males: service occupations (36.4%); business and financial operations occupations (23.1%); management occupations (except farmers) (17.2%); sales and office occupations (12.4%); construction, extraction, and maintenance occupations (8.0%); production occupations (6.9%); transportation occupations (5.8%)
Most popular occupations of females: sales and office occupations (32.2%); healthcare practitioners and technical occupations (19.1%); legal occupations (12.8%); business and financial operations occupations (12.0%); management occupations (except farmers) (11.5%); transportation occupations (10.4%); service occupations (8.2%)
Lois Townhomes neighborhood detailed profile
Long Industrial Park neighborhood in Tampa statistics: (Find on map)
Area: 0.014 square miles
Population: 3
Population density:
Median household income in 2021:
Median rent in in 2021:
Male vs Females
Median age
Most popular occupations of males: sales and office occupations (39.3%); material moving occupations (34.8%); service occupations (26.6%); production occupations (18.3%); management occupations (except farmers) (15.0%); business and financial operations occupations (14.3%); architecture and engineering occupations (11.6%)
Most popular occupations of females: arts, design, entertainment, sports, and media occupations (34.7%); business and financial operations occupations (31.0%); sales and office occupations (30.1%); service occupations (16.2%); management occupations (except farmers) (9.2%); education, training, and library occupations (5.8%); healthcare practitioners and technical occupations (4.0%)
Long Industrial Park neighborhood detailed profile
Area: 0.014 square miles
Population: 3
Population density:
| Long Industrial Park: | 209 people per square mile |
| Tampa: | 3,454 people per square mile |
Median household income in 2021:
| Long Industrial Park: | $37,765 |
| Tampa: | $63,404 |
Median rent in in 2021:
| Long Industrial Park: | $948 |
| Tampa: | $1,191 |
Male vs Females
| Males: | 1 |
| Females: | 1 |
Median age
| Males: | 34.5 years |
| Females: | 47.3 years |
Most popular occupations of males: sales and office occupations (39.3%); material moving occupations (34.8%); service occupations (26.6%); production occupations (18.3%); management occupations (except farmers) (15.0%); business and financial operations occupations (14.3%); architecture and engineering occupations (11.6%)
Most popular occupations of females: arts, design, entertainment, sports, and media occupations (34.7%); business and financial operations occupations (31.0%); sales and office occupations (30.1%); service occupations (16.2%); management occupations (except farmers) (9.2%); education, training, and library occupations (5.8%); healthcare practitioners and technical occupations (4.0%)
Long Industrial Park neighborhood detailed profile
Long's neighborhood in Tampa statistics: (Find on map)
Area: 0.010 square miles
Population: 7
Population density:
Median household income in 2021:
Median rent in in 2021:
Male vs Females
Median age
Most popular occupations of males: construction, extraction, and maintenance occupations (27.3%); service occupations (25.0%); production occupations (19.4%); sales and office occupations (6.3%); material moving occupations (6.3%); business and financial operations occupations (4.3%); management occupations (except farmers) (3.9%)
Most popular occupations of females: service occupations (60.7%); sales and office occupations (34.1%); legal occupations (5.2%)
Roads and streets: E 15th Ave.
Long's neighborhood detailed profile
Area: 0.010 square miles
Population: 7
Population density:
| Long's: | 699 people per square mile |
| Tampa: | 3,454 people per square mile |
Median household income in 2021:
| Long's: | $38,784 |
| Tampa: | $63,404 |
Median rent in in 2021:
| Long's: | $788 |
| Tampa: | $1,191 |
Male vs Females
| Males: | 4 |
| Females: | 2 |
Median age
| Males: | 31.1 years |
| Females: | 35.2 years |
Most popular occupations of males: construction, extraction, and maintenance occupations (27.3%); service occupations (25.0%); production occupations (19.4%); sales and office occupations (6.3%); material moving occupations (6.3%); business and financial operations occupations (4.3%); management occupations (except farmers) (3.9%)
Most popular occupations of females: service occupations (60.7%); sales and office occupations (34.1%); legal occupations (5.2%)
Roads and streets: E 15th Ave.
Long's neighborhood detailed profile
Longboat Landing neighborhood in Tampa statistics: (Find on map)
Area: 0.025 square miles
Population: 9
Population density:
Median household income in 2021:
Median rent in in 2021:
Male vs Females
Median age
Housing prices:
Average estimated value of detached houses in 2021 (100.0% of all units):
Most popular occupations of males: management occupations (except farmers) (38.2%); sales and office occupations (17.3%); computer and mathematical occupations (16.1%); service occupations (7.1%); legal occupations (5.4%); business and financial operations occupations (5.1%); material moving occupations (4.3%)
Most popular occupations of females: sales and office occupations (52.1%); healthcare practitioners and technical occupations (13.4%); service occupations (8.9%); management occupations (except farmers) (8.2%); business and financial operations occupations (7.5%); education, training, and library occupations (7.5%); legal occupations (3.0%)
Roads and streets: Cayman Dr; Redfield Ln.
Longboat Landing neighborhood detailed profile
Area: 0.025 square miles
Population: 9
Population density:
| Longboat Landing: | 367 people per square mile |
| Tampa: | 3,454 people per square mile |
Median household income in 2021:
| Longboat Landing: | $186,607 |
| Tampa: | $63,404 |
Median rent in in 2021:
| Longboat Landing: | $1,366 |
| Tampa: | $1,191 |
Male vs Females
| Males: | 4 |
| Females: | 5 |
Median age
| Males: | 49.8 years |
| Females: | 47.3 years |
Housing prices:
Average estimated value of detached houses in 2021 (100.0% of all units):
| Longboat Landing: | $510,524 |
| Tampa: | $477,728 |
Most popular occupations of males: management occupations (except farmers) (38.2%); sales and office occupations (17.3%); computer and mathematical occupations (16.1%); service occupations (7.1%); legal occupations (5.4%); business and financial operations occupations (5.1%); material moving occupations (4.3%)
Most popular occupations of females: sales and office occupations (52.1%); healthcare practitioners and technical occupations (13.4%); service occupations (8.9%); management occupations (except farmers) (8.2%); business and financial operations occupations (7.5%); education, training, and library occupations (7.5%); legal occupations (3.0%)
Roads and streets: Cayman Dr; Redfield Ln.
Longboat Landing neighborhood detailed profile
Lorene Terrace neighborhood in Tampa statistics: (Find on map)
Area: 0.034 square miles
Roads and streets: Chapel Way; Habana Pl.
Lorene Terrace neighborhood detailed profile
Area: 0.034 square miles
Roads and streets: Chapel Way; Habana Pl.
Lorene Terrace neighborhood detailed profile
Lorraine Estates neighborhood in Tampa statistics: (Find on map)
Area: 0.030 square miles
Population: 39
Population density:
Median household income in 2021:
Male vs Females
Median age
Average estimated value of detached houses in 2021 (100.0% of all units):
Most popular occupations of males: transportation occupations (43.8%); sales and office occupations (21.2%); community and social services occupations (18.5%); construction, extraction, and maintenance occupations (17.8%); service occupations (16.4%); management occupations (except farmers) (13.6%); material moving occupations (13.6%)
Most popular occupations of females: service occupations (39.8%); sales and office occupations (31.3%); transportation occupations (21.4%); arts, design, entertainment, sports, and media occupations (15.3%); education, training, and library occupations (8.0%); management occupations (except farmers) (5.7%); business and financial operations occupations (5.4%)
Roads and streets: W Flora St; W Cluster Ave; N Packwood Ave; N Fremont Ave.
Lorraine Estates neighborhood detailed profile
Area: 0.030 square miles
Population: 39
Population density:
| Lorraine Estates: | 1,312 people per square mile |
| Tampa: | 3,454 people per square mile |
Median household income in 2021:
| Lorraine Estates: | $41,340 |
| Tampa: | $63,404 |
Male vs Females
| Males: | 21 |
| Females: | 17 |
Median age
| Males: | 61.2 years |
| Females: | 27.5 years |
Average estimated value of detached houses in 2021 (100.0% of all units):
| Lorraine Estates: | $215,247 |
| Tampa: | $477,728 |
Most popular occupations of males: transportation occupations (43.8%); sales and office occupations (21.2%); community and social services occupations (18.5%); construction, extraction, and maintenance occupations (17.8%); service occupations (16.4%); management occupations (except farmers) (13.6%); material moving occupations (13.6%)
Most popular occupations of females: service occupations (39.8%); sales and office occupations (31.3%); transportation occupations (21.4%); arts, design, entertainment, sports, and media occupations (15.3%); education, training, and library occupations (8.0%); management occupations (except farmers) (5.7%); business and financial operations occupations (5.4%)
Roads and streets: W Flora St; W Cluster Ave; N Packwood Ave; N Fremont Ave.
Lorraine Estates neighborhood detailed profile
Los Altos neighborhood in Tampa statistics: (Find on map)
Area: 0.004 square miles
Population: 22
Population density:
Median household income in 2021:
Median rent in in 2021:
Male vs Females
Median age
Most popular occupations of males: sales and office occupations (32.9%); management occupations (except farmers) (20.0%); service occupations (13.2%); business and financial operations occupations (9.3%); computer and mathematical occupations (8.1%); architecture and engineering occupations (6.3%); education, training, and library occupations (5.8%)
Most popular occupations of females: sales and office occupations (27.6%); business and financial operations occupations (17.4%); service occupations (13.9%); healthcare practitioners and technical occupations (13.5%); computer and mathematical occupations (10.9%); management occupations (except farmers) (9.9%); education, training, and library occupations (4.4%)
Los Altos neighborhood detailed profile
Area: 0.004 square miles
Population: 22
Population density:
| Los Altos: | 5,845 people per square mile |
| Tampa: | 3,454 people per square mile |
Median household income in 2021:
| Los Altos: | $104,688 |
| Tampa: | $63,404 |
Median rent in in 2021:
| Los Altos: | $1,400 |
| Tampa: | $1,191 |
Male vs Females
| Males: | 9 |
| Females: | 12 |
Median age
| Males: | 40.2 years |
| Females: | 33.8 years |
Most popular occupations of males: sales and office occupations (32.9%); management occupations (except farmers) (20.0%); service occupations (13.2%); business and financial operations occupations (9.3%); computer and mathematical occupations (8.1%); architecture and engineering occupations (6.3%); education, training, and library occupations (5.8%)
Most popular occupations of females: sales and office occupations (27.6%); business and financial operations occupations (17.4%); service occupations (13.9%); healthcare practitioners and technical occupations (13.5%); computer and mathematical occupations (10.9%); management occupations (except farmers) (9.9%); education, training, and library occupations (4.4%)
Los Altos neighborhood detailed profile
Los Cien neighborhood in Tampa statistics: (Find on map)
Area: 0.029 square miles
Roads and streets: W Dewey St; W Leroy St; N Tampania Ave.
Los Cien neighborhood detailed profile
Area: 0.029 square miles
Roads and streets: W Dewey St; W Leroy St; N Tampania Ave.
Los Cien neighborhood detailed profile
Louis Place neighborhood in Tampa statistics: (Find on map)
Area: 0.007 square miles
Population: 16
Population density:
Median household income in 2021:
Median rent in in 2021:
Male vs Females
Median age
Most popular occupations of males: sales and office occupations (27.2%); legal occupations (23.0%); business and financial operations occupations (15.7%); service occupations (12.8%); transportation occupations (12.3%); healthcare practitioners and technical occupations (9.0%); management occupations (except farmers) (8.2%)
Most popular occupations of females: healthcare practitioners and technical occupations (27.3%); sales and office occupations (14.9%); computer and mathematical occupations (11.8%); education, training, and library occupations (10.4%); management occupations (except farmers) (8.3%); architecture and engineering occupations (7.6%); legal occupations (5.9%)
Louis Place neighborhood detailed profile
Area: 0.007 square miles
Population: 16
Population density:
| Louis Place: | 2,182 people per square mile |
| Tampa: | 3,454 people per square mile |
Median household income in 2021:
| Louis Place: | $75,172 |
| Tampa: | $63,404 |
Median rent in in 2021:
| Louis Place: | $1,147 |
| Tampa: | $1,191 |
Male vs Females
| Males: | 7 |
| Females: | 9 |
Median age
| Males: | 32.9 years |
| Females: | 32.3 years |
Most popular occupations of males: sales and office occupations (27.2%); legal occupations (23.0%); business and financial operations occupations (15.7%); service occupations (12.8%); transportation occupations (12.3%); healthcare practitioners and technical occupations (9.0%); management occupations (except farmers) (8.2%)
Most popular occupations of females: healthcare practitioners and technical occupations (27.3%); sales and office occupations (14.9%); computer and mathematical occupations (11.8%); education, training, and library occupations (10.4%); management occupations (except farmers) (8.3%); architecture and engineering occupations (7.6%); legal occupations (5.9%)
Louis Place neighborhood detailed profile
Lowe's at Mission Bell neighborhood in Tampa statistics: (Find on map)
Area: 0.035 square miles
Lowe's at Mission Bell neighborhood detailed profile
Area: 0.035 square miles
Lowe's at Mission Bell neighborhood detailed profile
Lowell Village neighborhood in Tampa statistics: (Find on map)
Area: 0.029 square miles
Roads and streets: Leverington St; Lesher Ct; Letitia Ct; Hector Ct; Lawnton Ct.
Lowell Village neighborhood detailed profile
Area: 0.029 square miles
Roads and streets: Leverington St; Lesher Ct; Letitia Ct; Hector Ct; Lawnton Ct.
Lowell Village neighborhood detailed profile
Lowry Lane neighborhood in Tampa statistics: (Find on map)
Area: 0.011 square miles
Population: 13
Population density:
Median household income in 2021:
Male vs Females
Median age
Average estimated value of detached houses in 2021 (100.0% of all units):
Most popular occupations of males: transportation occupations (43.8%); sales and office occupations (21.2%); community and social services occupations (18.5%); construction, extraction, and maintenance occupations (17.8%); service occupations (16.4%); management occupations (except farmers) (13.6%); material moving occupations (13.6%)
Most popular occupations of females: service occupations (39.8%); sales and office occupations (31.3%); transportation occupations (21.3%); arts, design, entertainment, sports, and media occupations (15.3%); education, training, and library occupations (8.0%); management occupations (except farmers) (5.7%); business and financial operations occupations (5.4%)
Lowry Lane neighborhood detailed profile
Area: 0.011 square miles
Population: 13
Population density:
| Lowry Lane: | 1,210 people per square mile |
| Tampa: | 3,454 people per square mile |
Median household income in 2021:
| Lowry Lane: | $41,340 |
| Tampa: | $63,404 |
Male vs Females
| Males: | 7 |
| Females: | 6 |
Median age
| Males: | 61.2 years |
| Females: | 27.5 years |
Average estimated value of detached houses in 2021 (100.0% of all units):
| Lowry Lane: | $215,247 |
| Tampa: | $477,728 |
Most popular occupations of males: transportation occupations (43.8%); sales and office occupations (21.2%); community and social services occupations (18.5%); construction, extraction, and maintenance occupations (17.8%); service occupations (16.4%); management occupations (except farmers) (13.6%); material moving occupations (13.6%)
Most popular occupations of females: service occupations (39.8%); sales and office occupations (31.3%); transportation occupations (21.3%); arts, design, entertainment, sports, and media occupations (15.3%); education, training, and library occupations (8.0%); management occupations (except farmers) (5.7%); business and financial operations occupations (5.4%)
Lowry Lane neighborhood detailed profile
Lowry Oaks neighborhood in Tampa statistics: (Find on map)
Area: 0.005 square miles
Population: 22
Population density:
Median household income in 2021:
Median rent in in 2021:
Male vs Females
Median age
Most popular occupations of males: service occupations (25.6%); transportation occupations (20.4%); management occupations (except farmers) (15.0%); sales and office occupations (12.0%); material moving occupations (9.6%); architecture and engineering occupations (6.6%); computer and mathematical occupations (5.7%)
Most popular occupations of females: sales and office occupations (33.5%); service occupations (25.6%); transportation occupations (13.3%); arts, design, entertainment, sports, and media occupations (8.4%); education, training, and library occupations (3.7%); management occupations (except farmers) (3.3%); business and financial operations occupations (3.3%)
Lowry Oaks neighborhood detailed profile
Area: 0.005 square miles
Population: 22
Population density:
| Lowry Oaks: | 4,451 people per square mile |
| Tampa: | 3,454 people per square mile |
Median household income in 2021:
| Lowry Oaks: | $64,514 |
| Tampa: | $63,404 |
Median rent in in 2021:
| Lowry Oaks: | $893 |
| Tampa: | $1,191 |
Male vs Females
| Males: | 8 |
| Females: | 13 |
Median age
| Males: | 52.8 years |
| Females: | 46.6 years |
Most popular occupations of males: service occupations (25.6%); transportation occupations (20.4%); management occupations (except farmers) (15.0%); sales and office occupations (12.0%); material moving occupations (9.6%); architecture and engineering occupations (6.6%); computer and mathematical occupations (5.7%)
Most popular occupations of females: sales and office occupations (33.5%); service occupations (25.6%); transportation occupations (13.3%); arts, design, entertainment, sports, and media occupations (8.4%); education, training, and library occupations (3.7%); management occupations (except farmers) (3.3%); business and financial operations occupations (3.3%)
Lowry Oaks neighborhood detailed profile
Lowry Park Central neighborhood in Tampa statistics: (Find on map)
Area: 0.814 square miles
Population: 2,321
Population density:
Median household income in 2021:
Median rent in in 2021:
Male vs Females
Median age
Average estimated value of detached houses in 2021 (75.1% of all units):
Most popular occupations of males: service occupations (23.4%); transportation occupations (17.6%); sales and office occupations (15.3%); management occupations (except farmers) (10.8%); construction, extraction, and maintenance occupations (7.6%); architecture and engineering occupations (7.0%); legal occupations (5.4%)
Most popular occupations of females: sales and office occupations (30.1%); service occupations (23.4%); transportation occupations (19.3%); arts, design, entertainment, sports, and media occupations (7.8%); education, training, and library occupations (6.7%); management occupations (except farmers) (6.0%); business and financial operations occupations (1.5%)
Roads and streets: N Newport Ave; W Sitka St; N Blvd; N Orleans Ave; W Sligh Ave; W Kirby St; N River Shore Dr; N Ola Ave; W Hollywood St; Lynn Ave; W Patterson St; W Clinton St; W Juneau St; W Flora St; North Dakota Ave; N Edison Ave; N Oregon Ave; W Hamilton Ave; N Willow Ave; W Bird St; W Whatley Pl; el Portal Dr; W Lowry Ln; Fielding Ave; W Robson St; W Gaston Pl; W Broad St; N Brevard St; Otis Ave; Clarissa St (W Carissa Ct); Arboleda Ct; W Warner Cir; Hall Pl; N Newport St.
Other features: Hillsborough Riv.
Lowry Park Central neighborhood detailed profile
Area: 0.814 square miles
Population: 2,321
Population density:
| Lowry Park Central: | 2,853 people per square mile |
| Tampa: | 3,454 people per square mile |
Median household income in 2021:
| Lowry Park Central: | $48,352 |
| Tampa: | $63,404 |
Median rent in in 2021:
| Lowry Park Central: | $520 |
| Tampa: | $1,191 |
Male vs Females
| Males: | 1,081 |
| Females: | 1,240 |
Median age
| Males: | 46.2 years |
| Females: | 37.5 years |
Average estimated value of detached houses in 2021 (75.1% of all units):
| Lowry Park Central: | $191,082 |
| Tampa: | $477,728 |
Most popular occupations of males: service occupations (23.4%); transportation occupations (17.6%); sales and office occupations (15.3%); management occupations (except farmers) (10.8%); construction, extraction, and maintenance occupations (7.6%); architecture and engineering occupations (7.0%); legal occupations (5.4%)
Most popular occupations of females: sales and office occupations (30.1%); service occupations (23.4%); transportation occupations (19.3%); arts, design, entertainment, sports, and media occupations (7.8%); education, training, and library occupations (6.7%); management occupations (except farmers) (6.0%); business and financial operations occupations (1.5%)
Roads and streets: N Newport Ave; W Sitka St; N Blvd; N Orleans Ave; W Sligh Ave; W Kirby St; N River Shore Dr; N Ola Ave; W Hollywood St; Lynn Ave; W Patterson St; W Clinton St; W Juneau St; W Flora St; North Dakota Ave; N Edison Ave; N Oregon Ave; W Hamilton Ave; N Willow Ave; W Bird St; W Whatley Pl; el Portal Dr; W Lowry Ln; Fielding Ave; W Robson St; W Gaston Pl; W Broad St; N Brevard St; Otis Ave; Clarissa St (W Carissa Ct); Arboleda Ct; W Warner Cir; Hall Pl; N Newport St.
Other features: Hillsborough Riv.
Lowry Park Central neighborhood detailed profile
Lowry Park North neighborhood in Tampa statistics: (Find on map)
Area: 0.957 square miles
Population: 4,098
Population density:
Median household income in 2021:
Median rent in in 2021:
Male vs Females
Median age
Housing prices:
Average estimated value of detached houses in 2021 (78.4% of all units):
Average estimated value of townhouses or other attached units in 2021 (6.3% of all units):
Average estimated value of mobile home in 2021 (70.9% of all units):
Most popular occupations of males: service occupations (16.5%); transportation occupations (11.8%); construction, extraction, and maintenance occupations (10.4%); production occupations (10.3%); sales and office occupations (8.5%); management occupations (except farmers) (5.2%); business and financial operations occupations (4.9%)
Most popular occupations of females: sales and office occupations (40.3%); service occupations (27.6%); management occupations (except farmers) (15.4%); education, training, and library occupations (8.5%); transportation occupations (3.2%); legal occupations (3.0%); business and financial operations occupations (1.9%)
Limited-access highways (interstate or state) in this neighborhood: I- 275 (State Hwy 93).
Highways in this neighborhood: US Hwy 41 Bus (N Florida Ave, State Hwy 685); State Hwy 580 (W Busch Blvd).
Roads and streets: W Humphrey St; Co Rd 584 (W Waters Ave); W Wood St; W Yukon St; el Portal Dr; W Arctic St; N Newport Ave; N Blvd; N Rome Ave; N Orleans Ave; N Dexter Ave; Otis Ave; N Hamner Ave; Lynn Ave; N Ashley St; N Ola Ave; N Highland Ave; N Tampa St; Jones Ave; Westchester Cir; N Willow Ave; N Edison Ave; N Packwood Ave; W Okaloosa Ave; N Albany Ave; W Burger St; E Yukon St; W Skagway Ave; Seminole Ave; Dixon Ave; N Branch Ave; N Suwanee Ave; E Seward St; E Waters Ave (Co Rd 584); E Wood St; E Fairbanks St; Whispering Pines Dr; Crestview Dr; E Rampart St; N Central Ave; N Waterford Ave; Blue Spruce Way; W Atkinson St; N Chevalier Ave; W Burch St; W Rampart St; Juniper St; W Two Lakes Rd; Cool Spring Rd; N Oregon Ave; Locust Ave; Whitehall Ct; N Saulray St; Redwood Ct; Pine Cone Ct; Westchester Ct; Wellington Ct; W Coco Ct; Long Needle Ct; E Wimbleton Ct; Evergreen Ct; Pinetree Ct; N Jones Ave.
Railroad features: Csx RR (Amtrak RR).
Lowry Park North neighborhood detailed profile
Area: 0.957 square miles
Population: 4,098
Population density:
| Lowry Park North: | 4,282 people per square mile |
| Tampa: | 3,454 people per square mile |
Median household income in 2021:
| Lowry Park North: | $45,938 |
| Tampa: | $63,404 |
Median rent in in 2021:
| Lowry Park North: | $519 |
| Tampa: | $1,191 |
Male vs Females
| Males: | 2,320 |
| Females: | 1,778 |
Median age
| Males: | 40.4 years |
| Females: | 42.6 years |
Housing prices:
Average estimated value of detached houses in 2021 (78.4% of all units):
| Lowry Park North: | $180,424 |
| Tampa: | $477,728 |
Average estimated value of townhouses or other attached units in 2021 (6.3% of all units):
| This neighborhood: | $162,439 |
| city: | $499,254 |
Average estimated value of mobile home in 2021 (70.9% of all units):
| Lowry Park North: | $29,060 |
| Tampa: | $95,765 |
Most popular occupations of males: service occupations (16.5%); transportation occupations (11.8%); construction, extraction, and maintenance occupations (10.4%); production occupations (10.3%); sales and office occupations (8.5%); management occupations (except farmers) (5.2%); business and financial operations occupations (4.9%)
Most popular occupations of females: sales and office occupations (40.3%); service occupations (27.6%); management occupations (except farmers) (15.4%); education, training, and library occupations (8.5%); transportation occupations (3.2%); legal occupations (3.0%); business and financial operations occupations (1.9%)
Limited-access highways (interstate or state) in this neighborhood: I- 275 (State Hwy 93).
Highways in this neighborhood: US Hwy 41 Bus (N Florida Ave, State Hwy 685); State Hwy 580 (W Busch Blvd).
Roads and streets: W Humphrey St; Co Rd 584 (W Waters Ave); W Wood St; W Yukon St; el Portal Dr; W Arctic St; N Newport Ave; N Blvd; N Rome Ave; N Orleans Ave; N Dexter Ave; Otis Ave; N Hamner Ave; Lynn Ave; N Ashley St; N Ola Ave; N Highland Ave; N Tampa St; Jones Ave; Westchester Cir; N Willow Ave; N Edison Ave; N Packwood Ave; W Okaloosa Ave; N Albany Ave; W Burger St; E Yukon St; W Skagway Ave; Seminole Ave; Dixon Ave; N Branch Ave; N Suwanee Ave; E Seward St; E Waters Ave (Co Rd 584); E Wood St; E Fairbanks St; Whispering Pines Dr; Crestview Dr; E Rampart St; N Central Ave; N Waterford Ave; Blue Spruce Way; W Atkinson St; N Chevalier Ave; W Burch St; W Rampart St; Juniper St; W Two Lakes Rd; Cool Spring Rd; N Oregon Ave; Locust Ave; Whitehall Ct; N Saulray St; Redwood Ct; Pine Cone Ct; Westchester Ct; Wellington Ct; W Coco Ct; Long Needle Ct; E Wimbleton Ct; Evergreen Ct; Pinetree Ct; N Jones Ave.
Railroad features: Csx RR (Amtrak RR).
Lowry Park North neighborhood detailed profile
Lullaby Pines neighborhood in Tampa statistics: (Find on map)
Population: 1
Population density:
Median household income in 2021:
Median rent in in 2021:
Most popular occupations of males: service occupations (32.4%); sales and office occupations (25.6%); transportation occupations (21.7%); management occupations (except farmers) (20.6%); construction, extraction, and maintenance occupations (8.2%); material moving occupations (6.8%); production occupations (5.3%)
Most popular occupations of females: sales and office occupations (20.1%); business and financial operations occupations (18.7%); farming, fishing, and forestry occupations (10.5%); production occupations (9.6%); transportation occupations (9.6%); service occupations (8.6%); arts, design, entertainment, sports, and media occupations (7.7%)
Lullaby Pines neighborhood detailed profile
Population: 1
Population density:
| Lullaby Pines: | 1,710 people per square mile |
| Tampa: | 3,454 people per square mile |
Median household income in 2021:
| Lullaby Pines: | $27,802 |
| Tampa: | $63,404 |
Median rent in in 2021:
| Lullaby Pines: | $960 |
| Tampa: | $1,191 |
Most popular occupations of males: service occupations (32.4%); sales and office occupations (25.6%); transportation occupations (21.7%); management occupations (except farmers) (20.6%); construction, extraction, and maintenance occupations (8.2%); material moving occupations (6.8%); production occupations (5.3%)
Most popular occupations of females: sales and office occupations (20.1%); business and financial operations occupations (18.7%); farming, fishing, and forestry occupations (10.5%); production occupations (9.6%); transportation occupations (9.6%); service occupations (8.6%); arts, design, entertainment, sports, and media occupations (7.7%)
Lullaby Pines neighborhood detailed profile
Luna Park neighborhood in Tampa statistics: (Find on map)
Area: 0.010 square miles
Luna Park neighborhood detailed profile
Area: 0.010 square miles
Luna Park neighborhood detailed profile
Lurline Terrace neighborhood in Tampa statistics: (Find on map)
Area: 0.014 square miles
Lurline Terrace neighborhood detailed profile
Area: 0.014 square miles
Lurline Terrace neighborhood detailed profile
Lykes Estates neighborhood in Tampa statistics: (Find on map)
Area: 0.028 square miles
Population: 14
Population density:
Median household income in 2021:
Median rent in in 2021:
Male vs Females
Median age
Housing prices:
Average estimated value of detached houses in 2021 (71.4% of all units):
Average estimated value of townhouses or other attached units in 2021 (14.3% of all units):
Most popular occupations of males: service occupations (53.2%); sales and office occupations (20.7%); legal occupations (7.8%); healthcare practitioners and technical occupations (7.2%); management occupations (except farmers) (4.1%); computer and mathematical occupations (2.9%); business and financial operations occupations (2.3%)
Most popular occupations of females: service occupations (29.1%); management occupations (except farmers) (20.6%); healthcare practitioners and technical occupations (11.1%); business and financial operations occupations (10.1%); legal occupations (9.5%); architecture and engineering occupations (6.8%); arts, design, entertainment, sports, and media occupations (5.7%)
Lykes Estates neighborhood detailed profile
Area: 0.028 square miles
Population: 14
Population density:
| Lykes Estates: | 494 people per square mile |
| Tampa: | 3,454 people per square mile |
Median household income in 2021:
| Lykes Estates: | $101,667 |
| Tampa: | $63,404 |
Median rent in in 2021:
| Lykes Estates: | $1,765 |
| Tampa: | $1,191 |
Male vs Females
| Males: | 7 |
| Females: | 6 |
Median age
| Males: | 46.4 years |
| Females: | 38.5 years |
Housing prices:
Average estimated value of detached houses in 2021 (71.4% of all units):
| Lykes Estates: | $420,333 |
| Tampa: | $477,728 |
Average estimated value of townhouses or other attached units in 2021 (14.3% of all units):
| This neighborhood: | $310,244 |
| city: | $499,254 |
Most popular occupations of males: service occupations (53.2%); sales and office occupations (20.7%); legal occupations (7.8%); healthcare practitioners and technical occupations (7.2%); management occupations (except farmers) (4.1%); computer and mathematical occupations (2.9%); business and financial operations occupations (2.3%)
Most popular occupations of females: service occupations (29.1%); management occupations (except farmers) (20.6%); healthcare practitioners and technical occupations (11.1%); business and financial operations occupations (10.1%); legal occupations (9.5%); architecture and engineering occupations (6.8%); arts, design, entertainment, sports, and media occupations (5.7%)
Lykes Estates neighborhood detailed profile
Lykes Lane neighborhood in Tampa statistics: (Find on map)
Area: 0.034 square miles
Population: 17
Population density:
Median household income in 2021:
Median rent in in 2021:
Male vs Females
Median age
Housing prices:
Average estimated value of detached houses in 2021 (66.7% of all units):
Average estimated value of townhouses or other attached units in 2021 (11.1% of all units):
Most popular occupations of males: service occupations (53.2%); sales and office occupations (20.7%); legal occupations (7.8%); healthcare practitioners and technical occupations (7.2%); management occupations (except farmers) (4.1%); computer and mathematical occupations (2.9%); business and financial operations occupations (2.3%)
Most popular occupations of females: service occupations (29.1%); management occupations (except farmers) (20.6%); healthcare practitioners and technical occupations (11.1%); business and financial operations occupations (10.1%); legal occupations (9.5%); architecture and engineering occupations (6.8%); arts, design, entertainment, sports, and media occupations (5.7%)
Lykes Lane neighborhood detailed profile
Area: 0.034 square miles
Population: 17
Population density:
| Lykes Lane: | 506 people per square mile |
| Tampa: | 3,454 people per square mile |
Median household income in 2021:
| Lykes Lane: | $101,667 |
| Tampa: | $63,404 |
Median rent in in 2021:
| Lykes Lane: | $1,765 |
| Tampa: | $1,191 |
Male vs Females
| Males: | 8 |
| Females: | 8 |
Median age
| Males: | 46.4 years |
| Females: | 38.5 years |
Housing prices:
Average estimated value of detached houses in 2021 (66.7% of all units):
| Lykes Lane: | $420,333 |
| Tampa: | $477,728 |
Average estimated value of townhouses or other attached units in 2021 (11.1% of all units):
| This neighborhood: | $310,244 |
| city: | $499,254 |
Most popular occupations of males: service occupations (53.2%); sales and office occupations (20.7%); legal occupations (7.8%); healthcare practitioners and technical occupations (7.2%); management occupations (except farmers) (4.1%); computer and mathematical occupations (2.9%); business and financial operations occupations (2.3%)
Most popular occupations of females: service occupations (29.1%); management occupations (except farmers) (20.6%); healthcare practitioners and technical occupations (11.1%); business and financial operations occupations (10.1%); legal occupations (9.5%); architecture and engineering occupations (6.8%); arts, design, entertainment, sports, and media occupations (5.7%)
Lykes Lane neighborhood detailed profile
Lynn Lake neighborhood in Tampa statistics: (Find on map)
Area: 0.070 square miles
Population: 230
Population density:
Median household income in 2021:
Median rent in in 2021:
Male vs Females
Median age
Most popular occupations of males: construction, extraction, and maintenance occupations (49.6%); sales and office occupations (21.9%); management occupations (except farmers) (10.9%); healthcare practitioners and technical occupations (4.6%); production occupations (4.3%); education, training, and library occupations (3.0%); computer and mathematical occupations (2.5%)
Most popular occupations of females: service occupations (47.0%); sales and office occupations (24.1%); business and financial operations occupations (9.0%); healthcare practitioners and technical occupations (8.6%); management occupations (except farmers) (7.6%); education, training, and library occupations (2.4%); computer and mathematical occupations (1.4%)
Roads and streets: Lynn Lake Cir.
Lynn Lake neighborhood detailed profile
Area: 0.070 square miles
Population: 230
Population density:
| Lynn Lake: | 3,274 people per square mile |
| Tampa: | 3,454 people per square mile |
Median household income in 2021:
| Lynn Lake: | $90,956 |
| Tampa: | $63,404 |
Median rent in in 2021:
| Lynn Lake: | $1,737 |
| Tampa: | $1,191 |
Male vs Females
| Males: | 89 |
| Females: | 141 |
Median age
| Males: | 49.1 years |
| Females: | 35.1 years |
Most popular occupations of males: construction, extraction, and maintenance occupations (49.6%); sales and office occupations (21.9%); management occupations (except farmers) (10.9%); healthcare practitioners and technical occupations (4.6%); production occupations (4.3%); education, training, and library occupations (3.0%); computer and mathematical occupations (2.5%)
Most popular occupations of females: service occupations (47.0%); sales and office occupations (24.1%); business and financial operations occupations (9.0%); healthcare practitioners and technical occupations (8.6%); management occupations (except farmers) (7.6%); education, training, and library occupations (2.4%); computer and mathematical occupations (1.4%)
Roads and streets: Lynn Lake Cir.
Lynn Lake neighborhood detailed profile
Lynnette Estates neighborhood in Tampa statistics: (Find on map)
Area: 0.003 square miles
Lynnette Estates neighborhood detailed profile
Area: 0.003 square miles
Lynnette Estates neighborhood detailed profile
Lynwood neighborhood in Tampa statistics: (Find on map)
Area: 0.077 square miles
Population: 232
Population density:
Median household income in 2021:
Median rent in in 2021:
Male vs Females
Median age
Average estimated value of detached houses in 2021 (97.4% of all units):
Most popular occupations of males: management occupations (except farmers) (37.0%); healthcare practitioners and technical occupations (17.7%); service occupations (13.2%); sales and office occupations (13.1%); legal occupations (6.8%); transportation occupations (4.5%); business and financial operations occupations (3.8%)
Most popular occupations of females: computer and mathematical occupations (36.2%); education, training, and library occupations (23.4%); service occupations (18.1%); life, physical, and social science occupations (14.2%); business and financial operations occupations (10.1%); healthcare practitioners and technical occupations (10.1%); sales and office occupations (4.9%)
Roads and streets: Drexel Ave; S Lynwood Ave; S Kenwood Ave; W Tambay Ave; Greenwood Dr; W Bay Vista Ave; W Wallcraft Ave; W Bay Villa Ave; W Knights Ave.
Lynwood neighborhood detailed profile
Area: 0.077 square miles
Population: 232
Population density:
| Lynwood: | 2,995 people per square mile |
| Tampa: | 3,454 people per square mile |
Median household income in 2021:
| Lynwood: | $204,693 |
| Tampa: | $63,404 |
Median rent in in 2021:
| Lynwood: | $1,442 |
| Tampa: | $1,191 |
Male vs Females
| Males: | 101 |
| Females: | 131 |
Median age
| Males: | 56.8 years |
| Females: | 50.6 years |
Average estimated value of detached houses in 2021 (97.4% of all units):
| Lynwood: | $540,460 |
| Tampa: | $477,728 |
Most popular occupations of males: management occupations (except farmers) (37.0%); healthcare practitioners and technical occupations (17.7%); service occupations (13.2%); sales and office occupations (13.1%); legal occupations (6.8%); transportation occupations (4.5%); business and financial operations occupations (3.8%)
Most popular occupations of females: computer and mathematical occupations (36.2%); education, training, and library occupations (23.4%); service occupations (18.1%); life, physical, and social science occupations (14.2%); business and financial operations occupations (10.1%); healthcare practitioners and technical occupations (10.1%); sales and office occupations (4.9%)
Roads and streets: Drexel Ave; S Lynwood Ave; S Kenwood Ave; W Tambay Ave; Greenwood Dr; W Bay Vista Ave; W Wallcraft Ave; W Bay Villa Ave; W Knights Ave.
Lynwood neighborhood detailed profile
MLK Village neighborhood in Tampa statistics: (Find on map)
Area: 0.003 square miles
Population: 11
Population density:
Median household income in 2021:
Median rent in in 2021:
Male vs Females
Median age
Most popular occupations of males: construction, extraction, and maintenance occupations (43.9%); transportation occupations (37.6%); business and financial operations occupations (17.5%); service occupations (12.9%); life, physical, and social science occupations (11.6%); material moving occupations (10.8%); legal occupations (9.7%)
Most popular occupations of females: sales and office occupations (37.2%); healthcare practitioners and technical occupations (18.6%); management occupations (except farmers) (16.5%); service occupations (16.3%); transportation occupations (12.8%); production occupations (7.3%); computer and mathematical occupations (5.8%)
MLK Village neighborhood detailed profile
Area: 0.003 square miles
Population: 11
Population density:
| MLK Village: | 3,573 people per square mile |
| Tampa: | 3,454 people per square mile |
Median household income in 2021:
| MLK Village: | $18,708 |
| Tampa: | $63,404 |
Median rent in in 2021:
| MLK Village: | $912 |
| Tampa: | $1,191 |
Male vs Females
| Males: | 5 |
| Females: | 6 |
Median age
| Males: | 53.2 years |
| Females: | 44.9 years |
Most popular occupations of males: construction, extraction, and maintenance occupations (43.9%); transportation occupations (37.6%); business and financial operations occupations (17.5%); service occupations (12.9%); life, physical, and social science occupations (11.6%); material moving occupations (10.8%); legal occupations (9.7%)
Most popular occupations of females: sales and office occupations (37.2%); healthcare practitioners and technical occupations (18.6%); management occupations (except farmers) (16.5%); service occupations (16.3%); transportation occupations (12.8%); production occupations (7.3%); computer and mathematical occupations (5.8%)
MLK Village neighborhood detailed profile
Mac Dill Condo neighborhood in Tampa statistics: (Find on map)
Population: 4
Population density:
Median household income in 2021:
Median rent in in 2021:
Male vs Females
Median age
Most popular occupations of males: arts, design, entertainment, sports, and media occupations (18.9%); healthcare practitioners and technical occupations (18.0%); sales and office occupations (15.0%); legal occupations (11.6%); computer and mathematical occupations (9.9%); material moving occupations (9.4%); life, physical, and social science occupations (7.7%)
Most popular occupations of females: sales and office occupations (121.6%); management occupations (except farmers) (71.4%); computer and mathematical occupations (28.6%); business and financial operations occupations (28.0%); service occupations (18.9%); legal occupations (15.5%); healthcare practitioners and technical occupations (11.2%)
Mac Dill Condo neighborhood detailed profile
Population: 4
Population density:
| Mac Dill Condo: | 4,792 people per square mile |
| Tampa: | 3,454 people per square mile |
Median household income in 2021:
| Mac Dill Condo: | $65,761 |
| Tampa: | $63,404 |
Median rent in in 2021:
| Mac Dill Condo: | $1,149 |
| Tampa: | $1,191 |
Male vs Females
| Males: | 2 |
| Females: | 1 |
Median age
| Males: | 46.1 years |
| Females: | 49.5 years |
Most popular occupations of males: arts, design, entertainment, sports, and media occupations (18.9%); healthcare practitioners and technical occupations (18.0%); sales and office occupations (15.0%); legal occupations (11.6%); computer and mathematical occupations (9.9%); material moving occupations (9.4%); life, physical, and social science occupations (7.7%)
Most popular occupations of females: sales and office occupations (121.6%); management occupations (except farmers) (71.4%); computer and mathematical occupations (28.6%); business and financial operations occupations (28.0%); service occupations (18.9%); legal occupations (15.5%); healthcare practitioners and technical occupations (11.2%)
Mac Dill Condo neighborhood detailed profile
Mac Dill Heights neighborhood in Tampa statistics: (Find on map)
Area: 0.047 square miles
Population: 297
Population density:
Median household income in 2021:
Median rent in in 2021:
Male vs Females
Median age
Most popular occupations of males: sales and office occupations (23.1%); arts, design, entertainment, sports, and media occupations (11.2%); healthcare practitioners and technical occupations (10.7%); management occupations (except farmers) (10.1%); material moving occupations (9.7%); legal occupations (7.9%); service occupations (6.2%)
Most popular occupations of females: management occupations (except farmers) (37.7%); sales and office occupations (32.5%); computer and mathematical occupations (11.1%); business and financial operations occupations (7.9%); legal occupations (5.1%); service occupations (2.1%); arts, design, entertainment, sports, and media occupations (1.9%)
Roads and streets: Cherokee Ave; W Paxton Ave; S 6th St.
Mac Dill Heights neighborhood detailed profile
Area: 0.047 square miles
Population: 297
Population density:
| Mac Dill Heights: | 6,311 people per square mile |
| Tampa: | 3,454 people per square mile |
Median household income in 2021:
| Mac Dill Heights: | $64,539 |
| Tampa: | $63,404 |
Median rent in in 2021:
| Mac Dill Heights: | $1,636 |
| Tampa: | $1,191 |
Male vs Females
| Males: | 173 |
| Females: | 123 |
Median age
| Males: | 49.9 years |
| Females: | 41.0 years |
Most popular occupations of males: sales and office occupations (23.1%); arts, design, entertainment, sports, and media occupations (11.2%); healthcare practitioners and technical occupations (10.7%); management occupations (except farmers) (10.1%); material moving occupations (9.7%); legal occupations (7.9%); service occupations (6.2%)
Most popular occupations of females: management occupations (except farmers) (37.7%); sales and office occupations (32.5%); computer and mathematical occupations (11.1%); business and financial operations occupations (7.9%); legal occupations (5.1%); service occupations (2.1%); arts, design, entertainment, sports, and media occupations (1.9%)
Roads and streets: Cherokee Ave; W Paxton Ave; S 6th St.
Mac Dill Heights neighborhood detailed profile
Mac Dill Park neighborhood in Tampa statistics: (Find on map)
Area: 0.052 square miles
Population: 205
Population density:
Median household income in 2021:
Median rent in in 2021:
Male vs Females
Median age
Most popular occupations of males: sales and office occupations (34.8%); material moving occupations (23.7%); management occupations (except farmers) (14.7%); education, training, and library occupations (8.3%); transportation occupations (8.1%); service occupations (4.5%); arts, design, entertainment, sports, and media occupations (4.1%)
Most popular occupations of females: sales and office occupations (44.4%); management occupations (except farmers) (25.3%); business and financial operations occupations (10.8%); legal occupations (6.9%); computer and mathematical occupations (4.7%); service occupations (2.9%); community and social services occupations (2.4%)
Roads and streets: Wallace Ave; Leila Ave; W Tyson Ave; S 6th St; Sherwood Ave.
Mac Dill Park neighborhood detailed profile
Area: 0.052 square miles
Population: 205
Population density:
| Mac Dill Park: | 3,927 people per square mile |
| Tampa: | 3,454 people per square mile |
Median household income in 2021:
| Mac Dill Park: | $60,063 |
| Tampa: | $63,404 |
Median rent in in 2021:
| Mac Dill Park: | $1,523 |
| Tampa: | $1,191 |
Male vs Females
| Males: | 97 |
| Females: | 107 |
Median age
| Males: | 48.1 years |
| Females: | 34.3 years |
Most popular occupations of males: sales and office occupations (34.8%); material moving occupations (23.7%); management occupations (except farmers) (14.7%); education, training, and library occupations (8.3%); transportation occupations (8.1%); service occupations (4.5%); arts, design, entertainment, sports, and media occupations (4.1%)
Most popular occupations of females: sales and office occupations (44.4%); management occupations (except farmers) (25.3%); business and financial operations occupations (10.8%); legal occupations (6.9%); computer and mathematical occupations (4.7%); service occupations (2.9%); community and social services occupations (2.4%)
Roads and streets: Wallace Ave; Leila Ave; W Tyson Ave; S 6th St; Sherwood Ave.
Mac Dill Park neighborhood detailed profile
Mac Farlane Hugh C neighborhood in Tampa statistics: (Find on map)
Area: 0.013 square miles
Population: 43
Population density:
Median household income in 2021:
Median rent in in 2021:
Male vs Females
Median age
Most popular occupations of males: sales and office occupations (83.1%); service occupations (47.5%); transportation occupations (32.6%); management occupations (except farmers) (32.2%); construction, extraction, and maintenance occupations (31.5%); material moving occupations (13.6%); architecture and engineering occupations (11.9%)
Most popular occupations of females: sales and office occupations (43.1%); service occupations (31.5%); education, training, and library occupations (15.4%); production occupations (11.6%); healthcare practitioners and technical occupations (10.6%); computer and mathematical occupations (5.4%); management occupations (except farmers) (4.6%)
Roads and streets: W Warren Ave; W Euclid Ave; N Woodrow Ave.
Mac Farlane Hugh C neighborhood detailed profile
Area: 0.013 square miles
Population: 43
Population density:
| Mac Farlane Hugh C: | 3,197 people per square mile |
| Tampa: | 3,454 people per square mile |
Median household income in 2021:
| Mac Farlane Hugh C: | $52,321 |
| Tampa: | $63,404 |
Median rent in in 2021:
| Mac Farlane Hugh C: | $947 |
| Tampa: | $1,191 |
Male vs Females
| Males: | 15 |
| Females: | 27 |
Median age
| Males: | 31.6 years |
| Females: | 29.5 years |
Most popular occupations of males: sales and office occupations (83.1%); service occupations (47.5%); transportation occupations (32.6%); management occupations (except farmers) (32.2%); construction, extraction, and maintenance occupations (31.5%); material moving occupations (13.6%); architecture and engineering occupations (11.9%)
Most popular occupations of females: sales and office occupations (43.1%); service occupations (31.5%); education, training, and library occupations (15.4%); production occupations (11.6%); healthcare practitioners and technical occupations (10.6%); computer and mathematical occupations (5.4%); management occupations (except farmers) (4.6%)
Roads and streets: W Warren Ave; W Euclid Ave; N Woodrow Ave.
Mac Farlane Hugh C neighborhood detailed profile
Mac Farlane Park neighborhood in Tampa statistics: (Find on map)
Area: 0.431 square miles
Population: 1,607
Population density:
Median household income in 2021:
Median rent in in 2021:
Male vs Females
Median age
Housing prices:
Average estimated value of detached houses in 2021 (77.7% of all units):
Average estimated value of townhouses or other attached units in 2021 (18.0% of all units):
Most popular occupations of males: service occupations (26.0%); sales and office occupations (22.4%); construction, extraction, and maintenance occupations (12.0%); transportation occupations (11.3%); computer and mathematical occupations (5.3%); arts, design, entertainment, sports, and media occupations (4.3%); healthcare practitioners and technical occupations (3.2%)
Most popular occupations of females: sales and office occupations (33.9%); service occupations (17.4%); management occupations (except farmers) (10.4%); education, training, and library occupations (10.2%); business and financial operations occupations (10.0%); transportation occupations (7.5%); arts, design, entertainment, sports, and media occupations (5.5%)
Limited-access highways (interstate or state) in this neighborhood: State Hwy 93 (I- 275).
Roads and streets: N Lincoln Ave; N Mac Dill Ave; N Glen Ave; W Palmetto St; W Cherry St; W Spruce St; Pine St; W Grace St; W Arch St; W la Salle St; W Nassau St; W Laurel St; W Green St; W Main St; W Cypress St; N Matanzas Ave; W Walnut St; N Gomez Ave; W Chestnut St; W Union St; Saint Vincent St; N Jamaica St (W Jamaica St); N Renfrew Ave; Maxwell Pl; N New Jersey Ave.
Mac Farlane Park neighborhood detailed profile
Area: 0.431 square miles
Population: 1,607
Population density:
| Mac Farlane Park: | 3,724 people per square mile |
| Tampa: | 3,454 people per square mile |
Median household income in 2021:
| Mac Farlane Park: | $57,848 |
| Tampa: | $63,404 |
Median rent in in 2021:
| Mac Farlane Park: | $1,161 |
| Tampa: | $1,191 |
Male vs Females
| Males: | 811 |
| Females: | 795 |
Median age
| Males: | 36.4 years |
| Females: | 41.0 years |
Housing prices:
Average estimated value of detached houses in 2021 (77.7% of all units):
| Mac Farlane Park: | $360,862 |
| Tampa: | $477,728 |
Average estimated value of townhouses or other attached units in 2021 (18.0% of all units):
| This neighborhood: | $294,554 |
| city: | $499,254 |
Most popular occupations of males: service occupations (26.0%); sales and office occupations (22.4%); construction, extraction, and maintenance occupations (12.0%); transportation occupations (11.3%); computer and mathematical occupations (5.3%); arts, design, entertainment, sports, and media occupations (4.3%); healthcare practitioners and technical occupations (3.2%)
Most popular occupations of females: sales and office occupations (33.9%); service occupations (17.4%); management occupations (except farmers) (10.4%); education, training, and library occupations (10.2%); business and financial operations occupations (10.0%); transportation occupations (7.5%); arts, design, entertainment, sports, and media occupations (5.5%)
Limited-access highways (interstate or state) in this neighborhood: State Hwy 93 (I- 275).
Roads and streets: N Lincoln Ave; N Mac Dill Ave; N Glen Ave; W Palmetto St; W Cherry St; W Spruce St; Pine St; W Grace St; W Arch St; W la Salle St; W Nassau St; W Laurel St; W Green St; W Main St; W Cypress St; N Matanzas Ave; W Walnut St; N Gomez Ave; W Chestnut St; W Union St; Saint Vincent St; N Jamaica St (W Jamaica St); N Renfrew Ave; Maxwell Pl; N New Jersey Ave.
Mac Farlane Park neighborhood detailed profile
Mac Farlane's and Hermann's neighborhood in Tampa statistics: (Find on map)
Area: 0.013 square miles
Population: 106
Population density:
Median household income in 2021:
Median rent in in 2021:
Male vs Females
Median age
Most popular occupations of males: sales and office occupations (29.2%); computer and mathematical occupations (25.8%); healthcare practitioners and technical occupations (12.3%); service occupations (11.0%); construction, extraction, and maintenance occupations (10.6%); transportation occupations (5.5%); arts, design, entertainment, sports, and media occupations (3.6%)
Most popular occupations of females: sales and office occupations (32.3%); service occupations (23.7%); management occupations (except farmers) (15.1%); business and financial operations occupations (13.4%); transportation occupations (12.0%); computer and mathematical occupations (11.8%); arts, design, entertainment, sports, and media occupations (11.1%)
Roads and streets: W Main St.
Mac Farlane's and Hermann's neighborhood detailed profile
Area: 0.013 square miles
Population: 106
Population density:
| Mac Farlane's and Hermann's: | 8,359 people per square mile |
| Tampa: | 3,454 people per square mile |
Median household income in 2021:
| Mac Farlane's and Hermann's: | $66,563 |
| Tampa: | $63,404 |
Median rent in in 2021:
| Mac Farlane's and Hermann's: | $1,006 |
| Tampa: | $1,191 |
Male vs Females
| Males: | 47 |
| Females: | 59 |
Median age
| Males: | 58.8 years |
| Females: | 53.2 years |
Most popular occupations of males: sales and office occupations (29.2%); computer and mathematical occupations (25.8%); healthcare practitioners and technical occupations (12.3%); service occupations (11.0%); construction, extraction, and maintenance occupations (10.6%); transportation occupations (5.5%); arts, design, entertainment, sports, and media occupations (3.6%)
Most popular occupations of females: sales and office occupations (32.3%); service occupations (23.7%); management occupations (except farmers) (15.1%); business and financial operations occupations (13.4%); transportation occupations (12.0%); computer and mathematical occupations (11.8%); arts, design, entertainment, sports, and media occupations (11.1%)
Roads and streets: W Main St.
Mac Farlane's and Hermann's neighborhood detailed profile
Macdill Estates neighborhood in Tampa statistics: (Find on map)
Area: 0.018 square miles
Population: 33
Population density:
Median household income in 2021:
Median rent in in 2021:
Male vs Females
Median age
Housing prices:
Average estimated value of detached houses in 2021 (84.6% of all units):
Average estimated value of townhouses or other attached units in 2021 (7.7% of all units):
Most popular occupations of males: sales and office occupations (48.5%); healthcare practitioners and technical occupations (12.2%); architecture and engineering occupations (10.2%); transportation occupations (9.6%); management occupations (except farmers) (5.9%); service occupations (5.9%); material moving occupations (2.5%)
Most popular occupations of females: business and financial operations occupations (31.8%); computer and mathematical occupations (23.5%); service occupations (23.5%); material moving occupations (9.5%); sales and office occupations (5.4%); management occupations (except farmers) (2.0%); legal occupations (1.1%)
Macdill Estates neighborhood detailed profile
Area: 0.018 square miles
Population: 33
Population density:
| Macdill Estates: | 1,871 people per square mile |
| Tampa: | 3,454 people per square mile |
Median household income in 2021:
| Macdill Estates: | $94,410 |
| Tampa: | $63,404 |
Median rent in in 2021:
| Macdill Estates: | $1,592 |
| Tampa: | $1,191 |
Male vs Females
| Males: | 20 |
| Females: | 13 |
Median age
| Males: | 35.4 years |
| Females: | 37.6 years |
Housing prices:
Average estimated value of detached houses in 2021 (84.6% of all units):
| Macdill Estates: | $292,976 |
| Tampa: | $477,728 |
Average estimated value of townhouses or other attached units in 2021 (7.7% of all units):
| This neighborhood: | $302,642 |
| city: | $499,254 |
Most popular occupations of males: sales and office occupations (48.5%); healthcare practitioners and technical occupations (12.2%); architecture and engineering occupations (10.2%); transportation occupations (9.6%); management occupations (except farmers) (5.9%); service occupations (5.9%); material moving occupations (2.5%)
Most popular occupations of females: business and financial operations occupations (31.8%); computer and mathematical occupations (23.5%); service occupations (23.5%); material moving occupations (9.5%); sales and office occupations (5.4%); management occupations (except farmers) (2.0%); legal occupations (1.1%)
Macdill Estates neighborhood detailed profile
Macdill Home neighborhood in Tampa statistics: (Find on map)
Area: 0.003 square miles
Population: 20
Population density:
Median household income in 2021:
Median rent in in 2021:
Male vs Females
Median age
Most popular occupations of males: sales and office occupations (28.5%); construction, extraction, and maintenance occupations (15.2%); service occupations (12.9%); computer and mathematical occupations (10.5%); business and financial operations occupations (9.8%); transportation occupations (9.1%); production occupations (4.2%)
Most popular occupations of females: service occupations (17.1%); business and financial operations occupations (16.0%); sales and office occupations (16.0%); healthcare practitioners and technical occupations (15.4%); management occupations (except farmers) (14.0%); legal occupations (4.7%); computer and mathematical occupations (4.1%)
Macdill Home neighborhood detailed profile
Area: 0.003 square miles
Population: 20
Population density:
| Macdill Home: | 6,959 people per square mile |
| Tampa: | 3,454 people per square mile |
Median household income in 2021:
| Macdill Home: | $67,744 |
| Tampa: | $63,404 |
Median rent in in 2021:
| Macdill Home: | $1,377 |
| Tampa: | $1,191 |
Male vs Females
| Males: | 11 |
| Females: | 8 |
Median age
| Males: | 30.8 years |
| Females: | 41.1 years |
Most popular occupations of males: sales and office occupations (28.5%); construction, extraction, and maintenance occupations (15.2%); service occupations (12.9%); computer and mathematical occupations (10.5%); business and financial operations occupations (9.8%); transportation occupations (9.1%); production occupations (4.2%)
Most popular occupations of females: service occupations (17.1%); business and financial operations occupations (16.0%); sales and office occupations (16.0%); healthcare practitioners and technical occupations (15.4%); management occupations (except farmers) (14.0%); legal occupations (4.7%); computer and mathematical occupations (4.1%)
Macdill Home neighborhood detailed profile
Madigan Park neighborhood in Tampa statistics: (Find on map)
Area: 0.004 square miles
Population: 21
Population density:
Median household income in 2021:
Median rent in in 2021:
Male vs Females
Median age
Most popular occupations of males: management occupations (except farmers) (21.5%); sales and office occupations (14.2%); business and financial operations occupations (13.0%); legal occupations (10.7%); service occupations (10.1%); healthcare practitioners and technical occupations (7.5%); computer and mathematical occupations (4.7%)
Most popular occupations of females: healthcare practitioners and technical occupations (23.6%); legal occupations (12.9%); sales and office occupations (12.9%); management occupations (except farmers) (12.1%); service occupations (11.7%); business and financial operations occupations (10.6%); education, training, and library occupations (8.0%)
Madigan Park neighborhood detailed profile
Area: 0.004 square miles
Population: 21
Population density:
| Madigan Park: | 5,827 people per square mile |
| Tampa: | 3,454 people per square mile |
Median household income in 2021:
| Madigan Park: | $116,212 |
| Tampa: | $63,404 |
Median rent in in 2021:
| Madigan Park: | $1,203 |
| Tampa: | $1,191 |
Male vs Females
| Males: | 9 |
| Females: | 11 |
Median age
| Males: | 37.6 years |
| Females: | 38.1 years |
Most popular occupations of males: management occupations (except farmers) (21.5%); sales and office occupations (14.2%); business and financial operations occupations (13.0%); legal occupations (10.7%); service occupations (10.1%); healthcare practitioners and technical occupations (7.5%); computer and mathematical occupations (4.7%)
Most popular occupations of females: healthcare practitioners and technical occupations (23.6%); legal occupations (12.9%); sales and office occupations (12.9%); management occupations (except farmers) (12.1%); service occupations (11.7%); business and financial operations occupations (10.6%); education, training, and library occupations (8.0%)
Madigan Park neighborhood detailed profile
Madison Business Park neighborhood in Tampa statistics: (Find on map)
Area: 0.358 square miles
Population: 179
Population density:
Median household income in 2021:
Median rent in in 2021:
Male vs Females
Median age
Most popular occupations of males: service occupations (19.9%); construction, extraction, and maintenance occupations (16.6%); sales and office occupations (15.2%); management occupations (except farmers) (11.5%); production occupations (10.1%); transportation occupations (7.4%); education, training, and library occupations (4.9%)
Most popular occupations of females: sales and office occupations (43.9%); service occupations (11.9%); material moving occupations (8.5%); management occupations (except farmers) (8.2%); transportation occupations (7.1%); education, training, and library occupations (6.1%); healthcare practitioners and technical occupations (5.1%)
Madison Business Park neighborhood detailed profile
Area: 0.358 square miles
Population: 179
Population density:
| Madison Business Park: | 500 people per square mile |
| Tampa: | 3,454 people per square mile |
Median household income in 2021:
| Madison Business Park: | $44,153 |
| Tampa: | $63,404 |
Median rent in in 2021:
| Madison Business Park: | $846 |
| Tampa: | $1,191 |
Male vs Females
| Males: | 88 |
| Females: | 90 |
Median age
| Males: | 38.2 years |
| Females: | 31.5 years |
Most popular occupations of males: service occupations (19.9%); construction, extraction, and maintenance occupations (16.6%); sales and office occupations (15.2%); management occupations (except farmers) (11.5%); production occupations (10.1%); transportation occupations (7.4%); education, training, and library occupations (4.9%)
Most popular occupations of females: sales and office occupations (43.9%); service occupations (11.9%); material moving occupations (8.5%); management occupations (except farmers) (8.2%); transportation occupations (7.1%); education, training, and library occupations (6.1%); healthcare practitioners and technical occupations (5.1%)
Madison Business Park neighborhood detailed profile
Madison Industrial Park neighborhood in Tampa statistics: (Find on map)
Area: 0.373 square miles
Population: 187
Population density:
Median household income in 2021:
Median rent in in 2021:
Male vs Females
Median age
Most popular occupations of males: service occupations (19.9%); construction, extraction, and maintenance occupations (16.6%); sales and office occupations (15.2%); management occupations (except farmers) (11.5%); production occupations (10.1%); transportation occupations (7.4%); education, training, and library occupations (4.9%)
Most popular occupations of females: sales and office occupations (43.9%); service occupations (11.9%); material moving occupations (8.5%); management occupations (except farmers) (8.2%); transportation occupations (7.1%); education, training, and library occupations (6.1%); healthcare practitioners and technical occupations (5.1%)
Madison Industrial Park neighborhood detailed profile
Area: 0.373 square miles
Population: 187
Population density:
| Madison Industrial Park: | 502 people per square mile |
| Tampa: | 3,454 people per square mile |
Median household income in 2021:
| Madison Industrial Park: | $44,153 |
| Tampa: | $63,404 |
Median rent in in 2021:
| Madison Industrial Park: | $846 |
| Tampa: | $1,191 |
Male vs Females
| Males: | 92 |
| Females: | 94 |
Median age
| Males: | 38.2 years |
| Females: | 31.5 years |
Most popular occupations of males: service occupations (19.9%); construction, extraction, and maintenance occupations (16.6%); sales and office occupations (15.2%); management occupations (except farmers) (11.5%); production occupations (10.1%); transportation occupations (7.4%); education, training, and library occupations (4.9%)
Most popular occupations of females: sales and office occupations (43.9%); service occupations (11.9%); material moving occupations (8.5%); management occupations (except farmers) (8.2%); transportation occupations (7.1%); education, training, and library occupations (6.1%); healthcare practitioners and technical occupations (5.1%)
Madison Industrial Park neighborhood detailed profile
Madrona Heights neighborhood in Tampa statistics: (Find on map)
Area: 0.009 square miles
Median household income in 2021:
Median rent in in 2021:
Most popular occupations of males: construction, extraction, and maintenance occupations (27.3%); service occupations (25.0%); production occupations (19.4%); sales and office occupations (6.3%); material moving occupations (6.3%); business and financial operations occupations (4.3%); management occupations (except farmers) (3.9%)
Most popular occupations of females: service occupations (60.7%); sales and office occupations (34.1%); legal occupations (5.2%)
Madrona Heights neighborhood detailed profile
Area: 0.009 square miles
Median household income in 2021:
| Madrona Heights: | $38,784 |
| Tampa: | $63,404 |
Median rent in in 2021:
| Madrona Heights: | $788 |
| Tampa: | $1,191 |
Most popular occupations of males: construction, extraction, and maintenance occupations (27.3%); service occupations (25.0%); production occupations (19.4%); sales and office occupations (6.3%); material moving occupations (6.3%); business and financial operations occupations (4.3%); management occupations (except farmers) (3.9%)
Most popular occupations of females: service occupations (60.7%); sales and office occupations (34.1%); legal occupations (5.2%)
Madrona Heights neighborhood detailed profile
Madsen Court neighborhood in Tampa statistics: (Find on map)
Area: 0.007 square miles
Population: 35
Population density:
Median household income in 2021:
Median rent in in 2021:
Male vs Females
Median age
Most popular occupations of males: management occupations (except farmers) (51.1%); computer and mathematical occupations (13.3%); service occupations (11.1%); arts, design, entertainment, sports, and media occupations (5.7%); business and financial operations occupations (5.2%); sales and office occupations (4.4%); production occupations (4.3%)
Most popular occupations of females: sales and office occupations (34.6%); management occupations (except farmers) (26.3%); service occupations (25.6%); healthcare practitioners and technical occupations (15.5%); legal occupations (12.3%); business and financial operations occupations (11.9%); life, physical, and social science occupations (9.0%)
Madsen Court neighborhood detailed profile
Area: 0.007 square miles
Population: 35
Population density:
| Madsen Court: | 5,372 people per square mile |
| Tampa: | 3,454 people per square mile |
Median household income in 2021:
| Madsen Court: | $31,728 |
| Tampa: | $63,404 |
Median rent in in 2021:
| Madsen Court: | $1,318 |
| Tampa: | $1,191 |
Male vs Females
| Males: | 19 |
| Females: | 15 |
Median age
| Males: | 41.6 years |
| Females: | 26.8 years |
Most popular occupations of males: management occupations (except farmers) (51.1%); computer and mathematical occupations (13.3%); service occupations (11.1%); arts, design, entertainment, sports, and media occupations (5.7%); business and financial operations occupations (5.2%); sales and office occupations (4.4%); production occupations (4.3%)
Most popular occupations of females: sales and office occupations (34.6%); management occupations (except farmers) (26.3%); service occupations (25.6%); healthcare practitioners and technical occupations (15.5%); legal occupations (12.3%); business and financial operations occupations (11.9%); life, physical, and social science occupations (9.0%)
Madsen Court neighborhood detailed profile