Bainbridge Street neighborhood in Philadelphia, Pennsylvania (PA), 19147 detailed profile
Settings
X

Business Search - 14 Million verified businesses
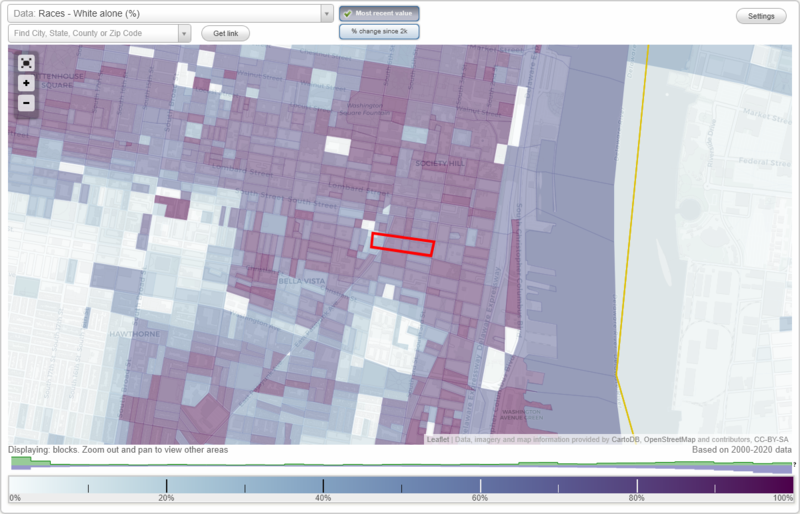
Area: 0.010 square miles
Population: 327
Population density:
| Bainbridge Street: | 32,737 people per square mile |
| Philadelphia: | 11,602 people per square mile |

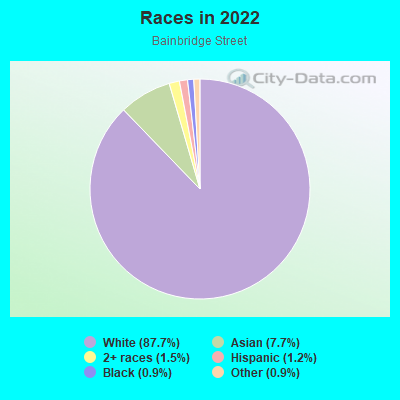
- 28587.7%White
- 257.7%Asian
- 51.5%Two or more races
- 41.2%Hispanic or Latino
- 30.9%Black
- 30.9%Some other race
Median household income in 2022:
| Bainbridge Street: | $203,333 |
| Philadelphia: | $56,517 |
Distribution of median household income
![Distribution of median household income]()
- 4Less than $10,000
- 5$10,000 to $19,999
- 7$20,000 to $29,999
- 7$30,000 to $39,999
- 3$40,000 to $49,999
- 12$50,000 to $59,999
- 6$60,000 to $74,999
- 29$75,000 to $99,999
- 7$100,000 to $124,999
- 11$125,000 to $149,999
- 9$150,000 to $199,999
- 77$200,000 or more

Distribution of owner-occupied house/condo value
![Distribution of owner-occupied house/condo value]()
- 1Less than $50,000
- 1$150,000 to $199,999
- 4$200,000 to $249,999
- 3$250,000 to $299,999
- 8$300,000 to $399,999
- 12$400,000 to $499,999
- 18$500,000 to $749,999
- 36$750,000 to $999,999
- 20$1,000,000 or more

Distribution of rent paid by renters
![Distribution of rent paid by renters]()
- 3$600 to $699
- 3$800 to $899
- 4$900 to $999
- 9$1,000 to $1,249
- 5$1,250 to $1,499
- 25$1,500 to $1,999
- 25$2,000 or more

Median rent in 2022:
| Bainbridge Street: | $1,920 |
| Philadelphia: | $1,073 |
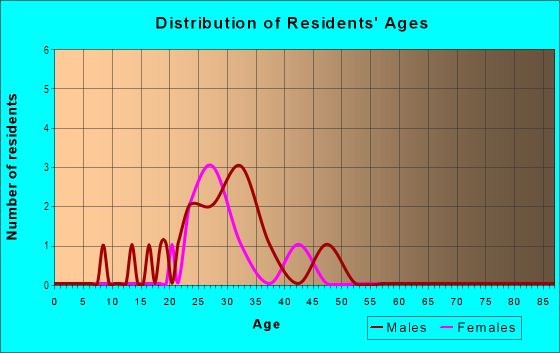
| Males: | 151 |
| Females: | 176 |
Males:
| This neighborhood: | 36.3 years |
| Whole city: | 34.1 years |
| This neighborhood: | 33.6 years |
| Whole city: | 36.3 years |
Average household size:
| Bainbridge Street: | 2.2 people |
| Philadelphia: | 2.2 people |
Percentage of family households:
| Bainbridge Street: | 37.5% |
| Philadelphia: | 36.5% |
| Here: | 37.5% |
| Philadelphia: | 28.0% |
Percentage of married-couple families with children (among all households):
| Bainbridge Street: | 29.1% |
| Philadelphia: | 23.5% |
Percentage of single-mother households (among all households):
| Bainbridge Street: | 7.5% |
| Philadelphia: | 17.6% |
Percentage of never married males 15 years old and over:
Percentage of never married females 15 years old and over:
| Bainbridge Street: | 19.7% |
| Philadelphia: | 23.9% |
Percentage of never married females 15 years old and over:
| Bainbridge Street: | 21.5% |
| city: | 26.0% |
Percentage of people that speak English not well or not at all:
| Bainbridge Street: | 0.0% |
| Philadelphia: | 7.0% |
Percentage of people born in this state:
Percentage of people born in another U.S. state:
Percentage of native residents but born outside the U.S.:
Percentage of foreign born residents:
| Here: | 46.8% |
| Philadelphia: | 61.6% |
Percentage of people born in another U.S. state:
| Bainbridge Street: | 49.7% |
| Philadelphia: | 18.9% |
Percentage of native residents but born outside the U.S.:
| Here: | 0.7% |
| city: | 3.7% |
Percentage of foreign born residents:
| Here: | 2.9% |
| Philadelphia: | 15.7% |
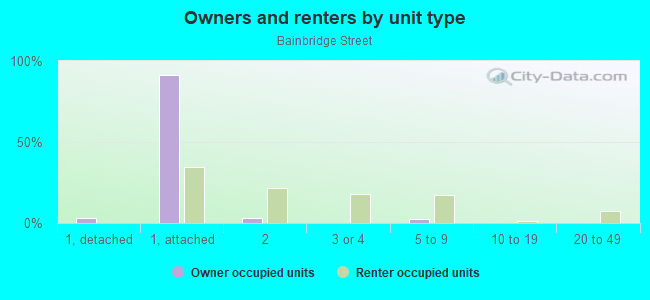
Owner-occupied
Renter-occupied

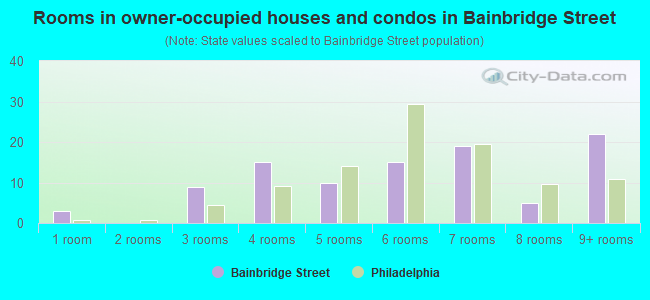
- Rooms in owner-occupied houses and condos in Bainbridge Street
- 31 room
- 02 rooms
- 93 rooms
- 154 rooms
- 105 rooms
- 156 rooms
- 197 rooms
- 58 rooms
- 229+ rooms
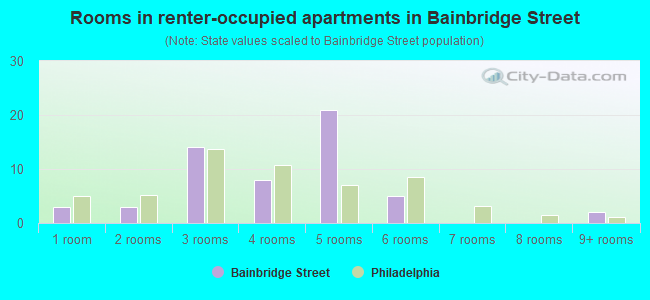
- Rooms in renter-occupied apartments in Bainbridge Street
- 31 room
- 32 rooms
- 143 rooms
- 84 rooms
- 215 rooms
- 56 rooms
- 07 rooms
- 08 rooms
- 29+ rooms
Owner-occupied
Renter-occupied
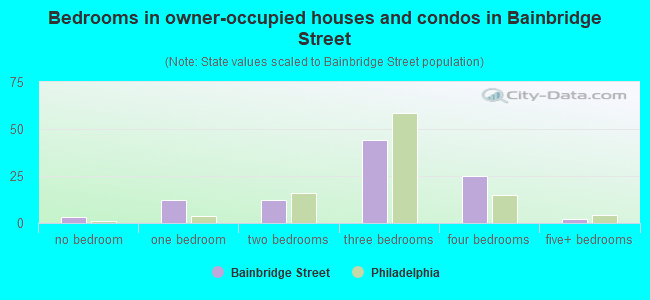
- Bedrooms in owner-occupied houses and condos in Bainbridge Street
- 3no bedroom
- 121 bedroom
- 122 bedrooms
- 443 bedrooms
- 254 bedrooms
- 25+ bedrooms
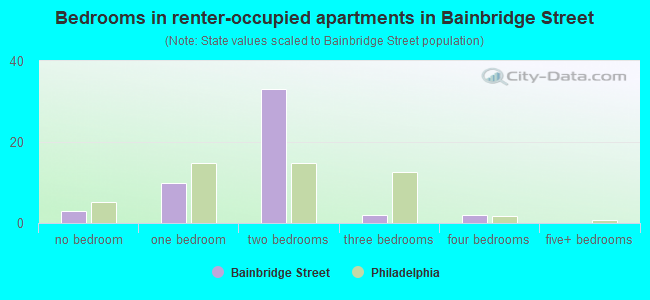
- Bedrooms in renter-occupied apartments in Bainbridge Street
- 3no bedroom
- 101 bedroom
- 332 bedrooms
- 23 bedrooms
- 24 bedrooms
- 05+ bedrooms
Average number of cars or other vehicles available in houses/condos:
Average number of cars or other vehicles available in apartments:
| This neighborhood: | 1.0 |
| Philadelphia: | 1.3 |
Average number of cars or other vehicles available in apartments:
| Here: | 0.9 |
| city: | 0.8 |
Percentage of units with a mortgage:
| Bainbridge Street: | 62.6% |
| Philadelphia: | 58.9% |
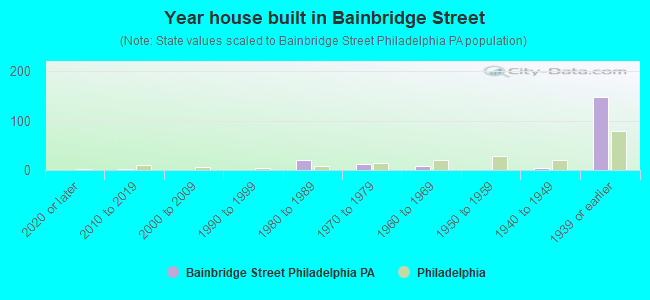
- Year house built in Bainbridge Street
- 02020 or later
- 22010 to 2019
- 12000 to 2009
- 01990 to 1999
- 211980 to 1989
- 131970 to 1979
- 81960 to 1969
- 11950 to 1959
- 41940 to 1949
- 1471939 or earlier
City-data.com crime index for city in 2020 (higher means more crime):
| City: | 169.8 |
| U.S. average: | 219.5 |
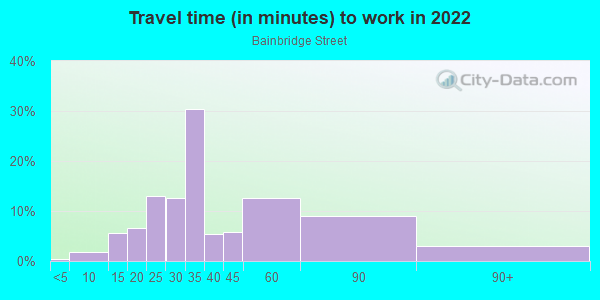
Travel time to work (commute)
![Travel time to work (commute)]()
- 25 to 9 minutes
- 610 to 14 minutes
- 815 to 19 minutes
- 1620 to 24 minutes
- 1525 to 29 minutes
- 3730 to 34 minutes
- 635 to 39 minutes
- 740 to 44 minutes
- 1545 to 59 minutes
- 1160 to 89 minutes
- 390 or more minutes
Means of transportation to work
![Means of transportation to work]()
- 35.1%69Drove a car alone
- 5.1%10Carpooled
- 11.2%22Bus
- 2.0%4Subway or elevated rail
- 1.0%2Long-distance train or commuter rail
- 3.1%6Bicycle
- 12.7%25Walked
- 3.1%6Other means
- 24.4%48Worked at home

Time leaving home to go to work
![Time leaving home to go to work]()
- 46:00 a.m. to 6:29 a.m.
- 46:30 a.m. to 6:59 a.m.
- 197:00 a.m. to 7:29 a.m.
- 147:30 a.m. to 7:59 a.m.
- 318:00 a.m. to 8:29 a.m.
- 268:30 a.m. to 8:59 a.m.
- 79:00 a.m. to 9:59 a.m.
- 310:00 a.m. to 10:59 a.m.
- 712:00 p.m. to 3:59 p.m.
- 54:00 p.m. to 11:59 p.m.

Occupations of males:
- Percentage of males in management occupations (except farmers):
Here: 12.7% city: 9.1%
- Percentage of males in business and financial operations occupations:
Here: 14.5% city: 6.0%
- Percentage of males in computer and mathematical occupations:
Here: 5.2% city: 4.6%
- Percentage of males in architecture and engineering occupations:
Here: 6.5% city: 2.4%
- Percentage of males in life, physical, and social science occupations:
Here: 3.2% city: 1.7%
- Percentage of males in legal occupations:
Here: 2.5% city: 1.8%
- Percentage of males in education, training, and library occupations:
Here: 6.8% city: 4.0%
- Percentage of males in arts, design, entertainment, sports, and media occupations:
Here: 10.2% city: 2.5%
- Percentage of males in healthcare practitioners and technical occupations:
Here: 9.3% city: 4.3%
- Percentage of males in service occupations:
Here: 11.4% city: 19.3%
- Percentage of males in sales and office occupations:
Here: 12.0% city: 14.1%
- Percentage of males in construction, extraction, and maintenance occupations:
Here: 6.5% city: 6.4%
- Percentage of males in production occupations:
Here: 2.5% city: 5.0%
Occupations of females:
- Percentage of females in management occupations (except farmers):
Here: 17.8% city: 9.1%
- Percentage of females in business and financial operations occupations:
Here: 10.6% city: 6.6%
- Percentage of females in architecture and engineering occupations:
Here: 3.7% city: 0.7%
- Percentage of females in life, physical, and social science occupations:
Here: 2.0% city: 1.6%
- Percentage of females in community and social services occupations:
Here: 5.1% city: 3.6%
- Percentage of females in legal occupations:
Here: 8.2% city: 1.9%
- Percentage of females in education, training, and library occupations:
Here: 7.3% city: 8.5%
- Percentage of females in arts, design, entertainment, sports, and media occupations:
Here: 19.9% city: 2.4%
- Percentage of females in healthcare practitioners and technical occupations:
Here: 17.8% city: 10.3%
- Percentage of females in service occupations:
Here: 4.8% city: 24.4%
- Percentage of females in sales and office occupations:
Here: 13.3% city: 23.4%
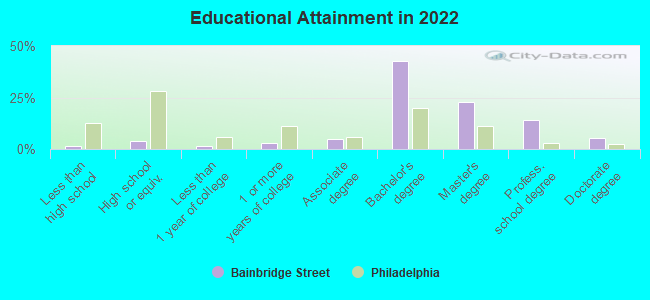
Education in this neighborhood (subdivision or community):
- Percentage of people 3 years and older in K-12 schools:
Bainbridge Street: 21.2% Philadelphia: 15.6%
- Percentage of people 3 years and older in undergraduate colleges:
Bainbridge Street: 0.9% Philadelphia: 6.0%
- Percentage of people 3 years and older in grad. or professional schools:
Bainbridge Street: 2.2% Philadelphia: 2.8%
- Percentage of students K-12 enrolled in private schools:
Bainbridge Street: 42.0% Philadelphia: 25.0%
Percentage of population below poverty level:
| Bainbridge Street: | 6.1% |
| Philadelphia: | 21.7% |
Median year owner moved in (as recorded in 2022):
Median year renter moved in (as recorded in 2022):
| Bainbridge Street: | 2007 |
| Philadelphia: | 2007 |
Median year renter moved in (as recorded in 2022):
| Bainbridge Street: | 2019 |
| Philadelphia: | 2019 |
Percentage of married-couple families with both working:
| Bainbridge Street: | 77.2% |
| Philadelphia: | 71.4% |
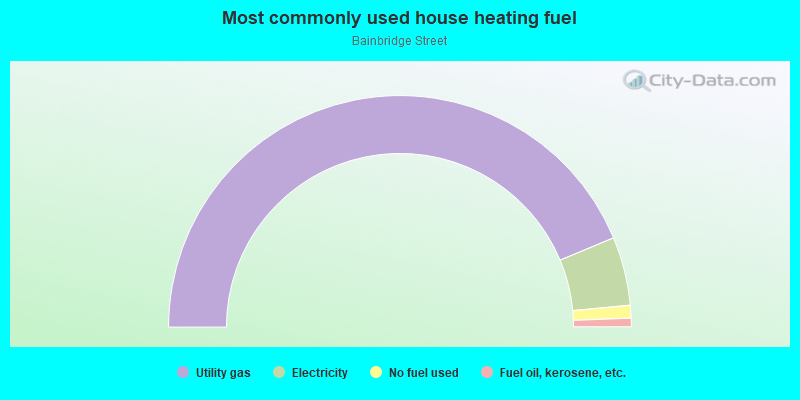
- 87.5%Utility gas
- 9.6%Electricity
- 1.8%No fuel used
- 1.2%Fuel oil, kerosene, etc.
Roads and streets:
Bainbridge St
Length: 0.21 miles
Direction: E-W
Address range: 400 to 408
Direction: E-W
Address range: 400 to 408
Monroe St
Length: 0.08 miles
Directions: E-W, SE-NW
Address range: 410 to 499
Directions: E-W, SE-NW
Address range: 410 to 499
S Leithgow St
Length: 0.04 miles
Direction: N-S
Address range: 711 to 799
Direction: N-S
Address range: 711 to 799
E Passyunk Ave
Length: 0.04 miles
Direction: SW-NE
Address range: 705 to 711
Direction: SW-NE
Address range: 705 to 711
Bergan Ct
Length: 0.03 miles
Direction: N-S
Address range: 31 to 99
Direction: N-S
Address range: 31 to 99
S Reese St
Length: 0.02 miles
Direction: N-S
Address range: 723 to 743
Direction: N-S
Address range: 723 to 743