Berkley Square neighborhood in Las Vegas, Nevada (NV), 89106 detailed profile
Settings
X

Business Search - 14 Million verified businesses
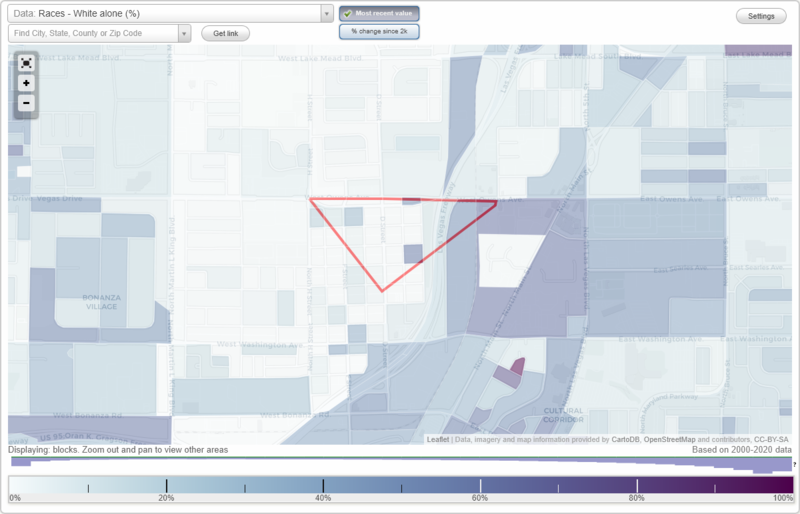
Area: 0.128 square miles
Population: 805
Population density:
| Berkley Square: | 6,268 people per square mile |
| Las Vegas: | 5,792 people per square mile |

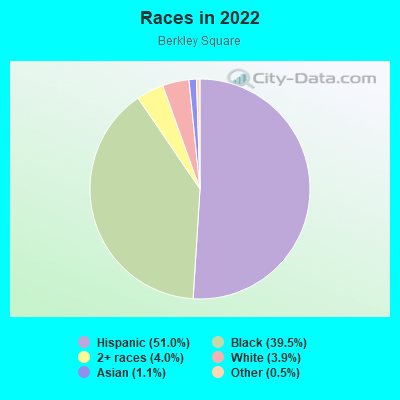
- 40951.0%Hispanic or Latino
- 31739.5%Black
- 324.0%Two or more races
- 313.9%White
- 91.1%Asian
- 40.5%Some other race
Distribution of median household income
![Distribution of median household income]()
- 47Less than $10,000
- 31$10,000 to $19,999
- 41$20,000 to $29,999
- 21$30,000 to $39,999
- 40$40,000 to $49,999
- 49$50,000 to $59,999
- 11$60,000 to $74,999
- 38$75,000 to $99,999
- 4$100,000 to $124,999
- 11$125,000 to $149,999
- 6$150,000 to $199,999

Distribution of owner-occupied house/condo value
![Distribution of owner-occupied house/condo value]()
- 14Less than $50,000
- 37$50,000 to $99,999
- 12$100,000 to $149,999
- 20$150,000 to $199,999
- 35$200,000 to $249,999
- 35$250,000 to $299,999
- 9$300,000 to $399,999
- 3$400,000 to $499,999

Distribution of rent paid by renters
![Distribution of rent paid by renters]()
- 100$100 to $199
- 24$200 to $299
- 14$300 to $399
- 15$400 to $499
- 15$500 to $599
- 15$600 to $699
- 23$700 to $799
- 20$800 to $899
- 54$900 to $999
- 21$1,000 to $1,249
- 7$1,250 to $1,499

Median rent in 2022:
| Berkley Square: | $911 |
| Las Vegas: | $1,277 |
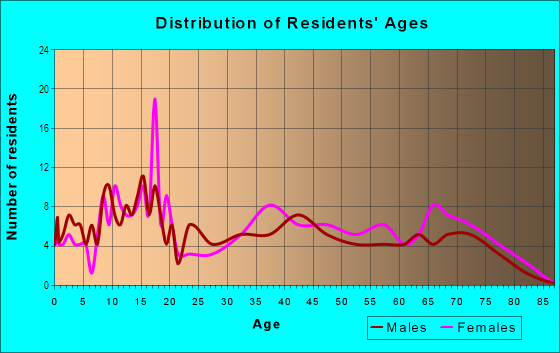
| Males: | 413 |
| Females: | 392 |
Males:
| This neighborhood: | 29.8 years |
| Whole city: | 38.4 years |
| This neighborhood: | 31.6 years |
| Whole city: | 38.9 years |
Average household size:
| Berkley Square: | 2.6 people |
| Las Vegas: | 2.7 people |
Percentage of family households:
| Berkley Square: | 54.5% |
| Las Vegas: | 45.8% |
| Here: | 21.5% |
| Las Vegas: | 40.9% |
Percentage of married-couple families with children (among all households):
| Berkley Square: | 11.8% |
| Las Vegas: | 23.4% |
Percentage of single-mother households (among all households):
| Berkley Square: | 19.3% |
| Las Vegas: | 10.1% |
Percentage of never married males 15 years old and over:
Percentage of never married females 15 years old and over:
| Berkley Square: | 22.5% |
| Las Vegas: | 19.7% |
Percentage of never married females 15 years old and over:
| Berkley Square: | 27.6% |
| city: | 17.0% |
Percentage of people that speak English not well or not at all:
| Berkley Square: | 13.4% |
| Las Vegas: | 7.0% |
Percentage of people born in this state:
Percentage of people born in another U.S. state:
Percentage of native residents but born outside the U.S.:
Percentage of foreign born residents:
| Here: | 43.0% |
| Las Vegas: | 27.3% |
Percentage of people born in another U.S. state:
| Berkley Square: | 35.3% |
| Las Vegas: | 49.8% |
Percentage of native residents but born outside the U.S.:
| Here: | 0.4% |
| city: | 1.9% |
Percentage of foreign born residents:
| Here: | 21.3% |
| Las Vegas: | 21.0% |
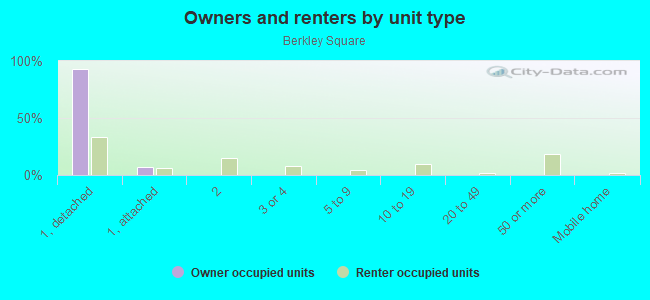
Owner-occupied
Renter-occupied

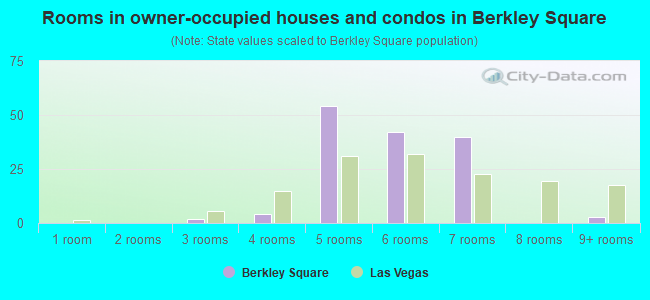
- Rooms in owner-occupied houses and condos in Berkley Square
- 01 room
- 02 rooms
- 23 rooms
- 44 rooms
- 545 rooms
- 426 rooms
- 407 rooms
- 08 rooms
- 39+ rooms
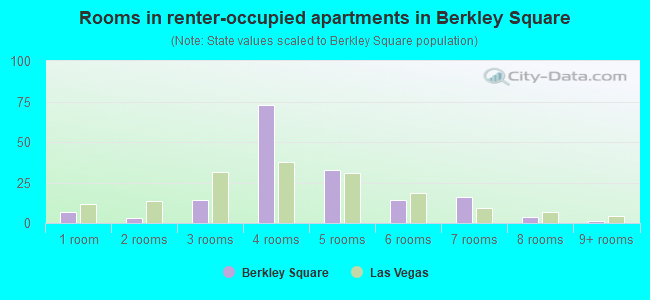
- Rooms in renter-occupied apartments in Berkley Square
- 71 room
- 32 rooms
- 143 rooms
- 734 rooms
- 335 rooms
- 146 rooms
- 167 rooms
- 48 rooms
- 19+ rooms
Owner-occupied
Renter-occupied
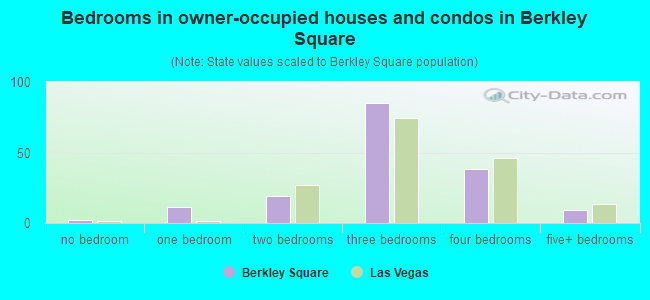
- Bedrooms in owner-occupied houses and condos in Berkley Square
- 2no bedroom
- 111 bedroom
- 192 bedrooms
- 853 bedrooms
- 384 bedrooms
- 95+ bedrooms
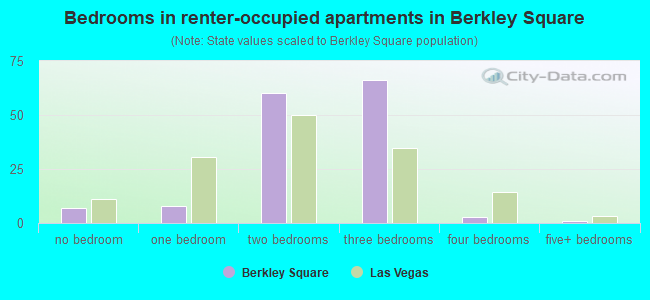
- Bedrooms in renter-occupied apartments in Berkley Square
- 7no bedroom
- 81 bedroom
- 602 bedrooms
- 663 bedrooms
- 34 bedrooms
- 15+ bedrooms
Average number of cars or other vehicles available in houses/condos:
Average number of cars or other vehicles available in apartments:
| This neighborhood: | 1.5 |
| Las Vegas: | 2.0 |
Average number of cars or other vehicles available in apartments:
| Here: | 1.2 |
| city: | 1.3 |
Percentage of units with a mortgage:
| Berkley Square: | 52.0% |
| Las Vegas: | 69.3% |
Average estimated value of detached houses in 2022 (74.4% of all units):
| Berkley Square: | $190,461 |
| Nevada: | $549,327 |
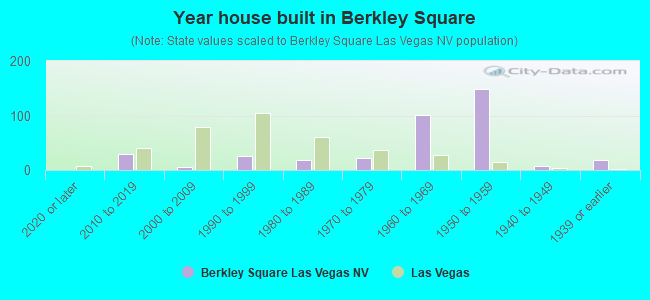
- Year house built in Berkley Square
- 02020 or later
- 292010 to 2019
- 62000 to 2009
- 261990 to 1999
- 181980 to 1989
- 221970 to 1979
- 1011960 to 1969
- 1491950 to 1959
- 71940 to 1949
- 181939 or earlier
City-data.com crime index for city in 2020 (higher means more crime):
| City: | 280.7 |
| U.S. average: | 219.5 |
Travel time to work (commute)
![Travel time to work (commute)]()
- 3Less than 5 minutes
- 475 to 9 minutes
- 3510 to 14 minutes
- 3115 to 19 minutes
- 8020 to 24 minutes
- 825 to 29 minutes
- 4830 to 34 minutes
- 2635 to 39 minutes
- 1145 to 59 minutes
- 2560 to 89 minutes
- 1690 or more minutes

Means of transportation to work
![Means of transportation to work]()
- 80.7%260Drove a car alone
- 7.1%23Carpooled
- 9.3%30Bus
- 1.2%4Ferryboat
- 7.8%25Walked
- 0.9%3Other means

Time leaving home to go to work
![Time leaving home to go to work]()
- 2712:00 a.m. to 4:59 a.m.
- 205:00 a.m. to 5:29 a.m.
- 215:30 a.m. to 5:59 a.m.
- 396:00 a.m. to 6:29 a.m.
- 456:30 a.m. to 6:59 a.m.
- 417:00 a.m. to 7:29 a.m.
- 147:30 a.m. to 7:59 a.m.
- 328:00 a.m. to 8:29 a.m.
- 108:30 a.m. to 8:59 a.m.
- 39:00 a.m. to 9:59 a.m.
- 410:00 a.m. to 10:59 a.m.
- 311:00 a.m. to 11:59 a.m.
- 1712:00 p.m. to 3:59 p.m.
- 534:00 p.m. to 11:59 p.m.

Occupations of males:
- Percentage of males in management occupations (except farmers):
Here: 3.4% city: 9.6%
- Percentage of males in computer and mathematical occupations:
Here: 2.8% city: 3.4%
- Percentage of males in community and social services occupations:
Here: 2.2% city: 0.7%
- Percentage of males in service occupations:
Here: 29.7% city: 23.3%
- Percentage of males in sales and office occupations:
Here: 22.3% city: 16.6%
- Percentage of males in construction, extraction, and maintenance occupations:
Here: 20.2% city: 10.6%
- Percentage of males in production occupations:
Here: 6.2% city: 3.3%
- Percentage of males in transportation occupations:
Here: 8.0% city: 6.6%
- Percentage of males in material moving occupations:
Here: 4.9% city: 5.4%
Occupations of females:
- Percentage of females in management occupations (except farmers):
Here: 6.3% city: 8.5%
- Percentage of females in business and financial operations occupations:
Here: 4.3% city: 5.7%
- Percentage of females in community and social services occupations:
Here: 12.6% city: 1.9%
- Percentage of females in education, training, and library occupations:
Here: 13.5% city: 8.0%
- Percentage of females in healthcare practitioners and technical occupations:
Here: 6.3% city: 7.4%
- Percentage of females in service occupations:
Here: 43.1% city: 26.5%
- Percentage of females in sales and office occupations:
Here: 5.5% city: 30.5%
- Percentage of females in production occupations:
Here: 5.7% city: 1.8%
- Percentage of females in transportation occupations:
Here: 6.9% city: 1.6%
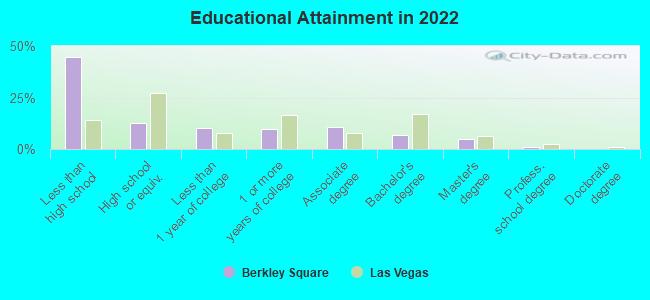
Education in this neighborhood (subdivision or community):
- Percentage of people 3 years and older in K-12 schools:
Berkley Square: 14.0% Las Vegas: 17.4%
- Percentage of people 3 years and older in undergraduate colleges:
Berkley Square: 4.1% Las Vegas: 4.2%
- Percentage of people 3 years and older in grad. or professional schools:
Berkley Square: 2.1% Las Vegas: 1.0%
- Percentage of students K-12 enrolled in private schools:
Berkley Square: 11.3% Las Vegas: 12.9%
Percentage of population below poverty level:
| Berkley Square: | 37.7% |
| Las Vegas: | 14.1% |
Median year renter moved in (as recorded in 2022):
| Berkley Square: | 2017 |
| Las Vegas: | 2020 |
Percentage of married-couple families with both working:
| Berkley Square: | 62.5% |
| Las Vegas: | 62.0% |
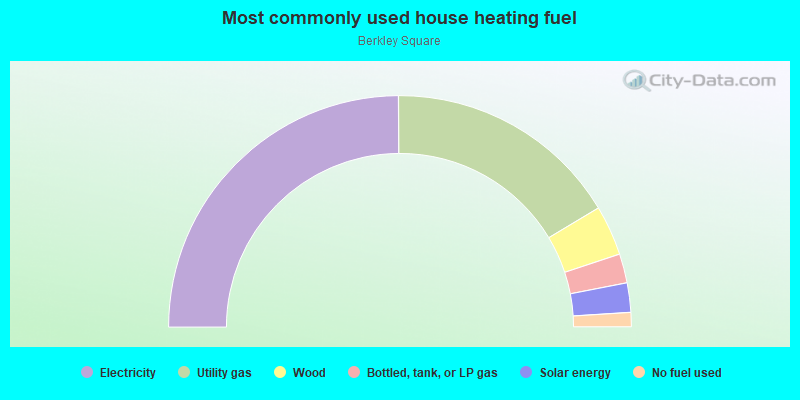
- 49.8%Electricity
- 33.0%Utility gas
- 7.0%Wood
- 4.1%Bottled, tank, or LP gas
- 4.1%Solar energy
- 2.0%No fuel used
Roads and streets:
D St
Length: 0.46 miles
Direction: N-S
Address range: 1600 to 1965
Direction: N-S
Address range: 1600 to 1965
Freeman Ave
Length: 0.25 miles
Direction: E-W
Address range: 400 to 699
Direction: E-W
Address range: 400 to 699
Leonard Ave
Length: 0.25 miles
Direction: E-W
Address range: 400 to 699
Direction: E-W
Address range: 400 to 699
Alexander Ave
Length: 0.24 miles
Direction: E-W
Address range: 400 to 699
Direction: E-W
Address range: 400 to 699
Kasper Ave
Length: 0.24 miles
Direction: E-W
Address range: 400 to 799
Direction: E-W
Address range: 400 to 799
Frederick Ave
Length: 0.24 miles
Direction: E-W
Address range: 400 to 699
Direction: E-W
Address range: 400 to 699
Wyatt Ave
Length: 0.19 miles
Direction: E-W
Address range: 400 to 699
Direction: E-W
Address range: 400 to 699
Walker St
Length: 0.19 miles
Directions: N-S, SE-NW, SW-NE
Address range: 1900 to 1999
Directions: N-S, SE-NW, SW-NE
Address range: 1900 to 1999
Bowman Ave
Length: 0.18 miles
Direction: E-W
Address range: 500 to 699
Direction: E-W
Address range: 500 to 699
Holland Ave
Length: 0.18 miles
Direction: E-W
Address range: 400 to 699
Direction: E-W
Address range: 400 to 699
Byrnes Ave
Length: 0.16 miles
Direction: E-W
Address range: 500 to 699
Direction: E-W
Address range: 500 to 699
W Owens Ave
Length: 0.16 miles
Direction: E-W
Address range: 500 to 698
Direction: E-W
Address range: 500 to 698
N G St
Length: 0.16 miles
Directions: N-S, SE-NW
Address range: 1600 to 1699
Directions: N-S, SE-NW
Address range: 1600 to 1699
E St
Length: 0.12 miles
Directions: E-W, N-S, SE-NW
Address range: 1600 to 1999
Directions: E-W, N-S, SE-NW
Address range: 1600 to 1999
Holmes St
Length: 0.09 miles
Direction: N-S
Address range: 1800 to 1999
Direction: N-S
Address range: 1800 to 1999
N F St (F St)
Length: 0.06 miles
Direction: N-S
Address range: 1600 to 1699
Direction: N-S
Address range: 1600 to 1699
Debra St
Length: 0.05 miles
Directions: N-S, SE-NW
Address range: 1900 to 1999
Directions: N-S, SE-NW
Address range: 1900 to 1999