Brighton East Farms neighborhood in Brighton, Colorado (CO), 80601 detailed profile
Settings
X

Business Search - 14 Million verified businesses
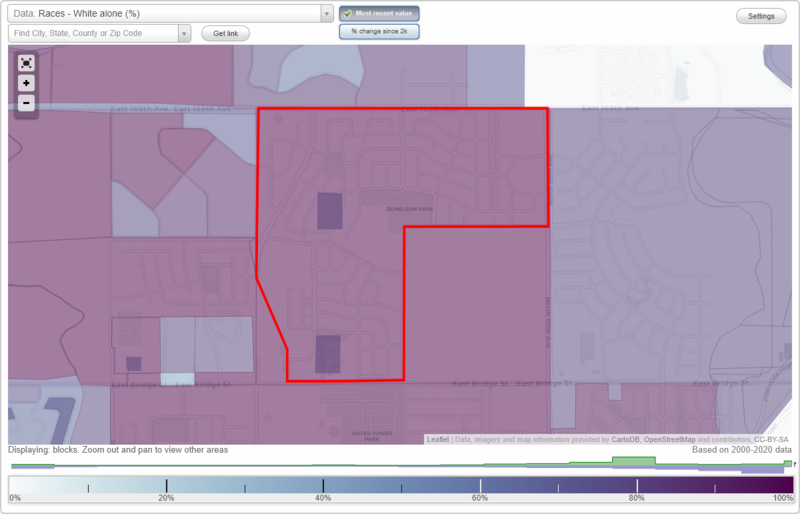
Area: 0.639 square miles
Population: 2,724
Population density:
| Brighton East Farms: | 4,261 people per square mile |
| Brighton: | 2,376 people per square mile |

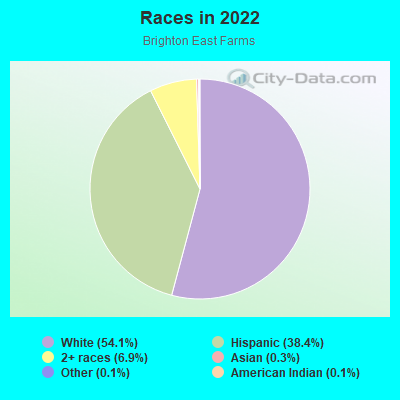
- 1,47654.1%White
- 1,04838.4%Hispanic or Latino
- 1896.9%Two or more races
- 90.3%Asian
- 30.1%American Indian
- 40.1%Some other race
Median household income in 2022:
| Brighton East Farms: | $59,864 |
| Brighton: | $86,975 |
Distribution of median household income
![Distribution of median household income]()
- 128Less than $10,000
- 28$10,000 to $19,999
- 97$20,000 to $29,999
- 82$30,000 to $39,999
- 61$40,000 to $49,999
- 277$50,000 to $59,999
- 56$60,000 to $74,999
- 232$75,000 to $99,999
- 95$100,000 to $124,999
- 79$125,000 to $149,999
- 22$150,000 to $199,999
- 33$200,000 or more

Distribution of owner-occupied house/condo value
![Distribution of owner-occupied house/condo value]()
- 58Less than $50,000
- 9$150,000 to $199,999
- 10$200,000 to $249,999
- 427$250,000 to $299,999
- 177$300,000 to $399,999
- 81$400,000 to $499,999
- 14$500,000 to $749,999
- 9$750,000 to $999,999

Distribution of rent paid by renters
![Distribution of rent paid by renters]()
- 20$100 to $199
- 33$500 to $599
- 20$800 to $899
- 14$900 to $999
- 146$1,000 to $1,249
- 136$1,250 to $1,499
- 46$1,500 to $1,999
- 5$2,000 or more

Median rent in 2022:
| Brighton East Farms: | $1,218 |
| Brighton: | $1,426 |
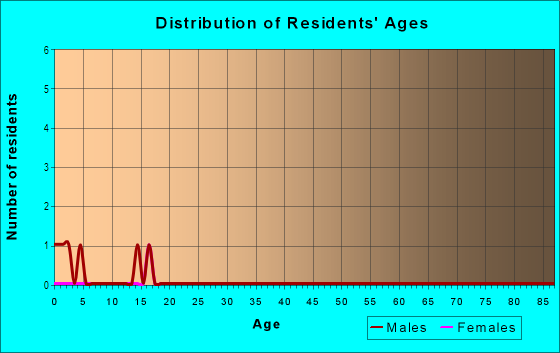
| Males: | 1,311 |
| Females: | 1,413 |
Males:
| This neighborhood: | 28.3 years |
| Whole city: | 32.7 years |
| This neighborhood: | 49.5 years |
| Whole city: | 36.0 years |
Average household size:
| Brighton East Farms: | 2.3 people |
| Brighton: | 3.0 people |
Percentage of family households:
| Brighton East Farms: | 46.7% |
| Brighton: | 60.3% |
| Here: | 37.6% |
| Brighton: | 56.9% |
Percentage of married-couple families with children (among all households):
| Brighton East Farms: | 38.8% |
| Brighton: | 24.2% |
Percentage of single-mother households (among all households):
| Brighton East Farms: | 4.2% |
| Brighton: | 7.3% |
Percentage of never married males 15 years old and over:
Percentage of never married females 15 years old and over:
| Brighton East Farms: | 16.5% |
| Brighton: | 17.0% |
Percentage of never married females 15 years old and over:
| Brighton East Farms: | 10.9% |
| city: | 11.6% |
Percentage of people born in this state:
Percentage of people born in another U.S. state:
Percentage of native residents but born outside the U.S.:
Percentage of foreign born residents:
| Here: | 55.5% |
| Brighton: | 56.5% |
Percentage of people born in another U.S. state:
| Brighton East Farms: | 39.8% |
| Brighton: | 33.5% |
Percentage of native residents but born outside the U.S.:
| Here: | 0.8% |
| city: | 1.8% |
Percentage of foreign born residents:
| Here: | 3.9% |
| Brighton: | 8.3% |
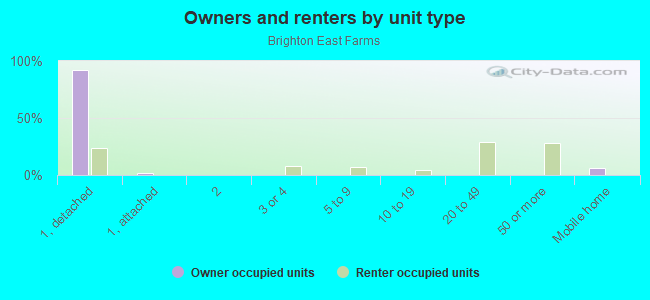
Owner-occupied
Renter-occupied

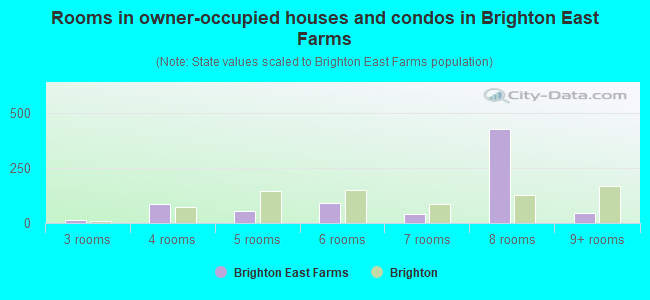
- Rooms in owner-occupied houses and condos in Brighton East Farms
- 01 room
- 02 rooms
- 143 rooms
- 864 rooms
- 555 rooms
- 896 rooms
- 407 rooms
- 4288 rooms
- 459+ rooms
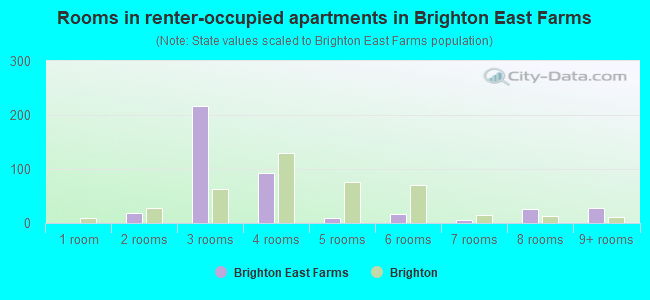
- Rooms in renter-occupied apartments in Brighton East Farms
- 01 room
- 192 rooms
- 2173 rooms
- 934 rooms
- 95 rooms
- 176 rooms
- 57 rooms
- 268 rooms
- 279+ rooms
Owner-occupied
Renter-occupied
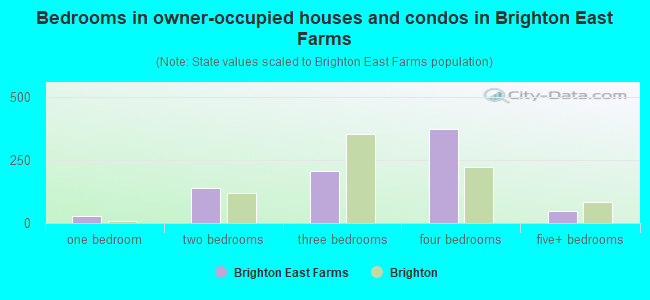
- Bedrooms in owner-occupied houses and condos in Brighton East Farms
- 0no bedroom
- 271 bedroom
- 1372 bedrooms
- 2043 bedrooms
- 3724 bedrooms
- 475+ bedrooms
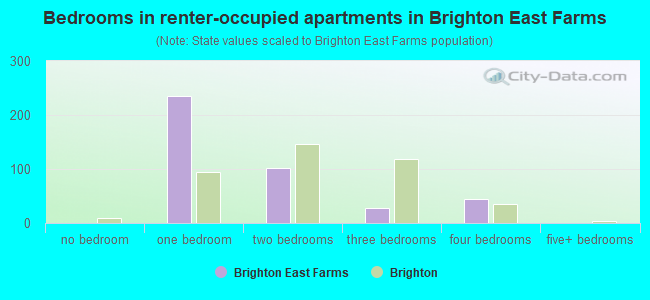
- Bedrooms in renter-occupied apartments in Brighton East Farms
- 0no bedroom
- 2361 bedroom
- 1022 bedrooms
- 273 bedrooms
- 444 bedrooms
- 05+ bedrooms
Average number of cars or other vehicles available in houses/condos:
Average number of cars or other vehicles available in apartments:
| This neighborhood: | 2.1 |
| Brighton: | 2.5 |
Average number of cars or other vehicles available in apartments:
| Here: | 1.8 |
| city: | 1.7 |
Percentage of units with a mortgage:
| Brighton East Farms: | 79.6% |
| Brighton: | 77.9% |
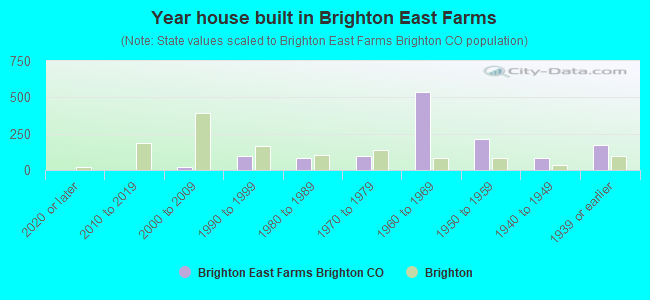
- Year house built in Brighton East Farms
- 02020 or later
- 32010 to 2019
- 192000 to 2009
- 931990 to 1999
- 821980 to 1989
- 981970 to 1979
- 5341960 to 1969
- 2151950 to 1959
- 831940 to 1949
- 1731939 or earlier
City-data.com crime index for city in 2020 (higher means more crime):
| City: | 304.4 |
| U.S. average: | 219.5 |
Travel time to work (commute)
![Travel time to work (commute)]()
- 32Less than 5 minutes
- 1185 to 9 minutes
- 8310 to 14 minutes
- 6715 to 19 minutes
- 9220 to 24 minutes
- 5125 to 29 minutes
- 28630 to 34 minutes
- 5135 to 39 minutes
- 7840 to 44 minutes
- 6645 to 59 minutes
- 2560 to 89 minutes
- 2990 or more minutes

Means of transportation to work
![Means of transportation to work]()
- 86.7%1,088Drove a car alone
- 2.8%35Carpooled
- 2.1%26Bus
- 0.3%4Other means
- 8.3%104Worked at home

Time leaving home to go to work
![Time leaving home to go to work]()
- 11012:00 a.m. to 4:59 a.m.
- 455:00 a.m. to 5:29 a.m.
- 995:30 a.m. to 5:59 a.m.
- 746:00 a.m. to 6:29 a.m.
- 1516:30 a.m. to 6:59 a.m.
- 867:00 a.m. to 7:29 a.m.
- 657:30 a.m. to 7:59 a.m.
- 658:00 a.m. to 8:29 a.m.
- 798:30 a.m. to 8:59 a.m.
- 549:00 a.m. to 9:59 a.m.
- 2210:00 a.m. to 10:59 a.m.
- 211:00 a.m. to 11:59 a.m.
- 4912:00 p.m. to 3:59 p.m.
- 884:00 p.m. to 11:59 p.m.

Occupations of males:
- Percentage of males in management occupations (except farmers):
Here: 4.1% city: 10.5%
- Percentage of males in business and financial operations occupations:
Here: 9.5% city: 3.2%
- Percentage of males in computer and mathematical occupations:
Here: 4.6% city: 3.0%
- Percentage of males in architecture and engineering occupations:
Here: 5.0% city: 2.4%
- Percentage of males in life, physical, and social science occupations:
Here: 2.0% city: 1.2%
- Percentage of males in community and social services occupations:
Here: 1.5% city: 1.2%
- Percentage of males in education, training, and library occupations:
Here: 9.0% city: 2.3%
- Percentage of males in service occupations:
Here: 6.4% city: 9.4%
- Percentage of males in sales and office occupations:
Here: 22.8% city: 15.1%
- Percentage of males in construction, extraction, and maintenance occupations:
Here: 29.4% city: 13.9%
- Percentage of males in production occupations:
Here: 13.8% city: 7.3%
- Percentage of males in transportation occupations:
Here: 12.8% city: 9.7%
- Percentage of males in material moving occupations:
Here: 9.0% city: 10.0%
Occupations of females:
- Percentage of females in management occupations (except farmers):
Here: 5.7% city: 9.8%
- Percentage of females in business and financial operations occupations:
Here: 9.3% city: 7.9%
- Percentage of females in computer and mathematical occupations:
Here: 2.9% city: 1.1%
- Percentage of females in community and social services occupations:
Here: 1.6% city: 2.3%
- Percentage of females in education, training, and library occupations:
Here: 12.5% city: 12.7%
- Percentage of females in healthcare practitioners and technical occupations:
Here: 1.6% city: 5.9%
- Percentage of females in service occupations:
Here: 8.2% city: 18.2%
- Percentage of females in sales and office occupations:
Here: 51.2% city: 30.5%
- Percentage of females in construction, extraction, and maintenance occupations:
Here: 6.4% city: 0.7%
- Percentage of females in material moving occupations:
Here: 8.0% city: 2.6%
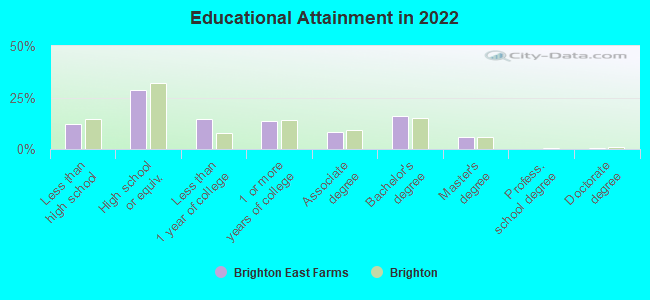
Education in this neighborhood (subdivision or community):
- Percentage of people 3 years and older in K-12 schools:
Brighton East Farms: 21.4% Brighton: 21.7%
- Percentage of people 3 years and older in undergraduate colleges:
Brighton East Farms: 0.9% Brighton: 1.9%
- Percentage of people 3 years and older in grad. or professional schools:
Brighton East Farms: 0.7% Brighton: 0.9%
- Percentage of students K-12 enrolled in private schools:
Brighton East Farms: 13.6% Brighton: 6.3%
Percentage of population below poverty level:
| Brighton East Farms: | 8.2% |
| Brighton: | 9.1% |
Median year owner moved in (as recorded in 2022):
Median year renter moved in (as recorded in 2022):
| Brighton East Farms: | 2019 |
| Brighton: | 2011 |
Median year renter moved in (as recorded in 2022):
| Brighton East Farms: | 2032 |
| Brighton: | 2017 |
Percentage of married-couple families with both working:
| Brighton East Farms: | 69.3% |
| Brighton: | 74.9% |
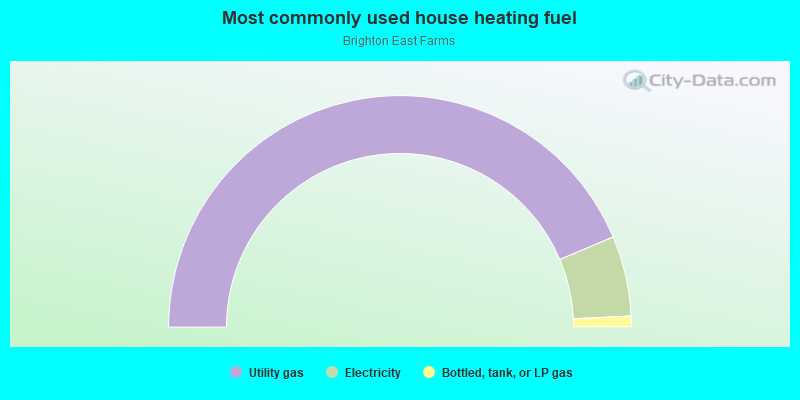
- 87.3%Utility gas
- 11.2%Electricity
- 1.5%Bottled, tank, or LP gas
Roads and streets:
Tumbleweed Dr
Length: 1.09 miles
Directions: E-W, N-S, SE-NW, SW-NE
Address range: 300 to 4499
Directions: E-W, N-S, SE-NW, SW-NE
Address range: 300 to 4499
Oxbow Dr
Length: 1.03 miles
Directions: E-W, N-S, SE-NW, SW-NE
Address range: 401 to 499
Directions: E-W, N-S, SE-NW, SW-NE
Address range: 401 to 499
Longs Peak St
Length: 0.65 miles
Directions: E-W, SE-NW
Directions: E-W, SE-NW
N 42nd Ave
Length: 0.62 miles
Directions: E-W, N-S, SE-NW
Address range: 1 to 99
Directions: E-W, N-S, SE-NW
Address range: 1 to 99
Spinning Wheel Dr
Length: 0.59 miles
Directions: E-W, N-S, SE-NW, SW-NE
Directions: E-W, N-S, SE-NW, SW-NE
Hayloft Way
Length: 0.58 miles
Directions: E-W, N-S, SE-NW, SW-NE
Address range: 400 to 699
Directions: E-W, N-S, SE-NW, SW-NE
Address range: 400 to 699
Midland St
Length: 0.55 miles
Directions: E-W, SE-NW
Directions: E-W, SE-NW
Homestead Way
Length: 0.51 miles
Directions: E-W, N-S, SE-NW, SW-NE
Address range: 200 to 4499
Directions: E-W, N-S, SE-NW, SW-NE
Address range: 200 to 4499
Prairie Dr
Length: 0.51 miles
Directions: E-W, N-S, SE-NW, SW-NE
Address range: 1 to 4399
Directions: E-W, N-S, SE-NW, SW-NE
Address range: 1 to 4399
N 48th Ave
Length: 0.49 miles
Direction: N-S
Address range: 401 to 599
Direction: N-S
Address range: 401 to 599
Haystack Ln
Length: 0.44 miles
Directions: E-W, N-S, SE-NW, SW-NE
Directions: E-W, N-S, SE-NW, SW-NE
Pioneer Pl
Length: 0.41 miles
Directions: E-W, N-S, SE-NW
Address range: 1 to 4399
Directions: E-W, N-S, SE-NW
Address range: 1 to 4399
Windmill Dr
Length: 0.41 miles
Direction: E-W
Address range: 4200 to 4499
Direction: E-W
Address range: 4200 to 4499
N 40th Ave
Length: 0.37 miles
Directions: N-S, SW-NE
Directions: N-S, SW-NE
Hedgerow Way
Length: 0.33 miles
Directions: N-S, SE-NW
Address range: 400 to 699
Directions: N-S, SE-NW
Address range: 400 to 699
Windrower Ct
Length: 0.30 miles
Directions: N-S, SW-NE
Directions: N-S, SW-NE
Stetson Ct
Length: 0.27 miles
Directions: N-S, SW-NE
Address range: 400 to 599
Directions: N-S, SW-NE
Address range: 400 to 599
Hopper Pl
Length: 0.27 miles
Direction: E-W
Direction: E-W
Farmhouse Way
Length: 0.26 miles
Directions: E-W, N-S, SE-NW, SW-NE
Address range: 400 to 599
Directions: E-W, N-S, SE-NW, SW-NE
Address range: 400 to 599
Harvest Ln
Length: 0.26 miles
Directions: E-W, SE-NW, SW-NE
Address range: 4000 to 4099
Directions: E-W, SE-NW, SW-NE
Address range: 4000 to 4099
Branding Iron Ct
Length: 0.25 miles
Directions: E-W, N-S, SW-NE
Address range: 500 to 699
Directions: E-W, N-S, SW-NE
Address range: 500 to 699
Threshing Dr
Length: 0.25 miles
Directions: E-W, SW-NE
Address range: 4200 to 4399
Directions: E-W, SW-NE
Address range: 4200 to 4399
Meadow Ln
Length: 0.23 miles
Directions: E-W, N-S, SE-NW, SW-NE
Directions: E-W, N-S, SE-NW, SW-NE
Farmer Pl
Length: 0.22 miles
Directions: E-W, N-S, SE-NW, SW-NE
Directions: E-W, N-S, SE-NW, SW-NE
Horseshoe Pl
Length: 0.22 miles
Directions: E-W, N-S, SW-NE
Directions: E-W, N-S, SW-NE
Combine Pl
Length: 0.21 miles
Directions: E-W, SE-NW
Address range: 4100 to 4199
Directions: E-W, SE-NW
Address range: 4100 to 4199
Singletree Ln
Length: 0.20 miles
Direction: E-W
Direction: E-W
Millet Cir
Length: 0.19 miles
Directions: E-W, N-S, SE-NW, SW-NE
Address range: 600 to 699
Directions: E-W, N-S, SE-NW, SW-NE
Address range: 600 to 699
N 45th Ave
Length: 0.18 miles
Direction: N-S
Direction: N-S
Clover Ln
Length: 0.18 miles
Directions: E-W, SW-NE
Address range: 4201 to 4299
Directions: E-W, SW-NE
Address range: 4201 to 4299
Sunshine Way
Length: 0.17 miles
Directions: E-W, N-S, SW-NE
Address range: 400 to 499
Directions: E-W, N-S, SW-NE
Address range: 400 to 499
Grain Ct
Length: 0.14 miles
Directions: N-S, SW-NE
Directions: N-S, SW-NE
Blue Bonnet Dr
Length: 0.13 miles
Direction: N-S
Address range: 100 to 299
Direction: N-S
Address range: 100 to 299
Alyssum Dr
Length: 0.13 miles
Direction: N-S
Direction: N-S
Foxglove Dr
Length: 0.12 miles
Directions: E-W, N-S
Address range: 100 to 199
Directions: E-W, N-S
Address range: 100 to 199
Harrow Ct
Length: 0.12 miles
Directions: N-S, SE-NW, SW-NE
Directions: N-S, SE-NW, SW-NE
Wheatfield Ln
Length: 0.11 miles
Directions: E-W, SE-NW
Directions: E-W, SE-NW
Sage Dr
Length: 0.10 miles
Directions: E-W, N-S
Directions: E-W, N-S
Daylight Ct
Length: 0.09 miles
Direction: N-S
Direction: N-S
Water Mill Dr
Length: 0.08 miles
Direction: E-W
Direction: E-W
Baler Ct
Length: 0.08 miles
Directions: N-S, SW-NE
Directions: N-S, SW-NE
Straw Ct
Length: 0.07 miles
Direction: N-S
Address range: 200 to 299
Direction: N-S
Address range: 200 to 299
Maize Ln
Length: 0.07 miles
Direction: E-W
Direction: E-W
Silo Ct
Length: 0.01 miles
Direction: SW-NE
Direction: SW-NE