Broadway Civic Corridor neighborhood in Glendale, California (CA), 91205, 91206 detailed profile
Settings
X


Business Search - 14 Million verified businesses
Area: 0.090 square miles
Population: 1,375
Population density:
| Broadway Civic Corridor: | 15,257 people per square mile |
| Glendale: | 6,175 people per square mile |

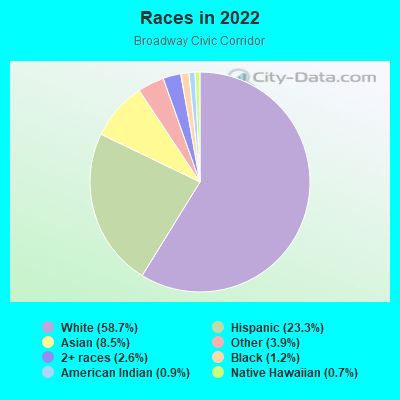
- 82658.7%White
- 32823.3%Hispanic or Latino
- 1208.5%Asian
- 553.9%Some other race
- 372.6%Two or more races
- 171.2%Black
- 130.9%American Indian
- 100.7%Native Hawaiian and Other
Pacific Islander
Median household income in 2022:
| Broadway Civic Corridor: | $39,425 |
| Glendale: | $77,483 |
Distribution of median household income
![Distribution of median household income]()
- 53Less than $10,000
- 141$10,000 to $19,999
- 201$20,000 to $29,999
- 32$30,000 to $39,999
- 35$40,000 to $49,999
- 71$50,000 to $59,999
- 16$60,000 to $74,999
- 65$75,000 to $99,999
- 68$100,000 to $124,999
- 19$125,000 to $149,999
- 87$150,000 to $199,999
- 85$200,000 or more

Distribution of owner-occupied house/condo value
![Distribution of owner-occupied house/condo value]()
- 3$200,000 to $249,999
- 27$300,000 to $399,999
- 7$400,000 to $499,999
- 26$500,000 to $749,999
- 7$750,000 to $999,999
- 6$1,000,000 or more

Distribution of rent paid by renters
![Distribution of rent paid by renters]()
- 15$100 to $199
- 92$200 to $299
- 56$300 to $399
- 34$400 to $499
- 66$500 to $599
- 15$600 to $699
- 8$700 to $799
- 6$800 to $899
- 12$900 to $999
- 52$1,000 to $1,249
- 84$1,250 to $1,499
- 111$1,500 to $1,999
- 250$2,000 or more

Median rent in 2022:
| Broadway Civic Corridor: | $1,488 |
| Glendale: | $1,842 |
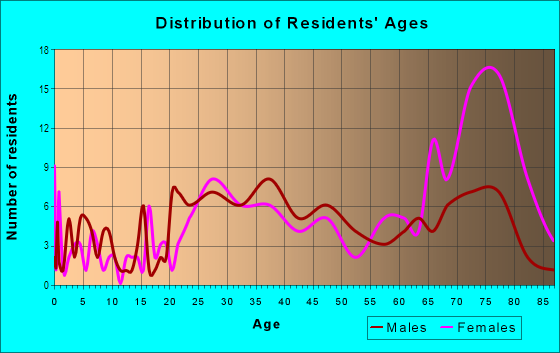
| Males: | 611 |
| Females: | 764 |
Males:
| This neighborhood: | 43.4 years |
| Whole city: | 41.8 years |
| This neighborhood: | 50.3 years |
| Whole city: | 43.4 years |
Average household size:
| Broadway Civic Corridor: | 1.7 people |
| Glendale: | 2.5 people |
Percentage of family households:
| Broadway Civic Corridor: | 20.5% |
| Glendale: | 40.0% |
| Here: | 33.6% |
| Glendale: | 44.2% |
Percentage of married-couple families with children (among all households):
| Broadway Civic Corridor: | 57.5% |
| Glendale: | 30.5% |
Percentage of single-mother households (among all households):
| Broadway Civic Corridor: | 19.9% |
| Glendale: | 7.0% |
Percentage of never married males 15 years old and over:
Percentage of never married females 15 years old and over:
| Broadway Civic Corridor: | 17.4% |
| Glendale: | 18.4% |
Percentage of never married females 15 years old and over:
| Broadway Civic Corridor: | 19.3% |
| city: | 18.3% |
Percentage of people that speak English not well or not at all:
| Broadway Civic Corridor: | 32.3% |
| Glendale: | 12.5% |
Percentage of people born in this state:
Percentage of people born in another U.S. state:
Percentage of native residents but born outside the U.S.:
Percentage of foreign born residents:
| Here: | 26.9% |
| Glendale: | 38.0% |
Percentage of people born in another U.S. state:
| Broadway Civic Corridor: | 10.3% |
| Glendale: | 11.6% |
Percentage of native residents but born outside the U.S.:
| Here: | 0.5% |
| city: | 1.5% |
Percentage of foreign born residents:
| Here: | 62.2% |
| Glendale: | 48.9% |
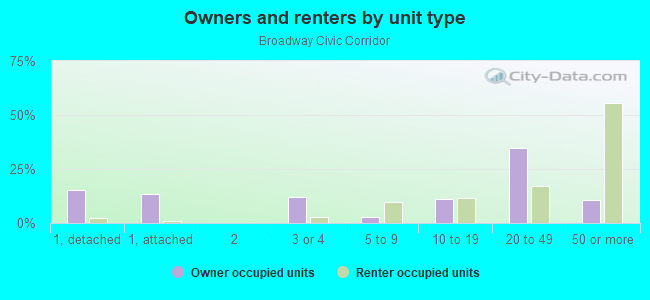
Owner-occupied
Renter-occupied

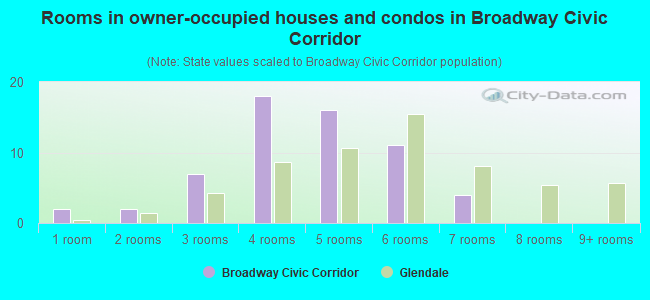
- Rooms in owner-occupied houses and condos in Broadway Civic Corridor
- 21 room
- 22 rooms
- 73 rooms
- 184 rooms
- 165 rooms
- 116 rooms
- 47 rooms
- 08 rooms
- 09+ rooms
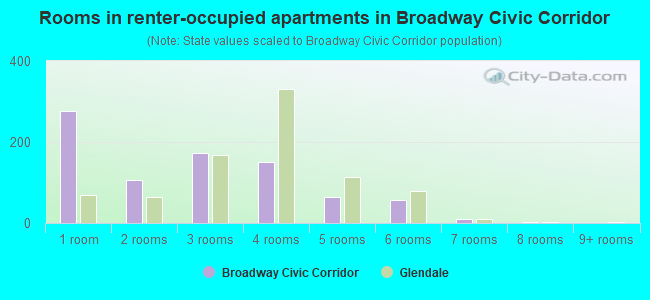
- Rooms in renter-occupied apartments in Broadway Civic Corridor
- 2761 room
- 1052 rooms
- 1733 rooms
- 1514 rooms
- 645 rooms
- 576 rooms
- 107 rooms
- 28 rooms
- 09+ rooms
Owner-occupied
Renter-occupied
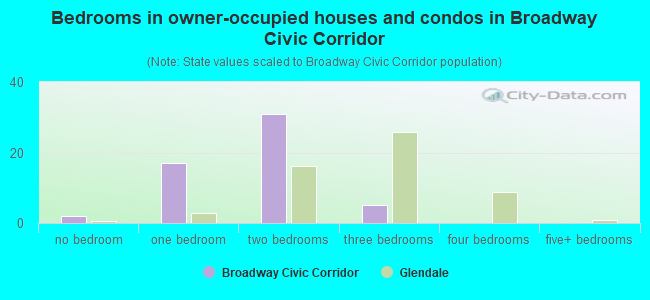
- Bedrooms in owner-occupied houses and condos in Broadway Civic Corridor
- 2no bedroom
- 171 bedroom
- 312 bedrooms
- 53 bedrooms
- 04 bedrooms
- 05+ bedrooms
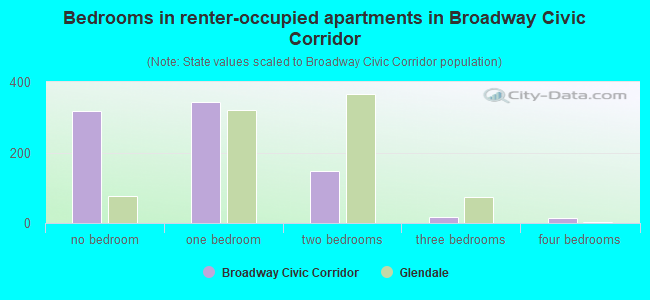
- Bedrooms in renter-occupied apartments in Broadway Civic Corridor
- 319no bedroom
- 3441 bedroom
- 1482 bedrooms
- 173 bedrooms
- 144 bedrooms
- 05+ bedrooms
Average number of cars or other vehicles available in houses/condos:
Average number of cars or other vehicles available in apartments:
| This neighborhood: | 1.4 |
| Glendale: | 2.0 |
Average number of cars or other vehicles available in apartments:
| Here: | 0.9 |
| city: | 1.4 |
Percentage of units with a mortgage:
| Broadway Civic Corridor: | 58.6% |
| Glendale: | 73.0% |
Average estimated '22 value of housing units in 5-or-more-unit structures (60.1% of all units):
| Broadway Civic Corridor: | $610,835 |
| Glendale: | $613,124 |
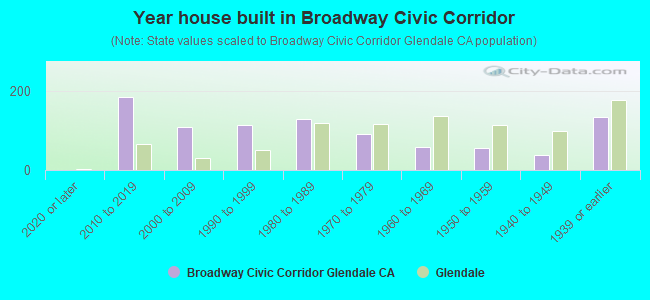
- Year house built in Broadway Civic Corridor
- 02020 or later
- 1842010 to 2019
- 1102000 to 2009
- 1141990 to 1999
- 1291980 to 1989
- 921970 to 1979
- 591960 to 1969
- 561950 to 1959
- 371940 to 1949
- 1351939 or earlier
City-data.com crime index for city in 2020 (higher means more crime):
| City: | 110.5 |
| U.S. average: | 219.5 |
Travel time to work (commute)
![Travel time to work (commute)]()
- 195 to 9 minutes
- 12310 to 14 minutes
- 10415 to 19 minutes
- 5220 to 24 minutes
- 2325 to 29 minutes
- 11530 to 34 minutes
- 1435 to 39 minutes
- 2040 to 44 minutes
- 9245 to 59 minutes
- 2660 to 89 minutes
- 790 or more minutes

Means of transportation to work
![Means of transportation to work]()
- 67.1%464Drove a car alone
- 6.4%44Carpooled
- 3.9%27Bus
- 1.0%7Taxi
- 8.5%59Walked
- 2.7%19Other means
- 14.0%97Worked at home

Time leaving home to go to work
![Time leaving home to go to work]()
- 912:00 a.m. to 4:59 a.m.
- 155:00 a.m. to 5:29 a.m.
- 185:30 a.m. to 5:59 a.m.
- 186:00 a.m. to 6:29 a.m.
- 256:30 a.m. to 6:59 a.m.
- 757:00 a.m. to 7:29 a.m.
- 197:30 a.m. to 7:59 a.m.
- 788:00 a.m. to 8:29 a.m.
- 298:30 a.m. to 8:59 a.m.
- 1009:00 a.m. to 9:59 a.m.
- 7310:00 a.m. to 10:59 a.m.
- 1111:00 a.m. to 11:59 a.m.
- 6112:00 p.m. to 3:59 p.m.
- 224:00 p.m. to 11:59 p.m.

Occupations of males:
- Percentage of males in management occupations (except farmers):
Here: 20.9% city: 12.9%
- Percentage of males in business and financial operations occupations:
Here: 3.2% city: 4.8%
- Percentage of males in computer and mathematical occupations:
Here: 4.5% city: 5.2%
- Percentage of males in architecture and engineering occupations:
Here: 7.5% city: 4.1%
- Percentage of males in life, physical, and social science occupations:
Here: 1.3% city: 0.9%
- Percentage of males in legal occupations:
Here: 8.3% city: 1.2%
- Percentage of males in education, training, and library occupations:
Here: 2.2% city: 2.0%
- Percentage of males in arts, design, entertainment, sports, and media occupations:
Here: 12.2% city: 8.9%
- Percentage of males in healthcare practitioners and technical occupations:
Here: 5.4% city: 5.5%
- Percentage of males in service occupations:
Here: 10.3% city: 11.8%
- Percentage of males in sales and office occupations:
Here: 8.8% city: 18.3%
- Percentage of males in construction, extraction, and maintenance occupations:
Here: 2.8% city: 5.5%
- Percentage of males in production occupations:
Here: 4.0% city: 4.2%
- Percentage of males in transportation occupations:
Here: 7.5% city: 6.0%
- Percentage of males in material moving occupations:
Here: 1.3% city: 2.3%
Occupations of females:
- Percentage of females in management occupations (except farmers):
Here: 18.0% city: 10.3%
- Percentage of females in business and financial operations occupations:
Here: 8.5% city: 6.1%
- Percentage of females in computer and mathematical occupations:
Here: 10.1% city: 1.6%
- Percentage of females in architecture and engineering occupations:
Here: 3.0% city: 1.0%
- Percentage of females in life, physical, and social science occupations:
Here: 1.0% city: 1.5%
- Percentage of females in community and social services occupations:
Here: 1.8% city: 2.8%
- Percentage of females in legal occupations:
Here: 1.8% city: 2.6%
- Percentage of females in education, training, and library occupations:
Here: 2.4% city: 9.4%
- Percentage of females in arts, design, entertainment, sports, and media occupations:
Here: 4.1% city: 6.1%
- Percentage of females in healthcare practitioners and technical occupations:
Here: 9.3% city: 10.7%
- Percentage of females in service occupations:
Here: 20.1% city: 18.3%
- Percentage of females in sales and office occupations:
Here: 11.0% city: 26.5%
- Percentage of females in production occupations:
Here: 4.3% city: 1.5%
- Percentage of females in material moving occupations:
Here: 4.5% city: 0.7%
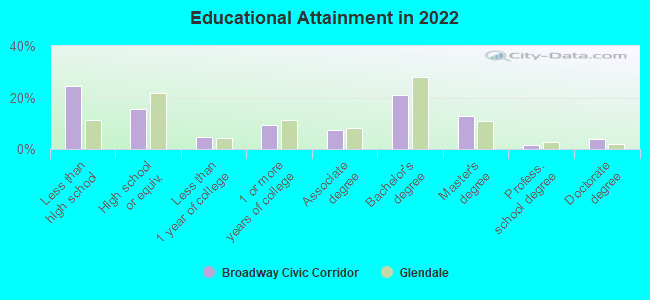
Education in this neighborhood (subdivision or community):
- Percentage of people 3 years and older in K-12 schools:
Broadway Civic Corridor: 6.3% Glendale: 14.1%
- Percentage of people 3 years and older in undergraduate colleges:
Broadway Civic Corridor: 4.4% Glendale: 5.2%
- Percentage of people 3 years and older in grad. or professional schools:
Broadway Civic Corridor: 3.2% Glendale: 1.9%
- Percentage of students K-12 enrolled in private schools:
Broadway Civic Corridor: 1.2% Glendale: 9.3%
Percentage of population below poverty level:
| Broadway Civic Corridor: | 26.2% |
| Glendale: | 13.0% |
Median year owner moved in (as recorded in 2022):
Median year renter moved in (as recorded in 2022):
| Broadway Civic Corridor: | 2014 |
| Glendale: | 2007 |
Median year renter moved in (as recorded in 2022):
| Broadway Civic Corridor: | 2016 |
| Glendale: | 2018 |
Percentage of married-couple families with both working:
| Broadway Civic Corridor: | 62.4% |
| Glendale: | 66.7% |
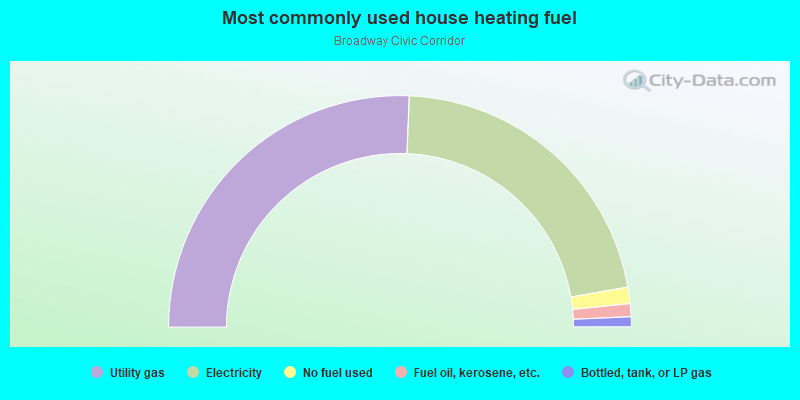
- 51.3%Utility gas
- 43.2%Electricity
- 2.3%No fuel used
- 1.8%Fuel oil, kerosene, etc.
- 1.4%Bottled, tank, or LP gas
Roads and streets:
E Broadway
Length: 0.26 miles
Direction: E-W
Address range: 300 to 599
Direction: E-W
Address range: 300 to 599
E Harvard St
Length: 0.17 miles
Direction: E-W
Address range: 400 to 599
Direction: E-W
Address range: 400 to 599
S Kenwood St
Length: 0.13 miles
Direction: N-S
Address range: 100 to 199
Direction: N-S
Address range: 100 to 199
S Louise St
Length: 0.13 miles
Direction: N-S
Address range: 100 to 199
Direction: N-S
Address range: 100 to 199
S Jackson St
Length: 0.13 miles
Direction: N-S
Address range: 100 to 199
Direction: N-S
Address range: 100 to 199
S Isabel St
Length: 0.13 miles
Direction: N-S
Address range: 100 to 199
Direction: N-S
Address range: 100 to 199