Calabazas South neighborhood in San Jose, California (CA), 95129 detailed profile
Settings
X

Business Search - 14 Million verified businesses
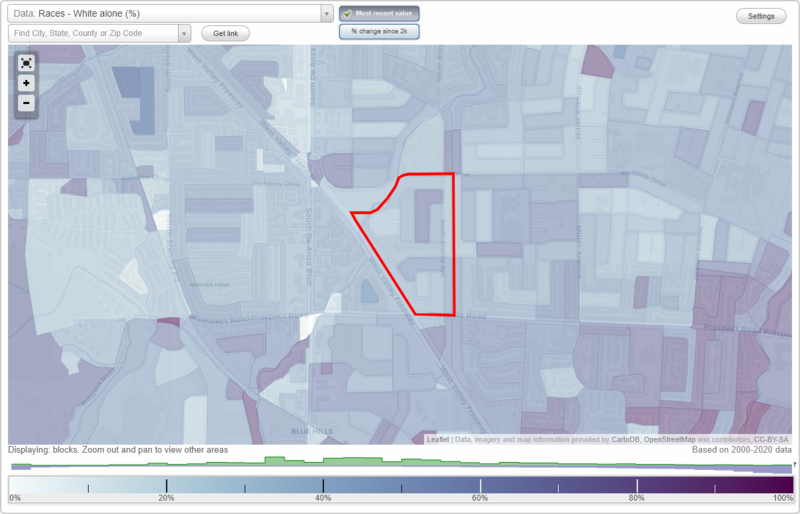
Area: 0.121 square miles
Population: 1,263
Population density:
| Calabazas South: | 10,412 people per square mile |
| San Jose: | 5,554 people per square mile |

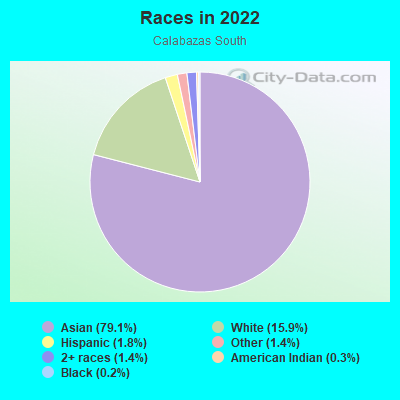
- 1,01879.1%Asian
- 20415.9%White
- 231.8%Hispanic or Latino
- 181.4%Some other race
- 181.4%Two or more races
- 40.3%American Indian
- 20.2%Black
Distribution of median household income
![Distribution of median household income]()
- 9Less than $10,000
- 9$10,000 to $19,999
- 16$20,000 to $29,999
- 49$30,000 to $39,999
- 21$40,000 to $49,999
- 7$50,000 to $59,999
- 10$60,000 to $74,999
- 10$75,000 to $99,999
- 13$100,000 to $124,999
- 75$125,000 to $149,999
- 57$150,000 to $199,999
- 221$200,000 or more

Distribution of owner-occupied house/condo value
![Distribution of owner-occupied house/condo value]()
- 6$100,000 to $149,999
- 11$150,000 to $199,999
- 1$200,000 to $249,999
- 28$500,000 to $749,999
- 85$750,000 to $999,999
- 227$1,000,000 or more

Distribution of rent paid by renters
![Distribution of rent paid by renters]()
- 11$600 to $699
- 22$800 to $899
- 10$1,250 to $1,499
- 14$1,500 to $1,999
- 113$2,000 or more

Median rent in 2022:
| Calabazas South: | $2,606 |
| San Jose: | $2,001 |
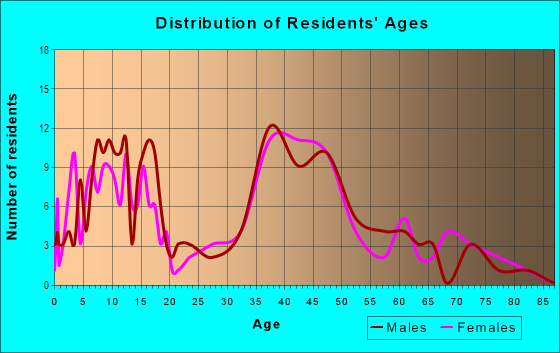
| Males: | 630 |
| Females: | 632 |
Males:
| This neighborhood: | 44.8 years |
| Whole city: | 37.6 years |
| This neighborhood: | 43.4 years |
| Whole city: | 39.1 years |
Average household size:
| Calabazas South: | 2.9 people |
| San Jose: | 2.9 people |
Percentage of family households:
| Calabazas South: | 64.7% |
| San Jose: | 49.9% |
| Here: | 67.7% |
| San Jose: | 53.0% |
Percentage of married-couple families with children (among all households):
| Calabazas South: | 28.7% |
| San Jose: | 25.8% |
Percentage of single-mother households (among all households):
| Calabazas South: | 4.0% |
| San Jose: | 5.2% |
Percentage of never married males 15 years old and over:
Percentage of never married females 15 years old and over:
| Calabazas South: | 9.4% |
| San Jose: | 20.9% |
Percentage of never married females 15 years old and over:
| Calabazas South: | 9.3% |
| city: | 16.7% |
Percentage of people that speak English not well or not at all:
| Calabazas South: | 6.6% |
| San Jose: | 11.4% |
Percentage of people born in this state:
Percentage of people born in another U.S. state:
Percentage of native residents but born outside the U.S.:
Percentage of foreign born residents:
| Here: | 33.6% |
| San Jose: | 46.1% |
Percentage of people born in another U.S. state:
| Calabazas South: | 15.5% |
| San Jose: | 10.4% |
Percentage of native residents but born outside the U.S.:
| Here: | 0.7% |
| city: | 1.7% |
Percentage of foreign born residents:
| Here: | 50.2% |
| San Jose: | 41.8% |
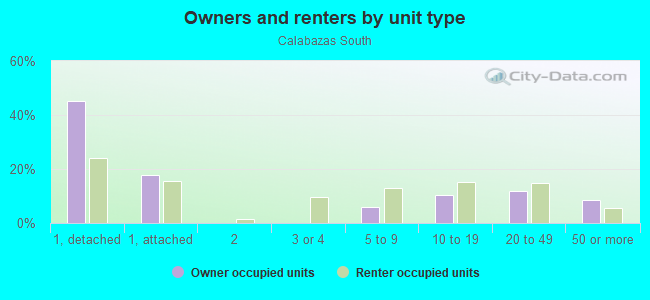
Owner-occupied
Renter-occupied

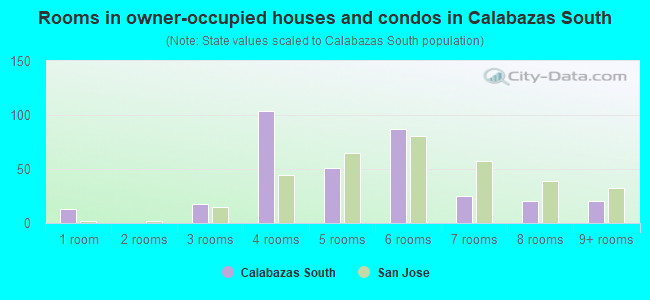
- Rooms in owner-occupied houses and condos in Calabazas South
- 131 room
- 02 rooms
- 183 rooms
- 1044 rooms
- 515 rooms
- 876 rooms
- 257 rooms
- 208 rooms
- 209+ rooms
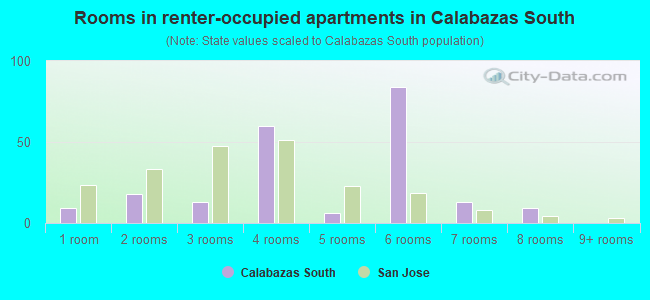
- Rooms in renter-occupied apartments in Calabazas South
- 91 room
- 182 rooms
- 133 rooms
- 604 rooms
- 65 rooms
- 846 rooms
- 137 rooms
- 98 rooms
- 09+ rooms
Owner-occupied
Renter-occupied
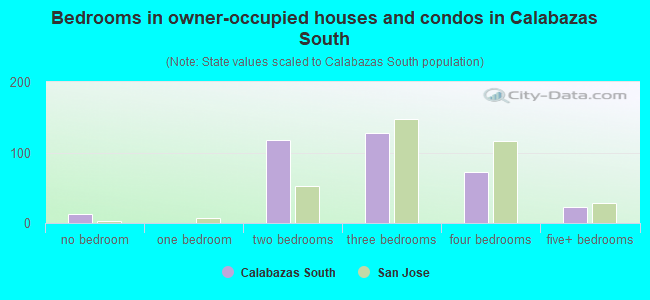
- Bedrooms in owner-occupied houses and condos in Calabazas South
- 13no bedroom
- 01 bedroom
- 1182 bedrooms
- 1273 bedrooms
- 734 bedrooms
- 235+ bedrooms
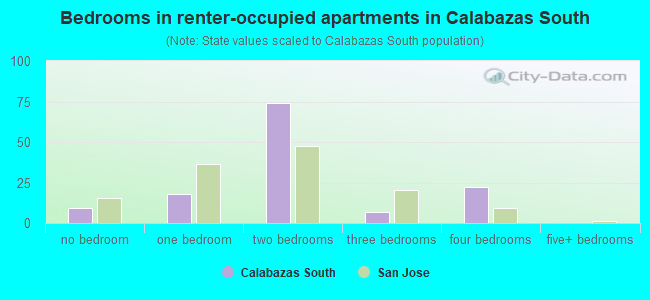
- Bedrooms in renter-occupied apartments in Calabazas South
- 9no bedroom
- 181 bedroom
- 742 bedrooms
- 73 bedrooms
- 224 bedrooms
- 05+ bedrooms
Average number of cars or other vehicles available in houses/condos:
Average number of cars or other vehicles available in apartments:
| This neighborhood: | 2.0 |
| San Jose: | 2.3 |
Average number of cars or other vehicles available in apartments:
| Here: | 1.9 |
| city: | 1.6 |
Percentage of units with a mortgage:
| Calabazas South: | 62.4% |
| San Jose: | 66.9% |
Housing prices:
- Average estimated value of detached houses in 2022 (46.8% of all units):
Calabazas South: $2,242,149 San Jose: $1,532,815
- Average estimated '22 value of housing units in 5-or-more-unit structures (7.9% of all units):
Calabazas South: $26,077 San Jose: $791,954
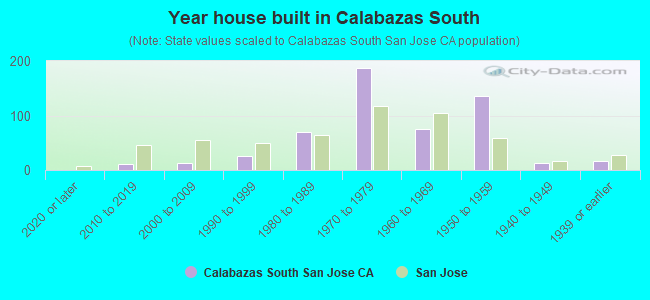
- Year house built in Calabazas South
- 02020 or later
- 112010 to 2019
- 122000 to 2009
- 251990 to 1999
- 691980 to 1989
- 1881970 to 1979
- 751960 to 1969
- 1351950 to 1959
- 131940 to 1949
- 161939 or earlier
City-data.com crime index for city in 2020 (higher means more crime):
| City: | 268.4 |
| U.S. average: | 219.5 |
Travel time to work (commute)
![Travel time to work (commute)]()
- 10Less than 5 minutes
- 95 to 9 minutes
- 3110 to 14 minutes
- 3715 to 19 minutes
- 6420 to 24 minutes
- 6125 to 29 minutes
- 6230 to 34 minutes
- 1735 to 39 minutes
- 2140 to 44 minutes
- 5245 to 59 minutes
- 2060 to 89 minutes
- 990 or more minutes

Means of transportation to work
![Means of transportation to work]()
- 62.6%378Drove a car alone
- 5.5%33Carpooled
- 0.2%1Bus
- 0.8%5Subway or elevated rail
- 2.3%14Long-distance train or commuter rail
- 0.2%1Taxi
- 1.5%9Motorcycle
- 0.5%3Bicycle
- 4.5%27Walked
- 30.5%184Worked at home

Time leaving home to go to work
![Time leaving home to go to work]()
- 212:00 a.m. to 4:59 a.m.
- 85:00 a.m. to 5:29 a.m.
- 15:30 a.m. to 5:59 a.m.
- 96:00 a.m. to 6:29 a.m.
- 166:30 a.m. to 6:59 a.m.
- 267:00 a.m. to 7:29 a.m.
- 557:30 a.m. to 7:59 a.m.
- 798:00 a.m. to 8:29 a.m.
- 408:30 a.m. to 8:59 a.m.
- 899:00 a.m. to 9:59 a.m.
- 2510:00 a.m. to 10:59 a.m.
- 211:00 a.m. to 11:59 a.m.
- 1812:00 p.m. to 3:59 p.m.
- 114:00 p.m. to 11:59 p.m.

Occupations of males:
- Percentage of males in management occupations (except farmers):
Here: 18.2% city: 13.0%
- Percentage of males in business and financial operations occupations:
Here: 1.8% city: 4.6%
- Percentage of males in computer and mathematical occupations:
Here: 34.4% city: 13.6%
- Percentage of males in architecture and engineering occupations:
Here: 24.6% city: 10.2%
- Percentage of males in life, physical, and social science occupations:
Here: 4.5% city: 1.1%
- Percentage of males in education, training, and library occupations:
Here: 6.4% city: 2.8%
- Percentage of males in service occupations:
Here: 4.6% city: 12.7%
- Percentage of males in sales and office occupations:
Here: 1.2% city: 12.8%
- Percentage of males in transportation occupations:
Here: 3.3% city: 3.6%
Occupations of females:
- Percentage of females in management occupations (except farmers):
Here: 10.1% city: 11.0%
- Percentage of females in business and financial operations occupations:
Here: 10.2% city: 8.6%
- Percentage of females in computer and mathematical occupations:
Here: 9.0% city: 5.4%
- Percentage of females in architecture and engineering occupations:
Here: 14.4% city: 2.8%
- Percentage of females in life, physical, and social science occupations:
Here: 10.7% city: 1.7%
- Percentage of females in community and social services occupations:
Here: 1.1% city: 1.8%
- Percentage of females in legal occupations:
Here: 2.2% city: 1.3%
- Percentage of females in education, training, and library occupations:
Here: 8.8% city: 8.1%
- Percentage of females in arts, design, entertainment, sports, and media occupations:
Here: 4.1% city: 2.0%
- Percentage of females in healthcare practitioners and technical occupations:
Here: 7.4% city: 6.8%
- Percentage of females in service occupations:
Here: 7.2% city: 21.7%
- Percentage of females in sales and office occupations:
Here: 16.0% city: 22.0%
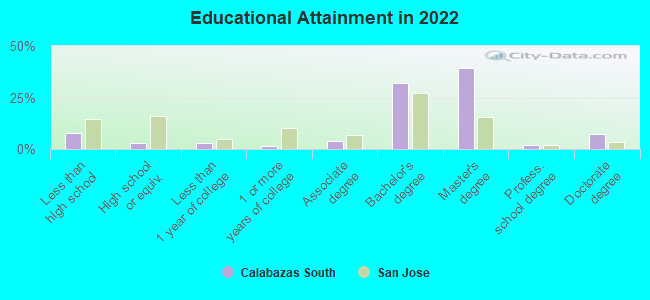
Education in this neighborhood (subdivision or community):
- Percentage of people 3 years and older in K-12 schools:
Calabazas South: 24.5% San Jose: 16.1%
- Percentage of people 3 years and older in undergraduate colleges:
Calabazas South: 3.6% San Jose: 6.5%
- Percentage of people 3 years and older in grad. or professional schools:
Calabazas South: 1.3% San Jose: 2.0%
- Percentage of students K-12 enrolled in private schools:
Calabazas South: 21.8% San Jose: 14.9%
Percentage of population below poverty level:
| Calabazas South: | 8.1% |
| San Jose: | 9.0% |
Median year owner moved in (as recorded in 2022):
Median year renter moved in (as recorded in 2022):
| Calabazas South: | 2005 |
| San Jose: | 2008 |
Median year renter moved in (as recorded in 2022):
| Calabazas South: | 2015 |
| San Jose: | 2020 |
Percentage of married-couple families with both working:
| Calabazas South: | 64.3% |
| San Jose: | 72.5% |
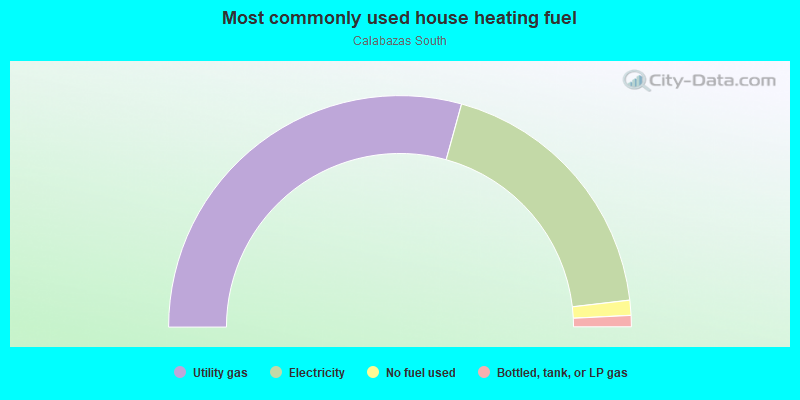
- 58.6%Utility gas
- 37.7%Electricity
- 2.1%No fuel used
- 1.6%Bottled, tank, or LP gas
Roads and streets:
S Blaney Ave
Length: 0.34 miles
Direction: N-S
Address range: 1250 to 1549
Direction: N-S
Address range: 1250 to 1549
Calabazas Creek Cir
Length: 0.33 miles
Directions: E-W, N-S, SE-NW, SW-NE
Address range: 6900 to 7099
Directions: E-W, N-S, SE-NW, SW-NE
Address range: 6900 to 7099
Dartmoor Way
Length: 0.22 miles
Directions: E-W, SW-NE
Address range: 6800 to 6999
Directions: E-W, SW-NE
Address range: 6800 to 6999
Kintyre Way
Length: 0.20 miles
Directions: E-W, N-S, SW-NE
Address range: 1300 to 1499
Directions: E-W, N-S, SW-NE
Address range: 1300 to 1499
Eddington Pl
Length: 0.19 miles
Directions: E-W, SE-NW
Address range: 1400 to 1599
Directions: E-W, SE-NW
Address range: 1400 to 1599
Westmoor Way
Length: 0.19 miles
Directions: E-W, SW-NE
Address range: 6800 to 6999
Directions: E-W, SW-NE
Address range: 6800 to 6999
Windsor Way
Length: 0.19 miles
Direction: E-W
Address range: 6800 to 6999
Direction: E-W
Address range: 6800 to 6999
Buckthorne Way
Length: 0.19 miles
Direction: N-S
Address range: 1300 to 1499
Direction: N-S
Address range: 1300 to 1499
Longfellow Way
Length: 0.17 miles
Directions: N-S, SE-NW, SW-NE
Address range: 1200 to 1499
Directions: N-S, SE-NW, SW-NE
Address range: 1200 to 1499
Devon Way
Length: 0.15 miles
Directions: E-W, N-S, SW-NE
Address range: 1500 to 6999
Directions: E-W, N-S, SW-NE
Address range: 1500 to 6999
Mc Gregor Way
Length: 0.12 miles
Direction: N-S
Address range: 1500 to 1699
Direction: N-S
Address range: 1500 to 1699
Longfellow Ct
Length: 0.07 miles
Direction: E-W
Address range: 6900 to 6999
Direction: E-W
Address range: 6900 to 6999
Loch Lomond Ln
Length: 0.06 miles
Directions: N-S, SE-NW
Address range: 1500 to 1699
Directions: N-S, SE-NW
Address range: 1500 to 1699
Rutherford Ave
Length: 0.06 miles
Directions: E-W, SE-NW
Address range: 1500 to 6898
Directions: E-W, SE-NW
Address range: 1500 to 6898