Calvert Square neighborhood in Norfolk, Virginia (VA), 23504 detailed profile
Settings
X

Business Search - 14 Million verified businesses
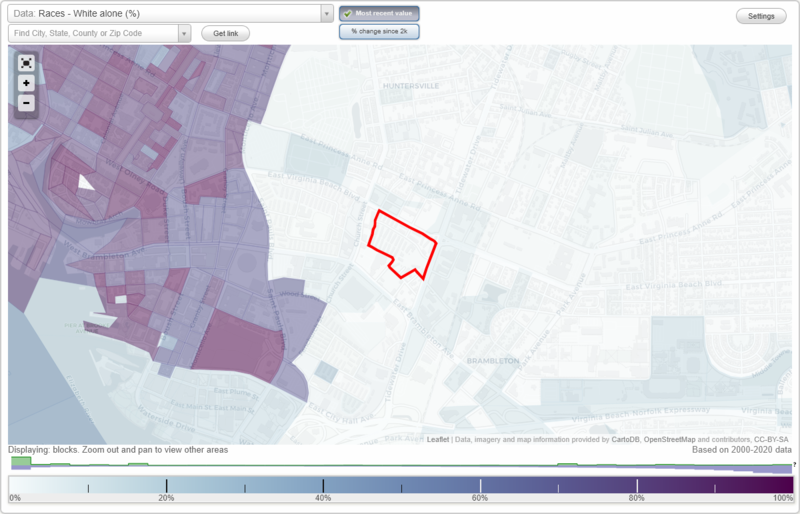
Area: 0.032 square miles
Population: 508
Population density:
| Calvert Square: | 15,938 people per square mile |
| Norfolk: | 4,337 people per square mile |

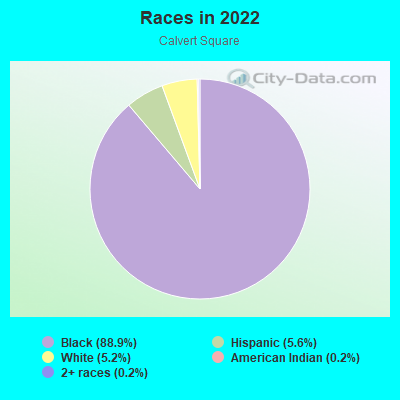
- 48088.9%Black
- 305.6%Hispanic or Latino
- 285.2%White
- 10.2%American Indian
- 10.2%Two or more races
Median household income in 2022:
| Calvert Square: | $12,371 |
| Norfolk: | $61,090 |
Distribution of median household income
![Distribution of median household income]()
- 60Less than $10,000
- 66$10,000 to $19,999
- 6$20,000 to $29,999
- 37$30,000 to $39,999
- 9$40,000 to $49,999
- 4$50,000 to $59,999
- 1$60,000 to $74,999
- 3$75,000 to $99,999
- 6$125,000 to $149,999

Distribution of owner-occupied house/condo value
![Distribution of owner-occupied house/condo value]()
- 1Less than $50,000
- 4$150,000 to $199,999
- 3$500,000 to $749,999

Distribution of rent paid by renters
![Distribution of rent paid by renters]()
- 31Less than $100
- 18$100 to $199
- 34$200 to $299
- 40$300 to $399
- 17$500 to $599
- 7$600 to $699
- 32$700 to $799
- 3$900 to $999
- 9$1,000 to $1,249
- 9$1,500 to $1,999

Median rent in 2022:
| Calvert Square: | $325 |
| Norfolk: | $1,035 |
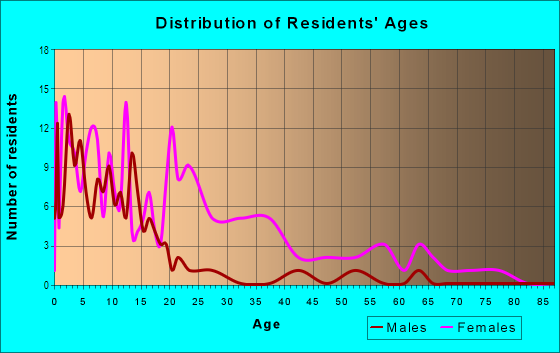
| Males: | 230 |
| Females: | 277 |
Males:
| This neighborhood: | 13.6 years |
| Whole city: | 31.3 years |
| This neighborhood: | 36.3 years |
| Whole city: | 34.4 years |
Average household size:
| Calvert Square: | 2.8 people |
| Norfolk: | 2.3 people |
Percentage of family households:
| Calvert Square: | 69.9% |
| Norfolk: | 41.3% |
| Here: | 4.4% |
| Norfolk: | 31.7% |
Percentage of married-couple families with children (among all households):
| Calvert Square: | 2.3% |
| Norfolk: | 20.2% |
Percentage of single-mother households (among all households):
| Calvert Square: | 35.3% |
| Norfolk: | 16.3% |
Percentage of never married males 15 years old and over:
Percentage of never married females 15 years old and over:
| Calvert Square: | 31.0% |
| Norfolk: | 25.4% |
Percentage of never married females 15 years old and over:
| Calvert Square: | 44.2% |
| city: | 20.5% |
Percentage of people that speak English not well or not at all:
| Calvert Square: | 5.4% |
| Norfolk: | 1.4% |
Percentage of people born in this state:
Percentage of people born in another U.S. state:
Percentage of native residents but born outside the U.S.:
Percentage of foreign born residents:
| Here: | 71.4% |
| Norfolk: | 51.1% |
Percentage of people born in another U.S. state:
| Calvert Square: | 21.1% |
| Norfolk: | 40.8% |
Percentage of native residents but born outside the U.S.:
| Here: | 0.0% |
| city: | 1.6% |
Percentage of foreign born residents:
| Here: | 7.5% |
| Norfolk: | 6.5% |
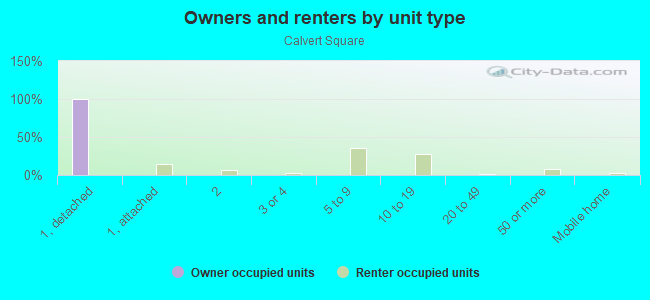
Owner-occupied
Renter-occupied

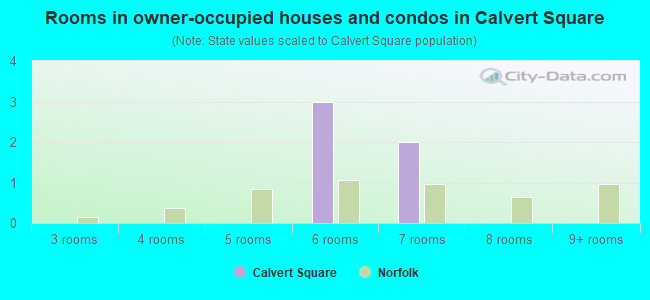
- Rooms in owner-occupied houses and condos in Calvert Square
- 01 room
- 02 rooms
- 03 rooms
- 04 rooms
- 05 rooms
- 36 rooms
- 27 rooms
- 08 rooms
- 09+ rooms
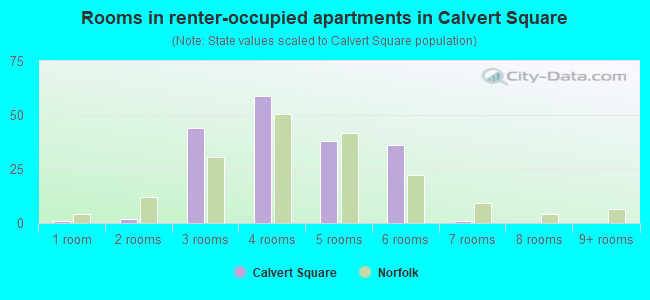
- Rooms in renter-occupied apartments in Calvert Square
- 11 room
- 22 rooms
- 443 rooms
- 594 rooms
- 385 rooms
- 366 rooms
- 17 rooms
- 08 rooms
- 09+ rooms
Owner-occupied
Renter-occupied
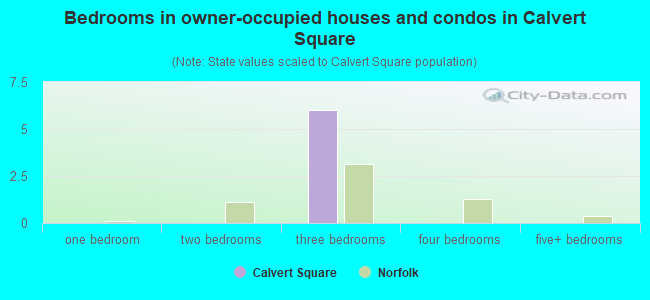
- Bedrooms in owner-occupied houses and condos in Calvert Square
- 0no bedroom
- 01 bedroom
- 02 bedrooms
- 63 bedrooms
- 04 bedrooms
- 05+ bedrooms
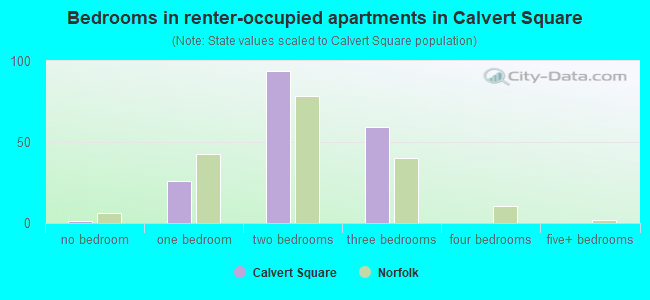
- Bedrooms in renter-occupied apartments in Calvert Square
- 1no bedroom
- 261 bedroom
- 942 bedrooms
- 593 bedrooms
- 04 bedrooms
- 05+ bedrooms
Average number of cars or other vehicles available in houses/condos:
Average number of cars or other vehicles available in apartments:
| This neighborhood: | |
| Norfolk: |
Average number of cars or other vehicles available in apartments:
| Here: | 0.5 |
| city: | 1.3 |
Percentage of units with a mortgage:
| Calvert Square: | 40.9% |
| Norfolk: | 70.0% |
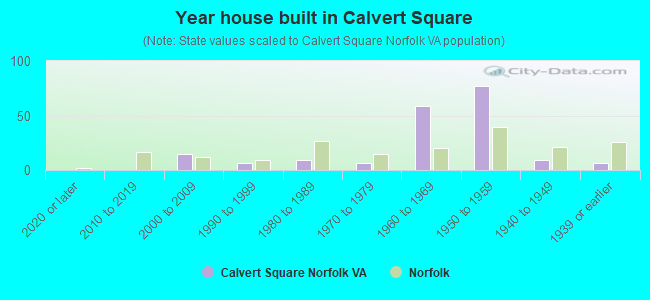
- Year house built in Calvert Square
- 02020 or later
- 02010 to 2019
- 152000 to 2009
- 61990 to 1999
- 91980 to 1989
- 61970 to 1979
- 591960 to 1969
- 771950 to 1959
- 91940 to 1949
- 61939 or earlier
City-data.com crime index for city in 2020 (higher means more crime):
| City: | 327.9 |
| U.S. average: | 219.5 |
Travel time to work (commute)
![Travel time to work (commute)]()
- 75 to 9 minutes
- 4210 to 14 minutes
- 915 to 19 minutes
- 1820 to 24 minutes
- 1030 to 34 minutes
- 660 to 89 minutes
- 490 or more minutes

Means of transportation to work
![Means of transportation to work]()
- 31.1%30Drove a car alone
- 16.6%16Carpooled
- 28.0%27Bus
- 22.8%22Walked

Time leaving home to go to work
![Time leaving home to go to work]()
- 95:00 a.m. to 5:29 a.m.
- 206:00 a.m. to 6:29 a.m.
- 47:00 a.m. to 7:29 a.m.
- 157:30 a.m. to 7:59 a.m.
- 68:30 a.m. to 8:59 a.m.
- 610:00 a.m. to 10:59 a.m.
- 3011:00 a.m. to 11:59 a.m.
- 412:00 p.m. to 3:59 p.m.
- 34:00 p.m. to 11:59 p.m.

Occupations of males:
- Percentage of males in management occupations (except farmers):
Here: 11.6% city: 8.2%
- Percentage of males in service occupations:
Here: 38.2% city: 16.9%
- Percentage of males in sales and office occupations:
Here: 4.1% city: 15.6%
- Percentage of males in production occupations:
Here: 20.0% city: 6.5%
- Percentage of males in material moving occupations:
Here: 41.8% city: 5.3%
Occupations of females:
- Percentage of females in service occupations:
Here: 68.3% city: 22.3%
- Percentage of females in production occupations:
Here: 31.7% city: 2.7%
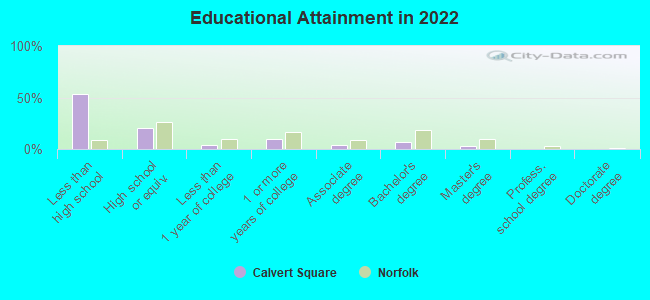
Education in this neighborhood (subdivision or community):
- Percentage of people 3 years and older in K-12 schools:
Calvert Square: 29.7% Norfolk: 14.3%
- Percentage of people 3 years and older in undergraduate colleges:
Calvert Square: 2.0% Norfolk: 8.0%
- Percentage of people 3 years and older in grad. or professional schools:
Calvert Square: 0.0% Norfolk: 2.1%
- Percentage of students K-12 enrolled in private schools:
Calvert Square: 8.2% Norfolk: 16.2%
Percentage of population below poverty level:
| Calvert Square: | 67.2% |
| Norfolk: | 17.7% |
Median year renter moved in (as recorded in 2022):
| Calvert Square: | 2012 |
| Norfolk: | 2020 |
Percentage of married-couple families with both working:
| Calvert Square: | 0.0% |
| Norfolk: | 65.5% |
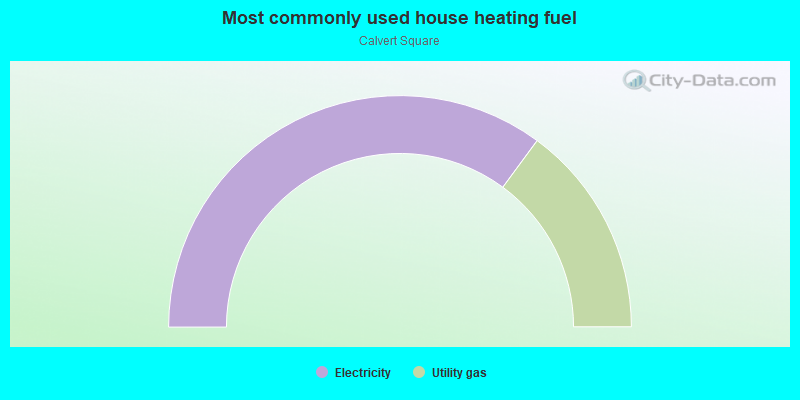
- 70.2%Electricity
- 29.8%Utility gas
Roads and streets:
Bagnall Rd
Length: 0.12 miles
Directions: E-W, SE-NW
Address range: 900 to 999
Directions: E-W, SE-NW
Address range: 900 to 999
Turnstall Ave
Length: 0.04 miles
Direction: SW-NE
Direction: SW-NE