Capewood neighborhood in San Jose, California (CA), 95132 detailed profile
Settings
X

Business Search - 14 Million verified businesses
Area: 0.179 square miles
Population: 1,554
Population density:
| Capewood: | 8,703 people per square mile |
| San Jose: | 5,554 people per square mile |

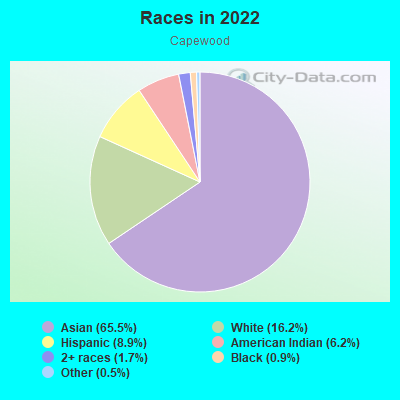
- 1,05065.5%Asian
- 26016.2%White
- 1438.9%Hispanic or Latino
- 996.2%American Indian
- 281.7%Two or more races
- 150.9%Black
- 80.5%Some other race
Median household income in 2022:
| Capewood: | $169,519 |
| San Jose: | $133,835 |
Distribution of median household income
![Distribution of median household income]()
- 28Less than $10,000
- 18$10,000 to $19,999
- 95$20,000 to $29,999
- 19$30,000 to $39,999
- 24$40,000 to $49,999
- 20$50,000 to $59,999
- 15$60,000 to $74,999
- 13$75,000 to $99,999
- 43$100,000 to $124,999
- 56$125,000 to $149,999
- 70$150,000 to $199,999
- 171$200,000 or more

Distribution of owner-occupied house/condo value
![Distribution of owner-occupied house/condo value]()
- 42Less than $50,000
- 10$50,000 to $99,999
- 12$100,000 to $149,999
- 9$300,000 to $399,999
- 5$400,000 to $499,999
- 42$500,000 to $749,999
- 18$750,000 to $999,999
- 269$1,000,000 or more

Distribution of rent paid by renters
![Distribution of rent paid by renters]()
- 3$200 to $299
- 10$300 to $399
- 9$400 to $499
- 12$600 to $699
- 9$700 to $799
- 15$900 to $999
- 18$1,000 to $1,249
- 7$1,500 to $1,999
- 101$2,000 or more

Median rent in 2022:
| Capewood: | $2,722 |
| San Jose: | $2,001 |
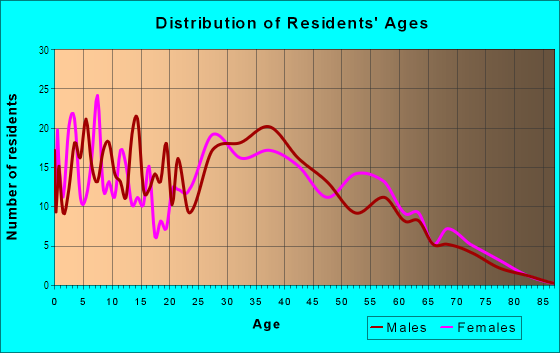
| Males: | 783 |
| Females: | 771 |
Males:
| This neighborhood: | 43.1 years |
| Whole city: | 37.6 years |
| This neighborhood: | 43.9 years |
| Whole city: | 39.1 years |
Average household size:
| Capewood: | 3.5 people |
| San Jose: | 2.9 people |
Percentage of family households:
| Capewood: | 42.3% |
| San Jose: | 49.9% |
| Here: | 65.2% |
| San Jose: | 53.0% |
Percentage of married-couple families with children (among all households):
| Capewood: | 20.4% |
| San Jose: | 25.8% |
Percentage of single-mother households (among all households):
| Capewood: | 5.1% |
| San Jose: | 5.2% |
Percentage of never married males 15 years old and over:
Percentage of never married females 15 years old and over:
| Capewood: | 16.5% |
| San Jose: | 20.9% |
Percentage of never married females 15 years old and over:
| Capewood: | 15.7% |
| city: | 16.7% |
Percentage of people that speak English not well or not at all:
| Capewood: | 362.5% |
| San Jose: | 11.4% |
Percentage of people born in this state:
Percentage of people born in another U.S. state:
Percentage of native residents but born outside the U.S.:
Percentage of foreign born residents:
| Here: | 36.8% |
| San Jose: | 46.1% |
Percentage of people born in another U.S. state:
| Capewood: | 9.7% |
| San Jose: | 10.4% |
Percentage of native residents but born outside the U.S.:
| Here: | 2.5% |
| city: | 1.7% |
Percentage of foreign born residents:
| Here: | 53.4% |
| San Jose: | 41.8% |
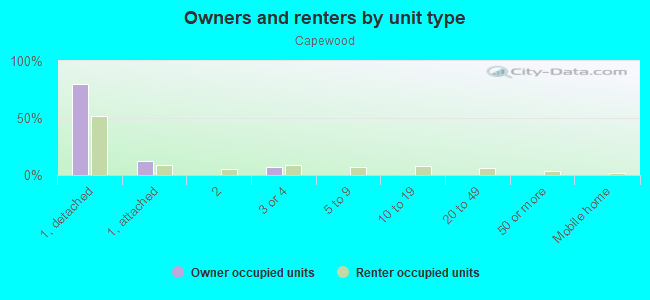
Owner-occupied
Renter-occupied

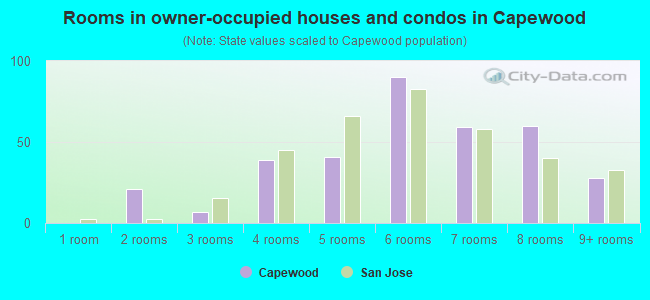
- Rooms in owner-occupied houses and condos in Capewood
- 01 room
- 212 rooms
- 73 rooms
- 394 rooms
- 415 rooms
- 906 rooms
- 597 rooms
- 608 rooms
- 289+ rooms
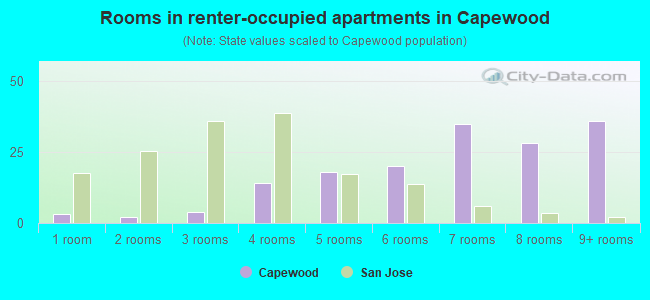
- Rooms in renter-occupied apartments in Capewood
- 31 room
- 22 rooms
- 43 rooms
- 144 rooms
- 185 rooms
- 206 rooms
- 357 rooms
- 288 rooms
- 369+ rooms
Owner-occupied
Renter-occupied
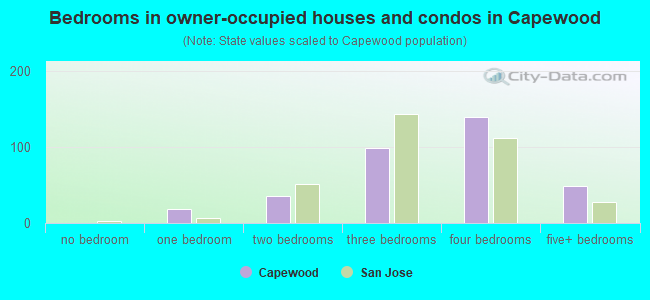
- Bedrooms in owner-occupied houses and condos in Capewood
- 0no bedroom
- 191 bedroom
- 352 bedrooms
- 993 bedrooms
- 1404 bedrooms
- 495+ bedrooms
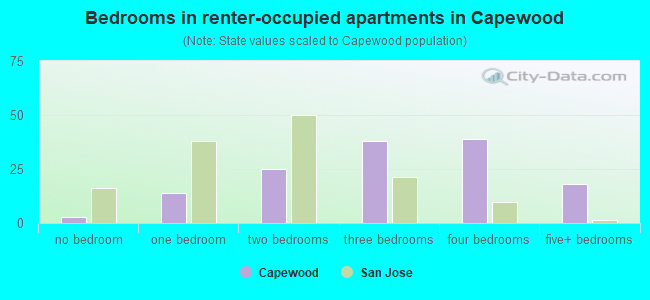
- Bedrooms in renter-occupied apartments in Capewood
- 3no bedroom
- 141 bedroom
- 252 bedrooms
- 383 bedrooms
- 394 bedrooms
- 185+ bedrooms
Average number of cars or other vehicles available in houses/condos:
Average number of cars or other vehicles available in apartments:
| This neighborhood: | 2.5 |
| San Jose: | 2.3 |
Average number of cars or other vehicles available in apartments:
| Here: | 3.0 |
| city: | 1.6 |
Percentage of units with a mortgage:
| Capewood: | 63.4% |
| San Jose: | 66.9% |
Average estimated value of detached houses in 2022 (86.6% of all units):
| Capewood: | $1,293,554 |
| San Jose: | $1,532,815 |
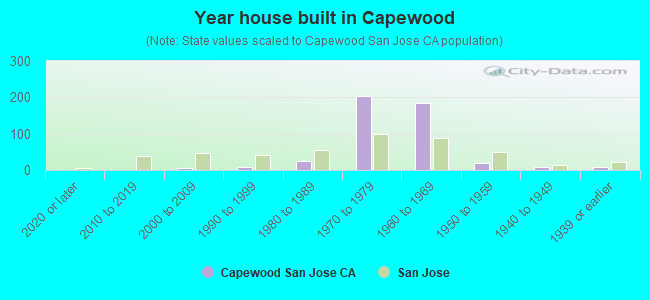
- Year house built in Capewood
- 02020 or later
- 12010 to 2019
- 62000 to 2009
- 71990 to 1999
- 251980 to 1989
- 2041970 to 1979
- 1841960 to 1969
- 201950 to 1959
- 91940 to 1949
- 81939 or earlier
City-data.com crime index for city in 2020 (higher means more crime):
| City: | 268.4 |
| U.S. average: | 219.5 |
Travel time to work (commute)
![Travel time to work (commute)]()
- 8Less than 5 minutes
- 455 to 9 minutes
- 7110 to 14 minutes
- 15215 to 19 minutes
- 11420 to 24 minutes
- 6125 to 29 minutes
- 11630 to 34 minutes
- 1435 to 39 minutes
- 1140 to 44 minutes
- 6045 to 59 minutes
- 3960 to 89 minutes
- 2290 or more minutes

Means of transportation to work
![Means of transportation to work]()
- 74.8%584Drove a car alone
- 13.1%102Carpooled
- 1.5%12Bus
- 1.3%10Subway or elevated rail
- 0.6%5Long-distance train or commuter rail
- 1.9%15Light rail, streetcar or trolley
- 0.8%6Motorcycle
- 1.5%12Walked
- 0.5%4Other means
- 8.5%66Worked at home

Time leaving home to go to work
![Time leaving home to go to work]()
- 3712:00 a.m. to 4:59 a.m.
- 175:00 a.m. to 5:29 a.m.
- 635:30 a.m. to 5:59 a.m.
- 376:00 a.m. to 6:29 a.m.
- 256:30 a.m. to 6:59 a.m.
- 537:00 a.m. to 7:29 a.m.
- 957:30 a.m. to 7:59 a.m.
- 748:00 a.m. to 8:29 a.m.
- 428:30 a.m. to 8:59 a.m.
- 429:00 a.m. to 9:59 a.m.
- 2910:00 a.m. to 10:59 a.m.
- 411:00 a.m. to 11:59 a.m.
- 8712:00 p.m. to 3:59 p.m.
- 374:00 p.m. to 11:59 p.m.

Occupations of males:
- Percentage of males in management occupations (except farmers):
Here: 9.4% city: 13.0%
- Percentage of males in business and financial operations occupations:
Here: 6.0% city: 4.6%
- Percentage of males in computer and mathematical occupations:
Here: 21.2% city: 13.6%
- Percentage of males in architecture and engineering occupations:
Here: 15.4% city: 10.2%
- Percentage of males in education, training, and library occupations:
Here: 1.1% city: 2.8%
- Percentage of males in healthcare practitioners and technical occupations:
Here: 7.1% city: 2.0%
- Percentage of males in service occupations:
Here: 6.7% city: 12.7%
- Percentage of males in sales and office occupations:
Here: 11.5% city: 12.8%
- Percentage of males in construction, extraction, and maintenance occupations:
Here: 4.1% city: 7.8%
- Percentage of males in production occupations:
Here: 4.1% city: 5.5%
- Percentage of males in transportation occupations:
Here: 4.2% city: 3.6%
- Percentage of males in material moving occupations:
Here: 3.0% city: 3.1%
Occupations of females:
- Percentage of females in management occupations (except farmers):
Here: 7.5% city: 11.0%
- Percentage of females in business and financial operations occupations:
Here: 7.6% city: 8.6%
- Percentage of females in computer and mathematical occupations:
Here: 6.4% city: 5.4%
- Percentage of females in architecture and engineering occupations:
Here: 3.3% city: 2.8%
- Percentage of females in legal occupations:
Here: 2.6% city: 1.3%
- Percentage of females in education, training, and library occupations:
Here: 7.5% city: 8.1%
- Percentage of females in arts, design, entertainment, sports, and media occupations:
Here: 1.3% city: 2.0%
- Percentage of females in healthcare practitioners and technical occupations:
Here: 6.7% city: 6.8%
- Percentage of females in service occupations:
Here: 31.3% city: 21.7%
- Percentage of females in sales and office occupations:
Here: 16.3% city: 22.0%
- Percentage of females in production occupations:
Here: 5.9% city: 4.0%
- Percentage of females in transportation occupations:
Here: 1.1% city: 0.7%
- Percentage of females in material moving occupations:
Here: 2.9% city: 1.5%
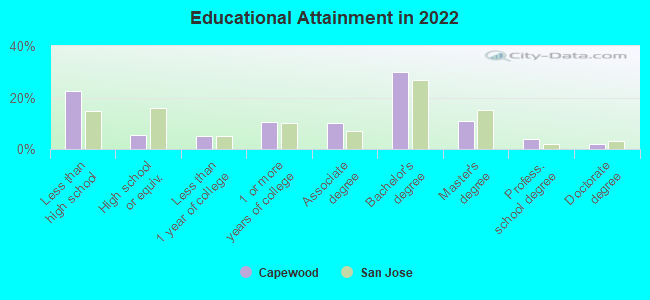
Education in this neighborhood (subdivision or community):
- Percentage of people 3 years and older in K-12 schools:
Capewood: 14.3% San Jose: 16.1%
- Percentage of people 3 years and older in undergraduate colleges:
Capewood: 6.1% San Jose: 6.5%
- Percentage of people 3 years and older in grad. or professional schools:
Capewood: 2.8% San Jose: 2.0%
- Percentage of students K-12 enrolled in private schools:
Capewood: 30.9% San Jose: 14.9%
Percentage of population below poverty level:
| Capewood: | 13.2% |
| San Jose: | 9.0% |
Median year owner moved in (as recorded in 2022):
Median year renter moved in (as recorded in 2022):
| Capewood: | 2003 |
| San Jose: | 2008 |
Median year renter moved in (as recorded in 2022):
| Capewood: | 2010 |
| San Jose: | 2020 |
Percentage of married-couple families with both working:
| Capewood: | 63.3% |
| San Jose: | 72.5% |
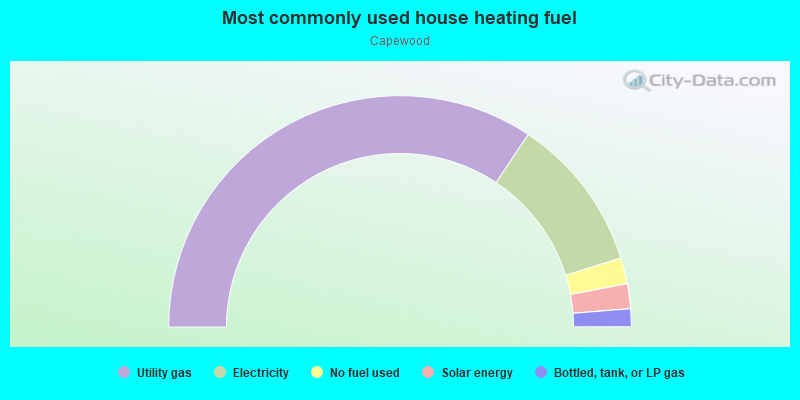
- 68.7%Utility gas
- 21.7%Electricity
- 3.6%No fuel used
- 3.5%Solar energy
- 2.5%Bottled, tank, or LP gas
Roads and streets:
Capewood Ln
Length: 0.40 miles
Directions: E-W, SW-NE
Address range: 2800 to 3099
Directions: E-W, SW-NE
Address range: 2800 to 3099
Postwood Dr
Length: 0.40 miles
Directions: E-W, SE-NW, SW-NE
Address range: 2800 to 3099
Directions: E-W, SE-NW, SW-NE
Address range: 2800 to 3099
Junewood Ave
Length: 0.38 miles
Directions: E-W, SE-NW
Address range: 1900 to 2099
Directions: E-W, SE-NW
Address range: 1900 to 2099
Amberwood Ln
Length: 0.37 miles
Directions: E-W, N-S, SE-NW, SW-NE
Address range: 2000 to 2259
Directions: E-W, N-S, SE-NW, SW-NE
Address range: 2000 to 2259
Fallwood Ln
Length: 0.31 miles
Directions: E-W, SE-NW, SW-NE
Address range: 2800 to 3099
Directions: E-W, SE-NW, SW-NE
Address range: 2800 to 3099
Meadowgate Way
Length: 0.30 miles
Directions: E-W, N-S, SE-NW, SW-NE
Address range: 2100 to 2299
Directions: E-W, N-S, SE-NW, SW-NE
Address range: 2100 to 2299
Cropley Ave
Length: 0.30 miles
Direction: SW-NE
Address range: 2900 to 3199
Direction: SW-NE
Address range: 2900 to 3199
Via Encinitas
Length: 0.30 miles
Directions: N-S, SE-NW, SW-NE
Address range: 2800 to 2999
Directions: N-S, SE-NW, SW-NE
Address range: 2800 to 2999
Via del Sol
Length: 0.29 miles
Directions: E-W, N-S, SE-NW, SW-NE
Address range: 2900 to 3099
Directions: E-W, N-S, SE-NW, SW-NE
Address range: 2900 to 3099
Morrill Ave
Length: 0.26 miles
Direction: SE-NW
Address range: 1900 to 2049
Direction: SE-NW
Address range: 1900 to 2049
Camargo Dr
Length: 0.26 miles
Directions: E-W, N-S, SE-NW
Address range: 1900 to 1999
Directions: E-W, N-S, SE-NW
Address range: 1900 to 1999
Via Montez
Length: 0.24 miles
Directions: N-S, SE-NW, SW-NE
Address range: 3000 to 3099
Directions: N-S, SE-NW, SW-NE
Address range: 3000 to 3099
Suttergate Way
Length: 0.18 miles
Directions: E-W, N-S, SE-NW, SW-NE
Address range: 2900 to 2999
Directions: E-W, N-S, SE-NW, SW-NE
Address range: 2900 to 2999
Rosario Dr
Length: 0.16 miles
Directions: E-W, N-S, SW-NE
Address range: 2800 to 2899
Directions: E-W, N-S, SW-NE
Address range: 2800 to 2899
Via del Coronado
Length: 0.16 miles
Directions: N-S, SE-NW, SW-NE
Address range: 3000 to 3099
Directions: N-S, SE-NW, SW-NE
Address range: 3000 to 3099
Kingsgate Ct
Length: 0.12 miles
Direction: SE-NW
Address range: 2800 to 2899
Direction: SE-NW
Address range: 2800 to 2899
Spanishgate Ct
Length: 0.05 miles
Direction: SE-NW
Address range: 2172 to 2199
Direction: SE-NW
Address range: 2172 to 2199
Via Encinitos Ct
Length: 0.04 miles
Directions: E-W, SW-NE
Address range: 2800 to 2899
Directions: E-W, SW-NE
Address range: 2800 to 2899
Rosario Ct
Length: 0.04 miles
Direction: E-W
Address range: 2800 to 2899
Direction: E-W
Address range: 2800 to 2899
Amberwood Ct
Length: 0.04 miles
Directions: N-S, SW-NE
Address range: 2000 to 2099
Directions: N-S, SW-NE
Address range: 2000 to 2099
Plz Montez
Length: 0.04 miles
Direction: SE-NW
Address range: 1900 to 1999
Direction: SE-NW
Address range: 1900 to 1999
Suttergate Ct
Length: 0.03 miles
Direction: SE-NW
Address range: 2100 to 2199
Direction: SE-NW
Address range: 2100 to 2199
Spanish Ct
Length: 0.03 miles
Direction: SW-NE
Address range: 2100 to 2177
Direction: SW-NE
Address range: 2100 to 2177
Juarez Ct
Length: 0.03 miles
Direction: SE-NW
Address range: 1900 to 1999
Direction: SE-NW
Address range: 1900 to 1999
Capewood Ct
Length: 0.02 miles
Direction: N-S
Address range: 2900 to 2999
Direction: N-S
Address range: 2900 to 2999
Other features:
Berryessa Crk
Length: 0.40 miles
Directions: E-W, SE-NW
Directions: E-W, SE-NW