Castle neighborhood in San Diego, California (CA), 92105 detailed profile
Settings
X

Business Search - 14 Million verified businesses
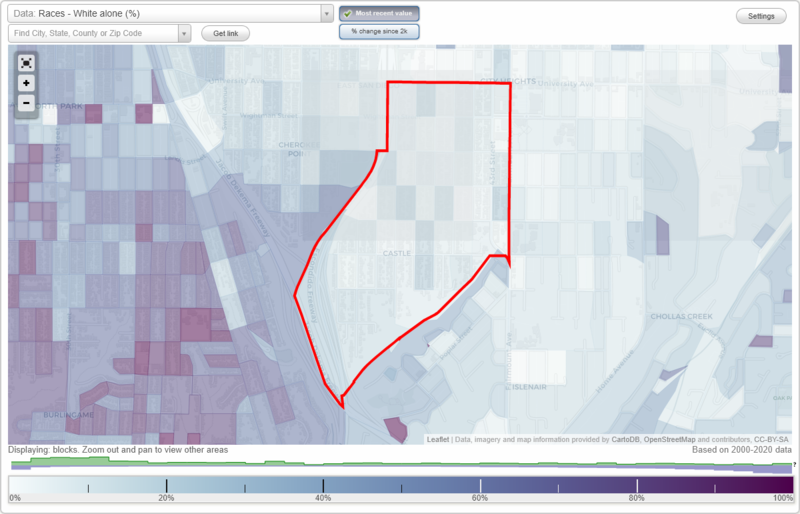
Area: 0.567 square miles
Population: 9,642
Population density:
| Castle: | 17,007 people per square mile |
| San Diego: | 4,258 people per square mile |

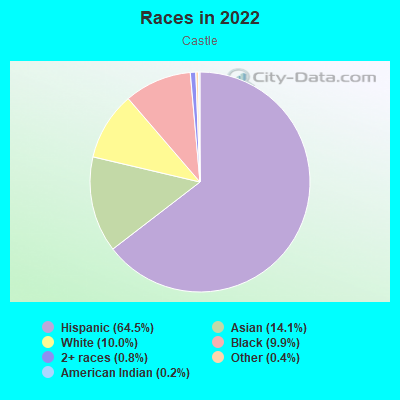
- 6,40964.5%Hispanic or Latino
- 1,39814.1%Asian
- 99610.0%White
- 9799.9%Black
- 840.8%Two or more races
- 400.4%Some other race
- 190.2%American Indian
- 60.06%Native Hawaiian and Other
Pacific Islander
Median household income in 2022:
| Castle: | $59,656 |
| San Diego: | $100,010 |
Distribution of median household income
![Distribution of median household income]()
- 126Less than $10,000
- 773$10,000 to $19,999
- 797$20,000 to $29,999
- 257$30,000 to $39,999
- 256$40,000 to $49,999
- 372$50,000 to $59,999
- 246$60,000 to $74,999
- 399$75,000 to $99,999
- 357$100,000 to $124,999
- 217$125,000 to $149,999
- 168$150,000 to $199,999
- 69$200,000 or more

Distribution of owner-occupied house/condo value
![Distribution of owner-occupied house/condo value]()
- 92Less than $50,000
- 220$50,000 to $99,999
- 71$150,000 to $199,999
- 63$200,000 to $249,999
- 71$250,000 to $299,999
- 385$300,000 to $399,999
- 254$400,000 to $499,999
- 332$500,000 to $749,999
- 78$750,000 to $999,999
- 373$1,000,000 or more

Distribution of rent paid by renters
![Distribution of rent paid by renters]()
- 33Less than $100
- 215$100 to $199
- 106$200 to $299
- 436$300 to $399
- 447$400 to $499
- 255$500 to $599
- 184$600 to $699
- 243$700 to $799
- 232$800 to $899
- 157$900 to $999
- 447$1,000 to $1,249
- 512$1,250 to $1,499
- 858$1,500 to $1,999
- 337$2,000 or more

Median rent in 2022:
| Castle: | $1,521 |
| San Diego: | $1,971 |
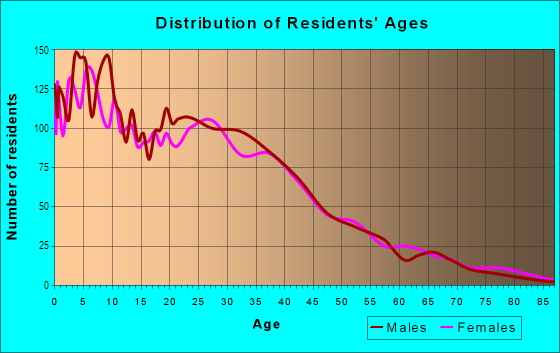
| Males: | 5,145 |
| Females: | 4,497 |
Males:
| This neighborhood: | 32.4 years |
| Whole city: | 35.4 years |
| This neighborhood: | 36.5 years |
| Whole city: | 37.2 years |
Average household size:
| Castle: | 6.2 people |
| San Diego: | 2.5 people |
Percentage of family households:
| Castle: | 49.8% |
| San Diego: | 41.7% |
| Here: | 41.6% |
| San Diego: | 43.2% |
Percentage of married-couple families with children (among all households):
| Castle: | 19.6% |
| San Diego: | 27.8% |
Percentage of single-mother households (among all households):
| Castle: | 11.7% |
| San Diego: | 7.9% |
Percentage of never married males 15 years old and over:
Percentage of never married females 15 years old and over:
| Castle: | 27.1% |
| San Diego: | 23.4% |
Percentage of never married females 15 years old and over:
| Castle: | 19.9% |
| city: | 18.8% |
Percentage of people that speak English not well or not at all:
| Castle: | 14.2% |
| San Diego: | 5.9% |
Percentage of people born in this state:
Percentage of people born in another U.S. state:
Percentage of native residents but born outside the U.S.:
Percentage of foreign born residents:
| Here: | 51.7% |
| San Diego: | 48.1% |
Percentage of people born in another U.S. state:
| Castle: | 11.2% |
| San Diego: | 24.9% |
Percentage of native residents but born outside the U.S.:
| Here: | 1.8% |
| city: | 2.4% |
Percentage of foreign born residents:
| Here: | 35.2% |
| San Diego: | 24.6% |
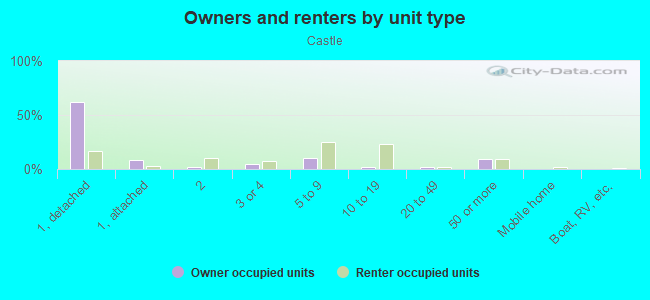
Owner-occupied
Renter-occupied

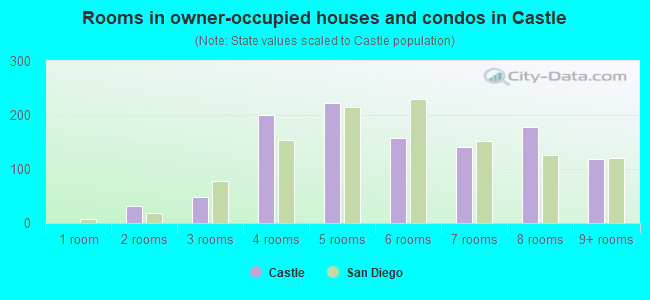
- Rooms in owner-occupied houses and condos in Castle
- 01 room
- 322 rooms
- 493 rooms
- 2004 rooms
- 2225 rooms
- 1576 rooms
- 1407 rooms
- 1788 rooms
- 1199+ rooms
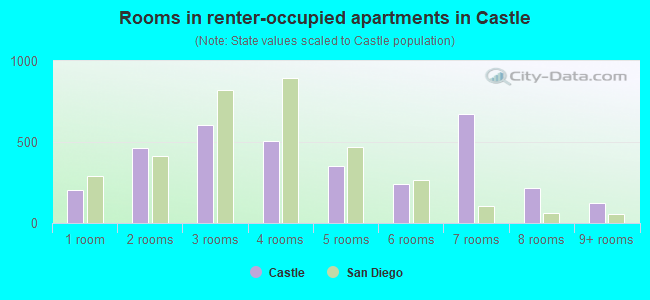
- Rooms in renter-occupied apartments in Castle
- 2011 room
- 4632 rooms
- 6073 rooms
- 5064 rooms
- 3515 rooms
- 2416 rooms
- 6717 rooms
- 2158 rooms
- 1229+ rooms
Owner-occupied
Renter-occupied
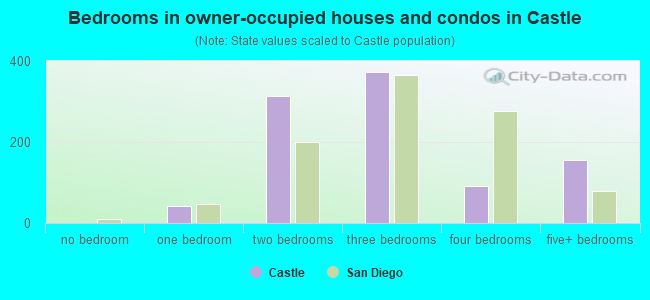
- Bedrooms in owner-occupied houses and condos in Castle
- 0no bedroom
- 421 bedroom
- 3142 bedrooms
- 3733 bedrooms
- 914 bedrooms
- 1555+ bedrooms
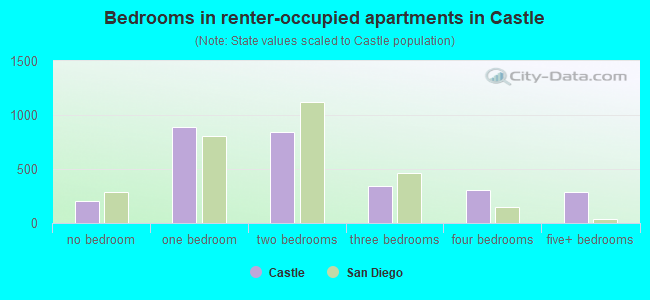
- Bedrooms in renter-occupied apartments in Castle
- 201no bedroom
- 8891 bedroom
- 8382 bedrooms
- 3423 bedrooms
- 3014 bedrooms
- 2885+ bedrooms
Average number of cars or other vehicles available in houses/condos:
Average number of cars or other vehicles available in apartments:
| This neighborhood: | 2.7 |
| San Diego: | 2.1 |
Average number of cars or other vehicles available in apartments:
| Here: | 1.2 |
| city: | 1.6 |
Percentage of units with a mortgage:
| Castle: | 77.5% |
| San Diego: | 69.2% |
Housing prices:
- Average estimated value of detached houses in 2022 (44.7% of all units):
Castle: $531,765 San Diego: $1,227,596
- Average estimated value of townhouses or other attached units in 2022 (7.2% of all units):
This neighborhood: $409,854 city: $822,615
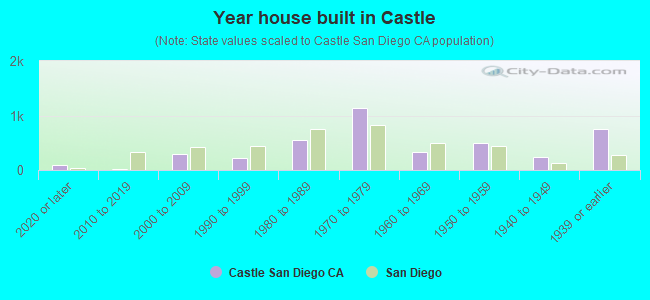
- Year house built in Castle
- 852020 or later
- 262010 to 2019
- 2902000 to 2009
- 2251990 to 1999
- 5511980 to 1989
- 1,1391970 to 1979
- 3391960 to 1969
- 5011950 to 1959
- 2341940 to 1949
- 7491939 or earlier
City-data.com crime index for city in 2020 (higher means more crime):
| City: | 197.8 |
| U.S. average: | 219.5 |
Travel time to work (commute)
![Travel time to work (commute)]()
- 12Less than 5 minutes
- 1905 to 9 minutes
- 49110 to 14 minutes
- 1,61815 to 19 minutes
- 61420 to 24 minutes
- 24025 to 29 minutes
- 62030 to 34 minutes
- 4435 to 39 minutes
- 12440 to 44 minutes
- 20245 to 59 minutes
- 39360 to 89 minutes
- 7390 or more minutes

Means of transportation to work
![Means of transportation to work]()
- 66.8%3,120Drove a car alone
- 17.4%813Carpooled
- 4.9%231Bus
- 10.8%505Taxi
- 0.3%13Bicycle
- 2.4%110Walked
- 2.3%109Other means
- 6.7%312Worked at home

Time leaving home to go to work
![Time leaving home to go to work]()
- 29012:00 a.m. to 4:59 a.m.
- 1925:00 a.m. to 5:29 a.m.
- 2745:30 a.m. to 5:59 a.m.
- 4566:00 a.m. to 6:29 a.m.
- 3216:30 a.m. to 6:59 a.m.
- 5727:00 a.m. to 7:29 a.m.
- 1997:30 a.m. to 7:59 a.m.
- 6888:00 a.m. to 8:29 a.m.
- 2698:30 a.m. to 8:59 a.m.
- 5479:00 a.m. to 9:59 a.m.
- 14510:00 a.m. to 10:59 a.m.
- 6811:00 a.m. to 11:59 a.m.
- 35012:00 p.m. to 3:59 p.m.
- 2504:00 p.m. to 11:59 p.m.

Occupations of males:
- Percentage of males in management occupations (except farmers):
Here: 5.7% city: 12.7%
- Percentage of males in computer and mathematical occupations:
Here: 2.6% city: 8.8%
- Percentage of males in community and social services occupations:
Here: 1.7% city: 1.0%
- Percentage of males in education, training, and library occupations:
Here: 2.6% city: 3.8%
- Percentage of males in arts, design, entertainment, sports, and media occupations:
Here: 1.4% city: 2.9%
- Percentage of males in healthcare practitioners and technical occupations:
Here: 1.2% city: 3.8%
- Percentage of males in service occupations:
Here: 30.6% city: 14.6%
- Percentage of males in sales and office occupations:
Here: 11.7% city: 13.9%
- Percentage of males in construction, extraction, and maintenance occupations:
Here: 18.8% city: 5.9%
- Percentage of males in production occupations:
Here: 9.6% city: 4.6%
- Percentage of males in transportation occupations:
Here: 6.4% city: 3.9%
- Percentage of males in material moving occupations:
Here: 3.3% city: 3.3%
Occupations of females:
- Percentage of females in management occupations (except farmers):
Here: 6.2% city: 10.2%
- Percentage of females in business and financial operations occupations:
Here: 4.6% city: 9.0%
- Percentage of females in education, training, and library occupations:
Here: 8.6% city: 8.2%
- Percentage of females in arts, design, entertainment, sports, and media occupations:
Here: 1.3% city: 2.9%
- Percentage of females in healthcare practitioners and technical occupations:
Here: 4.7% city: 9.7%
- Percentage of females in service occupations:
Here: 27.9% city: 19.9%
- Percentage of females in sales and office occupations:
Here: 32.7% city: 22.0%
- Percentage of females in farming, fishing, and forestry occupations:
Here: 1.5% city: 0.1%
- Percentage of females in production occupations:
Here: 4.7% city: 2.8%
- Percentage of females in material moving occupations:
Here: 5.1% city: 1.5%
Percentage of people 16-64 in Armed Forces:
| Castle: | 0.9% |
| San Diego: | 4.0% |
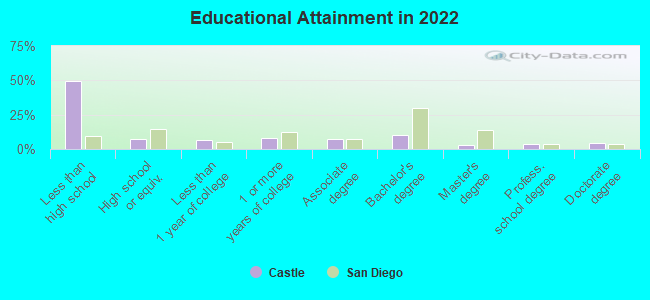
Education in this neighborhood (subdivision or community):
- Percentage of people 3 years and older in K-12 schools:
Castle: 28.3% San Diego: 13.8%
- Percentage of people 3 years and older in undergraduate colleges:
Castle: 8.3% San Diego: 8.5%
- Percentage of people 3 years and older in grad. or professional schools:
Castle: 4.2% San Diego: 2.3%
- Percentage of students K-12 enrolled in private schools:
Castle: 14.1% San Diego: 13.6%
Percentage of population below poverty level:
| Castle: | 25.3% |
| San Diego: | 11.3% |
Median year renter moved in (as recorded in 2022):
| Castle: | 2015 |
| San Diego: | 2020 |
Percentage of married-couple families with both working:
| Castle: | 58.4% |
| San Diego: | 66.0% |
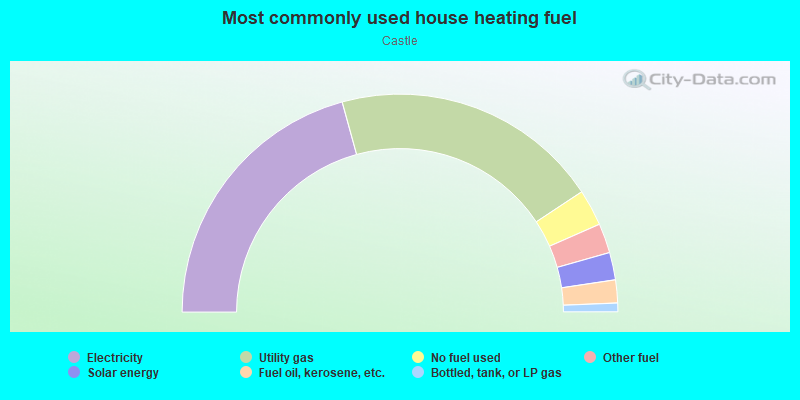
- 41.5%Electricity
- 40.0%Utility gas
- 5.4%No fuel used
- 4.4%Other fuel
- 4.1%Solar energy
- 3.4%Fuel oil, kerosene, etc.
- 1.3%Bottled, tank, or LP gas
Limited-access highways (interstate or state) in this neighborhood:
I- 15 (Escondido Fwy)
Length: 1.43 miles
Directions: N-S, SE-NW, SW-NE
Directions: N-S, SE-NW, SW-NE
Jacob Dekema Fwy (I- 805)
Length: 0.13 miles
Directions: N-S, SE-NW
Directions: N-S, SE-NW
Roads and streets:
Central Ave
Length: 0.93 miles
Direction: N-S
Address range: 3000 to 3999
Direction: N-S
Address range: 3000 to 3999
Lexington Ave
Length: 0.79 miles
Directions: E-W, SW-NE
Directions: E-W, SW-NE
41st St
Length: 0.78 miles
Direction: N-S
Address range: 3000 to 3799
Direction: N-S
Address range: 3000 to 3799
Thorn St
Length: 0.77 miles
Direction: E-W
Address range: 3700 to 4299
Direction: E-W
Address range: 3700 to 4299
Marlborough Ave
Length: 0.74 miles
Direction: N-S
Address range: 3000 to 3799
Direction: N-S
Address range: 3000 to 3799
Myrtle Ave
Length: 0.67 miles
Directions: E-W, N-S
Address range: 3900 to 4349
Directions: E-W, N-S
Address range: 3900 to 4349
43rd St
Length: 0.65 miles
Directions: N-S, SE-NW
Address range: 3300 to 3959
Directions: N-S, SE-NW
Address range: 3300 to 3959
42nd St
Length: 0.65 miles
Direction: N-S
Address range: 3000 to 3799
Direction: N-S
Address range: 3000 to 3799
40th St
Length: 0.63 miles
Direction: N-S
Address range: 2900 to 3599
Direction: N-S
Address range: 2900 to 3599
39th St
Length: 0.61 miles
Direction: N-S
Address range: 2800 to 3599
Direction: N-S
Address range: 2800 to 3599
Van Dyke Ave
Length: 0.60 miles
Direction: N-S
Address range: 3100 to 3799
Direction: N-S
Address range: 3100 to 3799
Dwight St
Length: 0.59 miles
Direction: E-W
Address range: 4000 to 4331
Direction: E-W
Address range: 4000 to 4331
Redwood St
Length: 0.58 miles
Direction: E-W
Address range: 3800 to 4199
Direction: E-W
Address range: 3800 to 4199
Wightman St
Length: 0.53 miles
Direction: E-W
Address range: 4024 to 4349
Direction: E-W
Address range: 4024 to 4349
Fairmount Ave
Length: 0.52 miles
Direction: N-S
Address range: 3300 to 3799
Direction: N-S
Address range: 3300 to 3799
Landis St
Length: 0.50 miles
Direction: E-W
Address range: 4050 to 4349
Direction: E-W
Address range: 4050 to 4349
Quince St
Length: 0.34 miles
Directions: E-W, N-S, SE-NW
Address range: 3800 to 4029
Directions: E-W, N-S, SE-NW
Address range: 3800 to 4029
38th St
Length: 0.31 miles
Directions: N-S, SW-NE
Address range: 2900 to 3399
Directions: N-S, SW-NE
Address range: 2900 to 3399
Lexington St
Length: 0.05 miles
Direction: SW-NE
Address range: 4200 to 4299
Direction: SW-NE
Address range: 4200 to 4299
Spokane Ave
Length: 0.03 miles
Direction: SW-NE
Direction: SW-NE
Phlox St
Length: 0.01 miles
Direction: SE-NW
Direction: SE-NW