Central Industrial District neighborhood in Kansas City, Kansas (KS), 66118 detailed profile
Settings
X

Business Search - 14 Million verified businesses
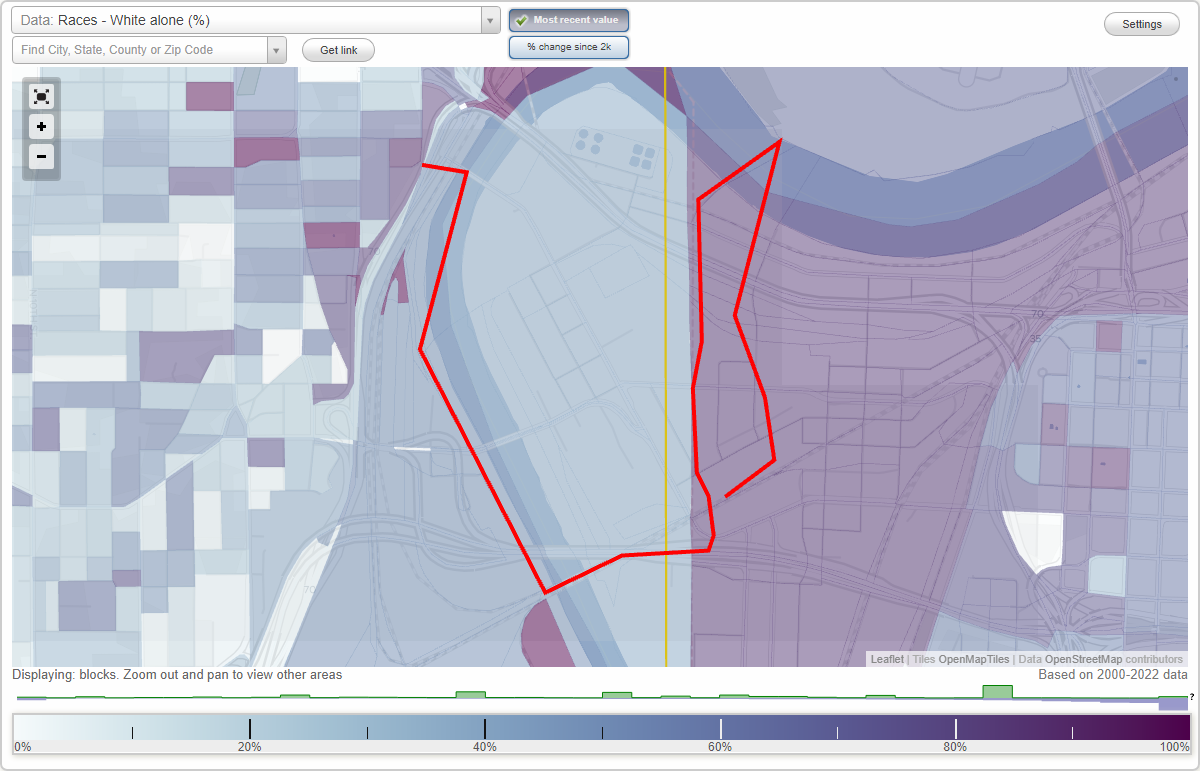
Area: 0.586 square miles
Population: 4,102
Population density:
| Central Industrial District: | 7,001 people per square mile |
| Kansas City: | 1,228 people per square mile |

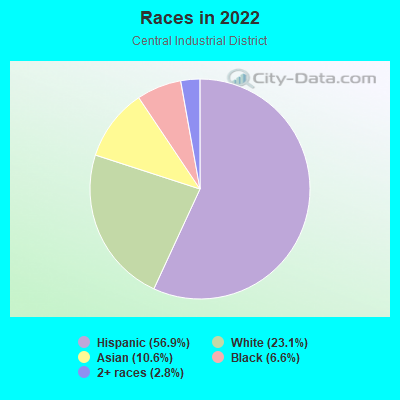
- 2,33156.9%Hispanic or Latino
- 94923.1%White
- 43310.6%Asian
- 2716.6%Black
- 1162.8%Two or more races
Median household income in 2022:
| Central Industrial District: | $73,896 |
| Kansas City: | $58,233 |
Distribution of median household income
![Distribution of median household income]()
- 6Less than $10,000
- 49$10,000 to $19,999
- 59$20,000 to $29,999
- 80$30,000 to $39,999
- 200$40,000 to $49,999
- 155$50,000 to $59,999
- 468$60,000 to $74,999
- 152$75,000 to $99,999
- 283$100,000 to $124,999
- 59$125,000 to $149,999
- 13$150,000 to $199,999

Distribution of owner-occupied house/condo value
![Distribution of owner-occupied house/condo value]()
- 84Less than $50,000
- 161$50,000 to $99,999
- 169$100,000 to $149,999
- 142$150,000 to $199,999
- 93$200,000 to $249,999
- 28$250,000 to $299,999

Distribution of rent paid by renters
![Distribution of rent paid by renters]()
- 14$300 to $399
- 48$500 to $599
- 183$600 to $699
- 86$700 to $799
- 128$800 to $899
- 28$900 to $999
- 313$1,000 to $1,249
- 35$1,250 to $1,499
- 111$1,500 to $1,999
- 10$2,000 or more

Median rent in 2022:
| Central Industrial District: | $1,090 |
| Kansas City: | $797 |
Zip codes: 66118.
| Males: | 1,974 |
| Females: | 2,128 |
Males:
| This neighborhood: | 32.1 years |
| Whole city: | 33.8 years |
| This neighborhood: | 34.4 years |
| Whole city: | 35.4 years |
Average household size:
| Central Industrial District: | 3.0 people |
| Kansas City: | 2.6 people |
Percentage of family households:
| Central Industrial District: | 49.3% |
| Kansas City: | 46.3% |
| Here: | 33.7% |
| Kansas City: | 36.4% |
Percentage of married-couple families with children (among all households):
| Central Industrial District: | 28.5% |
| Kansas City: | 21.3% |
Percentage of single-mother households (among all households):
| Central Industrial District: | 3.8% |
| Kansas City: | 11.5% |
Percentage of never married males 15 years old and over:
Percentage of never married females 15 years old and over:
| Central Industrial District: | 22.6% |
| Kansas City: | 21.9% |
Percentage of never married females 15 years old and over:
| Central Industrial District: | 26.2% |
| city: | 19.6% |
Percentage of people that speak English not well or not at all:
| Central Industrial District: | 0.0% |
| Kansas City: | 8.4% |
Percentage of people born in this state:
Percentage of people born in another U.S. state:
Percentage of native residents but born outside the U.S.:
Percentage of foreign born residents:
| Here: | 39.8% |
| Kansas City: | 53.9% |
Percentage of people born in another U.S. state:
| Central Industrial District: | 31.9% |
| Kansas City: | 28.8% |
Percentage of native residents but born outside the U.S.:
| Here: | 3.9% |
| city: | 1.1% |
Percentage of foreign born residents:
| Here: | 24.3% |
| Kansas City: | 16.3% |
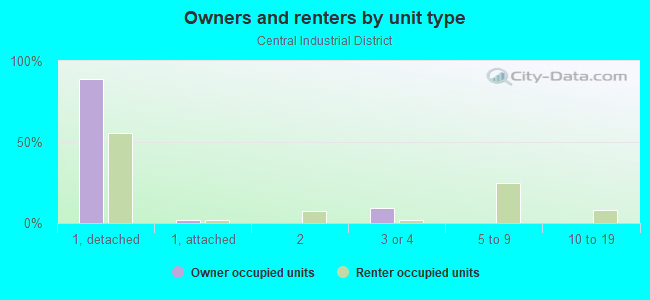
Owner-occupied
Renter-occupied

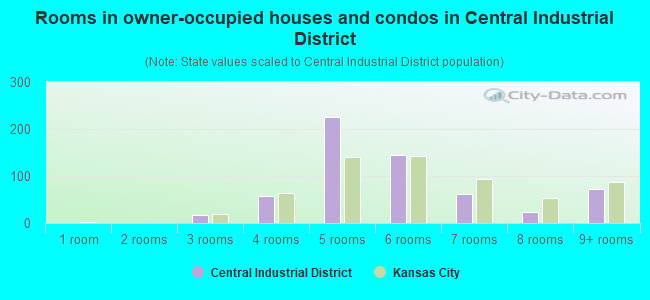
- Rooms in owner-occupied houses and condos in Central Industrial District
- 01 room
- 02 rooms
- 183 rooms
- 584 rooms
- 2265 rooms
- 1446 rooms
- 617 rooms
- 248 rooms
- 729+ rooms
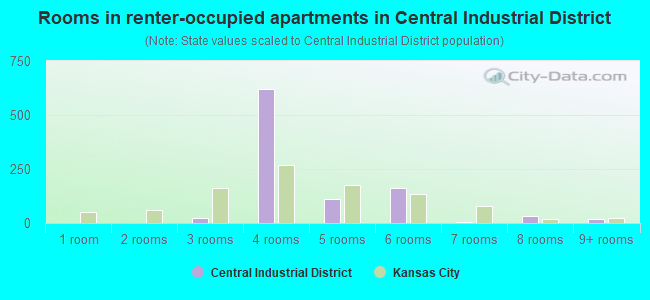
- Rooms in renter-occupied apartments in Central Industrial District
- 01 room
- 02 rooms
- 233 rooms
- 6194 rooms
- 1135 rooms
- 1616 rooms
- 37 rooms
- 328 rooms
- 179+ rooms
Owner-occupied
Renter-occupied
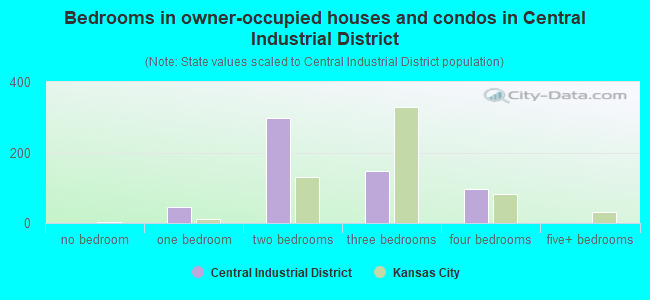
- Bedrooms in owner-occupied houses and condos in Central Industrial District
- 0no bedroom
- 441 bedroom
- 2992 bedrooms
- 1473 bedrooms
- 964 bedrooms
- 05+ bedrooms
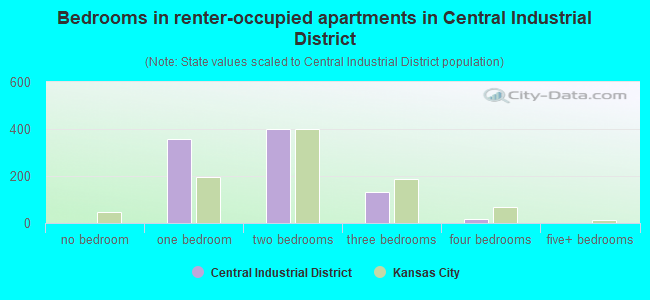
- Bedrooms in renter-occupied apartments in Central Industrial District
- 0no bedroom
- 3571 bedroom
- 4022 bedrooms
- 1343 bedrooms
- 174 bedrooms
- 05+ bedrooms
Average number of cars or other vehicles available in houses/condos:
Average number of cars or other vehicles available in apartments:
| This neighborhood: | 2.4 |
| Kansas City: | 2.2 |
Average number of cars or other vehicles available in apartments:
| Here: | 1.3 |
| city: | 1.4 |
Percentage of units with a mortgage:
| Central Industrial District: | 56.1% |
| Kansas City: | 55.3% |
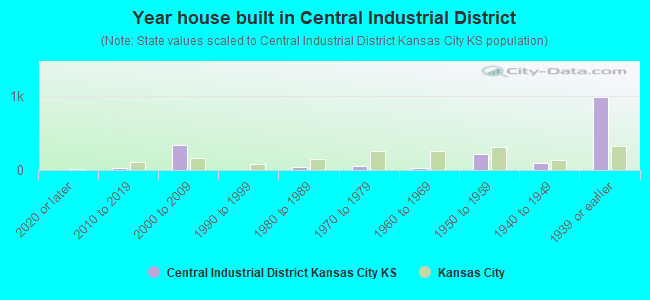
- Year house built in Central Industrial District
- 02020 or later
- 212010 to 2019
- 3372000 to 2009
- 01990 to 1999
- 441980 to 1989
- 551970 to 1979
- 241960 to 1969
- 2161950 to 1959
- 991940 to 1949
- 9801939 or earlier
City-data.com crime index for city in 2015 (higher means more crime):
| City: | 553.9 |
| U.S. average: | 243.4 |
Travel time to work (commute)
![Travel time to work (commute)]()
- 91Less than 5 minutes
- 1775 to 9 minutes
- 21010 to 14 minutes
- 40515 to 19 minutes
- 4520 to 24 minutes
- 13125 to 29 minutes
- 28130 to 34 minutes
- 935 to 39 minutes
- 17140 to 44 minutes
- 13745 to 59 minutes

Means of transportation to work
![Means of transportation to work]()
- 87.3%1,925Drove a car alone
- 9.3%206Carpooled
- 0.1%3Bus
- 0.7%16Taxi
- 1.3%29Bicycle
- 2.2%49Walked
- 3.1%68Worked at home

Time leaving home to go to work
![Time leaving home to go to work]()
- 5412:00 a.m. to 4:59 a.m.
- 845:00 a.m. to 5:29 a.m.
- 1076:00 a.m. to 6:29 a.m.
- 2466:30 a.m. to 6:59 a.m.
- 2857:00 a.m. to 7:29 a.m.
- 1357:30 a.m. to 7:59 a.m.
- 1248:00 a.m. to 8:29 a.m.
- 658:30 a.m. to 8:59 a.m.
- 1489:00 a.m. to 9:59 a.m.
- 9810:00 a.m. to 10:59 a.m.
- 14912:00 p.m. to 3:59 p.m.
- 1074:00 p.m. to 11:59 p.m.

Occupations of males:
- Percentage of males in management occupations (except farmers):
Here: 3.4% city: 7.1%
- Percentage of males in business and financial operations occupations:
Here: 2.9% city: 2.4%
- Percentage of males in computer and mathematical occupations:
Here: 1.8% city: 3.3%
- Percentage of males in community and social services occupations:
Here: 3.9% city: 1.3%
- Percentage of males in education, training, and library occupations:
Here: 4.2% city: 2.0%
- Percentage of males in arts, design, entertainment, sports, and media occupations:
Here: 2.2% city: 0.4%
- Percentage of males in healthcare practitioners and technical occupations:
Here: 8.4% city: 2.1%
- Percentage of males in service occupations:
Here: 9.7% city: 14.6%
- Percentage of males in sales and office occupations:
Here: 1.8% city: 10.9%
- Percentage of males in construction, extraction, and maintenance occupations:
Here: 15.3% city: 15.4%
- Percentage of males in production occupations:
Here: 9.7% city: 11.9%
- Percentage of males in transportation occupations:
Here: 5.8% city: 6.8%
- Percentage of males in material moving occupations:
Here: 4.5% city: 12.2%
Occupations of females:
- Percentage of females in management occupations (except farmers):
Here: 3.1% city: 6.8%
- Percentage of females in business and financial operations occupations:
Here: 1.5% city: 5.3%
- Percentage of females in computer and mathematical occupations:
Here: 2.6% city: 1.4%
- Percentage of females in architecture and engineering occupations:
Here: 25.3% city: 0.7%
- Percentage of females in life, physical, and social science occupations:
Here: 2.0% city: 1.0%
- Percentage of females in community and social services occupations:
Here: 6.1% city: 2.3%
- Percentage of females in education, training, and library occupations:
Here: 7.7% city: 7.0%
- Percentage of females in healthcare practitioners and technical occupations:
Here: 12.6% city: 6.3%
- Percentage of females in service occupations:
Here: 13.4% city: 22.4%
- Percentage of females in sales and office occupations:
Here: 11.1% city: 28.6%
- Percentage of females in production occupations:
Here: 10.0% city: 7.5%
- Percentage of females in material moving occupations:
Here: 9.2% city: 5.5%
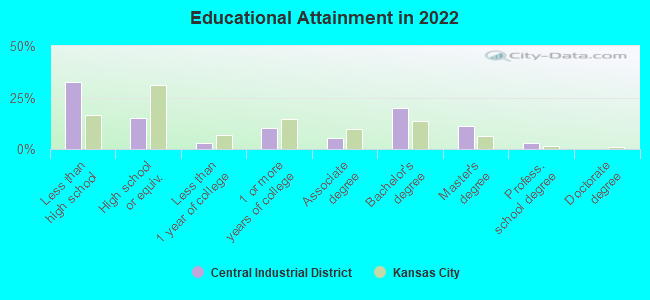
Education in this neighborhood (subdivision or community):
- Percentage of people 3 years and older in K-12 schools:
Central Industrial District: 24.3% Kansas City: 20.0%
- Percentage of people 3 years and older in undergraduate colleges:
Central Industrial District: 4.2% Kansas City: 3.8%
- Percentage of people 3 years and older in grad. or professional schools:
Central Industrial District: 0.4% Kansas City: 2.1%
- Percentage of students K-12 enrolled in private schools:
Central Industrial District: 17.4% Kansas City: 12.7%
Percentage of population below poverty level:
| Central Industrial District: | 8.1% |
| Kansas City: | 14.3% |
Median year owner moved in (as recorded in 2022):
Median year renter moved in (as recorded in 2022):
| Central Industrial District: | 2174 |
| Kansas City: | 2010 |
Median year renter moved in (as recorded in 2022):
| Central Industrial District: | 2178 |
| Kansas City: | 2019 |
Percentage of married-couple families with both working:
| Central Industrial District: | 61.4% |
| Kansas City: | 69.9% |
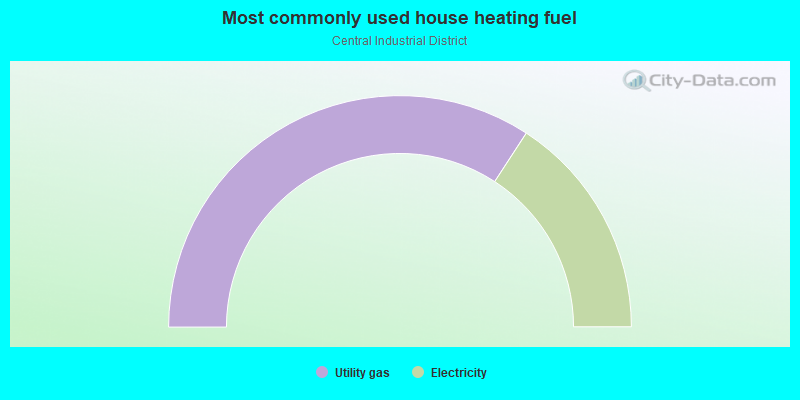
- 68.4%Utility gas
- 31.6%Electricity
Limited-access highways (interstate or state) in this neighborhood:
US Hwy 169 (US Hwy 40, Eisenhower Memorial Hwy, I- 70)
Length: 1.19 miles
Directions: E-W, SE-NW
Directions: E-W, SE-NW
I- 670
Length: 0.74 miles
Direction: E-W
Direction: E-W
Roads and streets:
Levee Rd
Length: 1.38 miles
Directions: E-W, N-S, SE-NW, SW-NE
Directions: E-W, N-S, SE-NW, SW-NE
Central Ave Viaduct Brg
Length: 1.06 miles
Directions: E-W, N-S, SE-NW, SW-NE
Directions: E-W, N-S, SE-NW, SW-NE
N James St
Length: 0.76 miles
Directions: E-W, SE-NW
Address range: 1 to 699
Directions: E-W, SE-NW
Address range: 1 to 699
Old Hwy 32 (Central Ave)
Length: 0.64 miles
Directions: E-W, SW-NE
Address range: 1 to 323
Directions: E-W, SW-NE
Address range: 1 to 323
1st St (N 1 St)
Length: 0.43 miles
Direction: SE-NW
Address range: 1 to 399
Direction: SE-NW
Address range: 1 to 399
Ohio Ave
Length: 0.42 miles
Directions: E-W, N-S, SE-NW, SW-NE
Address range: 1 to 299
Directions: E-W, N-S, SE-NW, SW-NE
Address range: 1 to 299
S James St
Length: 0.36 miles
Direction: SE-NW
Address range: 1 to 399
Direction: SE-NW
Address range: 1 to 399
Market St
Length: 0.36 miles
Directions: E-W, N-S
Address range: 1 to 99
Directions: E-W, N-S
Address range: 1 to 99
Lyon Ave
Length: 0.33 miles
Directions: E-W, SW-NE
Address range: 1 to 299
Directions: E-W, SW-NE
Address range: 1 to 299
State Line Rd (State Line Rd, State Line Road, State Line Road)
Length: 0.29 miles
Direction: N-S
Address range: 801 to 999
Direction: N-S
Address range: 801 to 999
N 2nd St
Length: 0.25 miles
Direction: SE-NW
Address range: 100 to 399
Direction: SE-NW
Address range: 100 to 399
S Ewing St
Length: 0.22 miles
Direction: SE-NW
Address range: 1 to 199
Direction: SE-NW
Address range: 1 to 199
Woodswether Rd
Length: 0.17 miles
Direction: E-W
Address range: 1 to 30
Direction: E-W
Address range: 1 to 30
Riverview Ave
Length: 0.15 miles
Directions: E-W, SW-NE
Address range: 100 to 299
Directions: E-W, SW-NE
Address range: 100 to 299
S 1st St
Length: 0.12 miles
Direction: SE-NW
Direction: SE-NW
S Water St
Length: 0.09 miles
Direction: SE-NW
Address range: 1 to 99
Direction: SE-NW
Address range: 1 to 99
S 1st St (S 1 St)
Length: 0.09 miles
Direction: SE-NW
Address range: 1 to 299
Direction: SE-NW
Address range: 1 to 299
N 2nd St (N 2 St)
Length: 0.08 miles
Direction: SE-NW
Address range: 1 to 99
Direction: SE-NW
Address range: 1 to 99
N Water St
Length: 0.08 miles
Direction: SE-NW
Address range: 1 to 99
Direction: SE-NW
Address range: 1 to 99
Reynolds Ave
Length: 0.08 miles
Direction: E-W
Direction: E-W
Bunker Ave
Length: 0.07 miles
Direction: SW-NE
Address range: 1 to 99
Direction: SW-NE
Address range: 1 to 99
S 2nd St (S 2 St)
Length: 0.04 miles
Direction: SE-NW
Address range: 1 to 99
Direction: SE-NW
Address range: 1 to 99
Railroad features:
Union Pacific RR
Length: 3.93 miles
Directions: E-W, N-S, SE-NW, SW-NE
Directions: E-W, N-S, SE-NW, SW-NE
Kansas City Southern RR
Length: 0.49 miles
Directions: E-W, SE-NW, SW-NE
Directions: E-W, SE-NW, SW-NE
Missouri Pacific RR
Length: 0.34 miles
Direction: SW-NE
Direction: SW-NE
Chicago North Western RR
Length: 0.12 miles
Directions: E-W, SE-NW
Directions: E-W, SE-NW
Kansas City Southern Rlwy
Length: 0.10 miles
Direction: SW-NE
Direction: SW-NE