Cinderella neighborhood in San Jose, California (CA), 95116 detailed profile
Settings
X

Business Search - 14 Million verified businesses
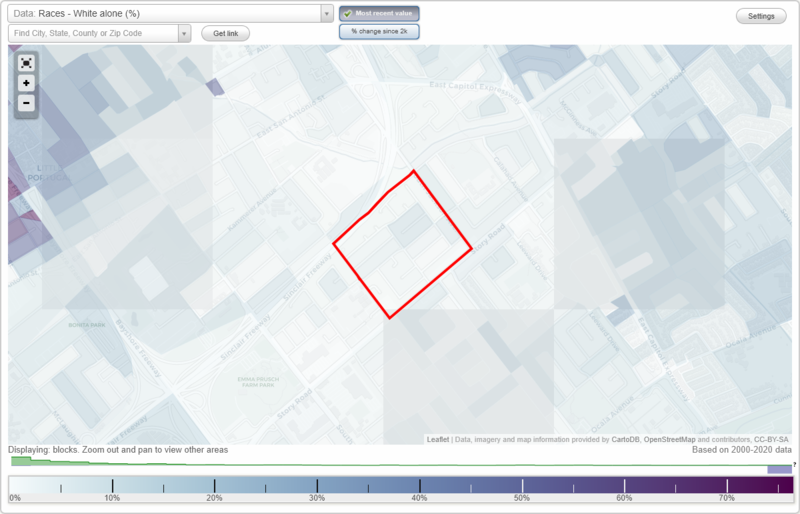
Area: 0.128 square miles
Population: 1,926
Population density:
| Cinderella: | 15,014 people per square mile |
| San Jose: | 5,554 people per square mile |

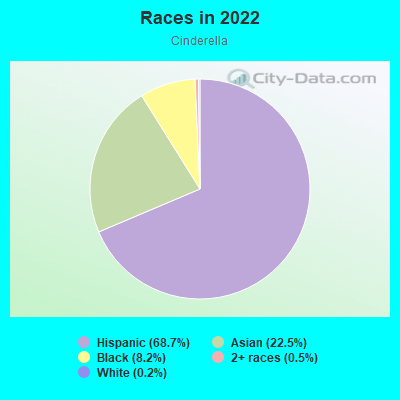
- 1,38768.7%Hispanic or Latino
- 45422.5%Asian
- 1658.2%Black
- 100.5%Two or more races
- 40.2%White
Distribution of median household income
![Distribution of median household income]()
- 18Less than $10,000
- 32$10,000 to $19,999
- 30$20,000 to $29,999
- 26$30,000 to $39,999
- 71$40,000 to $49,999
- 12$50,000 to $59,999
- 68$60,000 to $74,999
- 68$75,000 to $99,999
- 71$100,000 to $124,999
- 39$125,000 to $149,999
- 60$150,000 to $199,999
- 47$200,000 or more

Distribution of owner-occupied house/condo value
![Distribution of owner-occupied house/condo value]()
- 5Less than $50,000
- 2$50,000 to $99,999
- 7$100,000 to $149,999
- 6$200,000 to $249,999
- 7$300,000 to $399,999
- 7$400,000 to $499,999
- 28$500,000 to $749,999
- 157$750,000 to $999,999
- 19$1,000,000 or more

Distribution of rent paid by renters
![Distribution of rent paid by renters]()
- 8$300 to $399
- 12$400 to $499
- 3$500 to $599
- 5$600 to $699
- 11$900 to $999
- 23$1,000 to $1,249
- 19$1,250 to $1,499
- 106$1,500 to $1,999
- 77$2,000 or more

Median rent in 2022:
| Cinderella: | $1,848 |
| San Jose: | $2,001 |
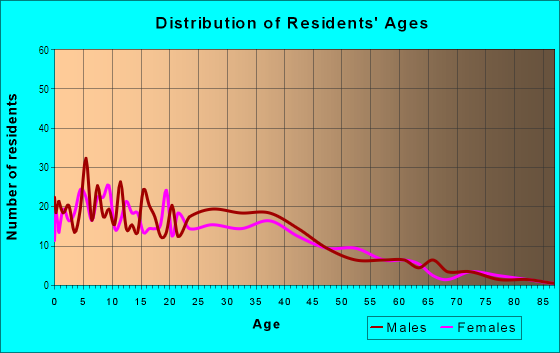
| Males: | 1,020 |
| Females: | 905 |
Males:
| This neighborhood: | 29.9 years |
| Whole city: | 37.6 years |
| This neighborhood: | 34.8 years |
| Whole city: | 39.1 years |
Average household size:
| Cinderella: | 5.2 people |
| San Jose: | 2.9 people |
Percentage of family households:
| Cinderella: | 59.1% |
| San Jose: | 49.9% |
| Here: | 40.7% |
| San Jose: | 53.0% |
Percentage of married-couple families with children (among all households):
| Cinderella: | 13.0% |
| San Jose: | 25.8% |
Percentage of single-mother households (among all households):
| Cinderella: | 7.7% |
| San Jose: | 5.2% |
Percentage of never married males 15 years old and over:
Percentage of never married females 15 years old and over:
| Cinderella: | 27.6% |
| San Jose: | 20.9% |
Percentage of never married females 15 years old and over:
| Cinderella: | 18.3% |
| city: | 16.7% |
Percentage of people that speak English not well or not at all:
| Cinderella: | 27.9% |
| San Jose: | 11.4% |
Percentage of people born in this state:
Percentage of people born in another U.S. state:
Percentage of native residents but born outside the U.S.:
Percentage of foreign born residents:
| Here: | 39.9% |
| San Jose: | 46.1% |
Percentage of people born in another U.S. state:
| Cinderella: | 4.1% |
| San Jose: | 10.4% |
Percentage of native residents but born outside the U.S.:
| Here: | 1.6% |
| city: | 1.7% |
Percentage of foreign born residents:
| Here: | 54.4% |
| San Jose: | 41.8% |
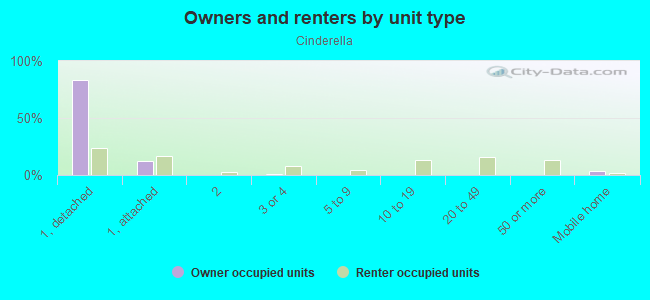
Owner-occupied
Renter-occupied

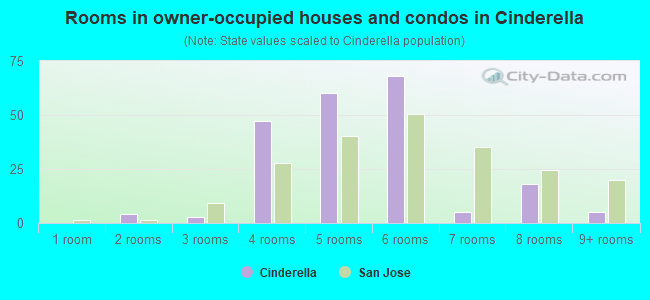
- Rooms in owner-occupied houses and condos in Cinderella
- 01 room
- 42 rooms
- 33 rooms
- 474 rooms
- 605 rooms
- 686 rooms
- 57 rooms
- 188 rooms
- 59+ rooms
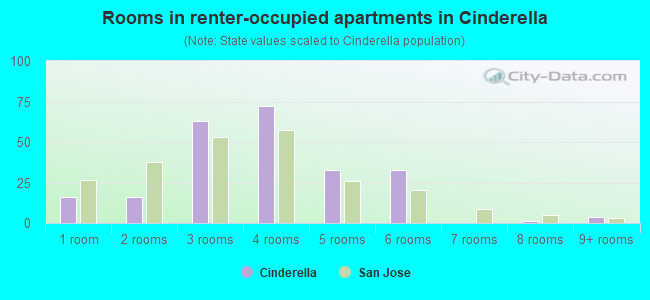
- Rooms in renter-occupied apartments in Cinderella
- 161 room
- 162 rooms
- 633 rooms
- 724 rooms
- 335 rooms
- 336 rooms
- 07 rooms
- 18 rooms
- 49+ rooms
Owner-occupied
Renter-occupied
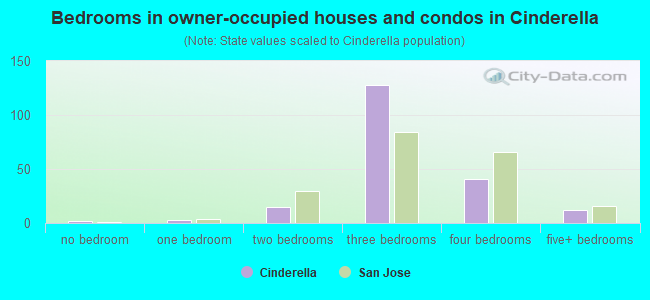
- Bedrooms in owner-occupied houses and condos in Cinderella
- 2no bedroom
- 31 bedroom
- 152 bedrooms
- 1283 bedrooms
- 414 bedrooms
- 125+ bedrooms
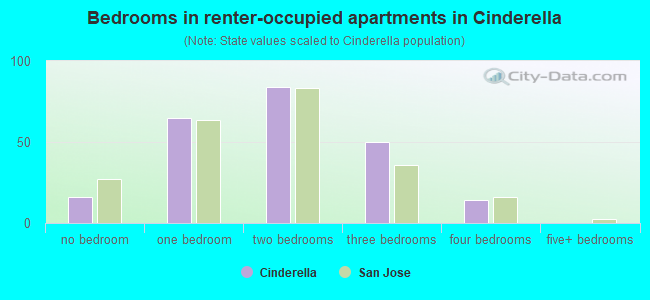
- Bedrooms in renter-occupied apartments in Cinderella
- 16no bedroom
- 651 bedroom
- 842 bedrooms
- 503 bedrooms
- 144 bedrooms
- 05+ bedrooms
Average number of cars or other vehicles available in houses/condos:
Average number of cars or other vehicles available in apartments:
| This neighborhood: | 2.8 |
| San Jose: | 2.3 |
Average number of cars or other vehicles available in apartments:
| Here: | 2.1 |
| city: | 1.6 |
Percentage of units with a mortgage:
| Cinderella: | 76.6% |
| San Jose: | 66.9% |
Average estimated value of detached houses in 2022 (55.5% of all units):
| Cinderella: | $768,617 |
| San Jose: | $1,532,815 |
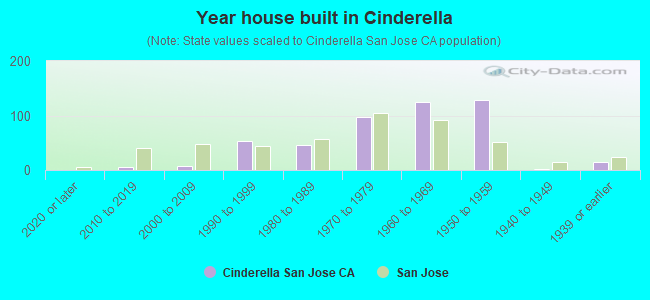
- Year house built in Cinderella
- 02020 or later
- 52010 to 2019
- 82000 to 2009
- 531990 to 1999
- 461980 to 1989
- 981970 to 1979
- 1241960 to 1969
- 1291950 to 1959
- 11940 to 1949
- 151939 or earlier
City-data.com crime index for city in 2020 (higher means more crime):
| City: | 268.4 |
| U.S. average: | 219.5 |
Travel time to work (commute)
![Travel time to work (commute)]()
- 7Less than 5 minutes
- 95 to 9 minutes
- 5110 to 14 minutes
- 6815 to 19 minutes
- 12420 to 24 minutes
- 2925 to 29 minutes
- 9330 to 34 minutes
- 235 to 39 minutes
- 1940 to 44 minutes
- 7545 to 59 minutes
- 3160 to 89 minutes
- 1490 or more minutes

Means of transportation to work
![Means of transportation to work]()
- 76.8%757Drove a car alone
- 14.5%143Carpooled
- 2.4%24Bus
- 0.7%7Taxi
- 1.7%17Other means
- 4.1%40Worked at home

Time leaving home to go to work
![Time leaving home to go to work]()
- 2012:00 a.m. to 4:59 a.m.
- 235:00 a.m. to 5:29 a.m.
- 425:30 a.m. to 5:59 a.m.
- 506:00 a.m. to 6:29 a.m.
- 336:30 a.m. to 6:59 a.m.
- 537:00 a.m. to 7:29 a.m.
- 427:30 a.m. to 7:59 a.m.
- 438:00 a.m. to 8:29 a.m.
- 538:30 a.m. to 8:59 a.m.
- 339:00 a.m. to 9:59 a.m.
- 2610:00 a.m. to 10:59 a.m.
- 411:00 a.m. to 11:59 a.m.
- 5412:00 p.m. to 3:59 p.m.
- 124:00 p.m. to 11:59 p.m.

Occupations of males:
- Percentage of males in management occupations (except farmers):
Here: 1.2% city: 13.0%
- Percentage of males in computer and mathematical occupations:
Here: 2.8% city: 13.6%
- Percentage of males in service occupations:
Here: 32.9% city: 12.7%
- Percentage of males in sales and office occupations:
Here: 14.8% city: 12.8%
- Percentage of males in construction, extraction, and maintenance occupations:
Here: 24.8% city: 7.8%
- Percentage of males in production occupations:
Here: 10.2% city: 5.5%
- Percentage of males in transportation occupations:
Here: 2.3% city: 3.6%
- Percentage of males in material moving occupations:
Here: 4.0% city: 3.1%
Occupations of females:
- Percentage of females in management occupations (except farmers):
Here: 2.8% city: 11.0%
- Percentage of females in business and financial operations occupations:
Here: 4.3% city: 8.6%
- Percentage of females in computer and mathematical occupations:
Here: 1.1% city: 5.4%
- Percentage of females in architecture and engineering occupations:
Here: 1.0% city: 2.8%
- Percentage of females in community and social services occupations:
Here: 4.0% city: 1.8%
- Percentage of females in education, training, and library occupations:
Here: 1.0% city: 8.1%
- Percentage of females in healthcare practitioners and technical occupations:
Here: 3.8% city: 6.8%
- Percentage of females in service occupations:
Here: 49.6% city: 21.7%
- Percentage of females in sales and office occupations:
Here: 21.0% city: 22.0%
- Percentage of females in production occupations:
Here: 5.5% city: 4.0%
- Percentage of females in material moving occupations:
Here: 3.8% city: 1.5%
Percentage of people 16-64 in Armed Forces:
| Cinderella: | 0.7% |
| San Jose: | 0.0% |
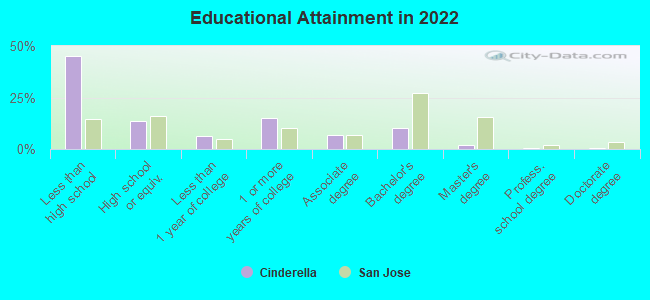
Education in this neighborhood (subdivision or community):
- Percentage of people 3 years and older in K-12 schools:
Cinderella: 20.1% San Jose: 16.1%
- Percentage of people 3 years and older in undergraduate colleges:
Cinderella: 6.3% San Jose: 6.5%
- Percentage of people 3 years and older in grad. or professional schools:
Cinderella: 1.2% San Jose: 2.0%
- Percentage of students K-12 enrolled in private schools:
Cinderella: 6.6% San Jose: 14.9%
Percentage of population below poverty level:
| Cinderella: | 9.1% |
| San Jose: | 9.0% |
Median year owner moved in (as recorded in 2022):
Median year renter moved in (as recorded in 2022):
| Cinderella: | 1993 |
| San Jose: | 2008 |
Median year renter moved in (as recorded in 2022):
| Cinderella: | 2013 |
| San Jose: | 2020 |
Percentage of married-couple families with both working:
| Cinderella: | 68.8% |
| San Jose: | 72.5% |
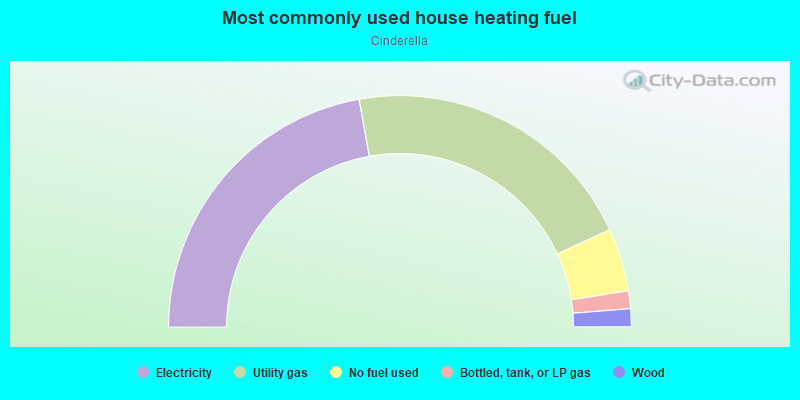
- 44.3%Electricity
- 41.8%Utility gas
- 8.8%No fuel used
- 2.5%Bottled, tank, or LP gas
- 2.5%Wood
Roads and streets:
Cinderella Ln
Length: 0.36 miles
Directions: E-W, SW-NE
Address range: 2060 to 2299
Directions: E-W, SW-NE
Address range: 2060 to 2299
S Jackson Ave
Length: 0.31 miles
Direction: SE-NW
Address range: 700 to 999
Direction: SE-NW
Address range: 700 to 999
Diadem Dr
Length: 0.29 miles
Direction: SE-NW
Address range: 700 to 1099
Direction: SE-NW
Address range: 700 to 1099
Nottoway Ave
Length: 0.27 miles
Directions: E-W, SE-NW, SW-NE
Address range: 2000 to 2199
Directions: E-W, SE-NW, SW-NE
Address range: 2000 to 2199
Diana Ave
Length: 0.25 miles
Direction: SE-NW
Address range: 800 to 986
Direction: SE-NW
Address range: 800 to 986
Angie Ave
Length: 0.22 miles
Direction: SW-NE
Address range: 2100 to 2299
Direction: SW-NE
Address range: 2100 to 2299
Tiara Dr
Length: 0.16 miles
Direction: SW-NE
Address range: 2100 to 2299
Direction: SW-NE
Address range: 2100 to 2299
Lyons Dr
Length: 0.16 miles
Directions: E-W, SW-NE
Address range: 2161 to 2299
Directions: E-W, SW-NE
Address range: 2161 to 2299
Pacina Dr
Length: 0.13 miles
Direction: SW-NE
Address range: 2150 to 2299
Direction: SW-NE
Address range: 2150 to 2299
Diana Pl
Length: 0.09 miles
Directions: E-W, N-S, SW-NE
Address range: 2100 to 2198
Directions: E-W, N-S, SW-NE
Address range: 2100 to 2198
Manassas Ct
Length: 0.08 miles
Direction: SW-NE
Address range: 2000 to 2199
Direction: SW-NE
Address range: 2000 to 2199
Diana Ln
Length: 0.07 miles
Direction: SE-NW
Address range: 700 to 799
Direction: SE-NW
Address range: 700 to 799
Steitz Ct
Length: 0.05 miles
Directions: N-S, SE-NW, SW-NE
Address range: 900 to 999
Directions: N-S, SE-NW, SW-NE
Address range: 900 to 999
Lyons Ct
Length: 0.02 miles
Direction: SE-NW
Address range: 2200 to 2299
Direction: SE-NW
Address range: 2200 to 2299