Circle J neighborhood in Santa Clarita, California (CA), 91321, 91350 detailed profile
Settings
X

Business Search - 14 Million verified businesses
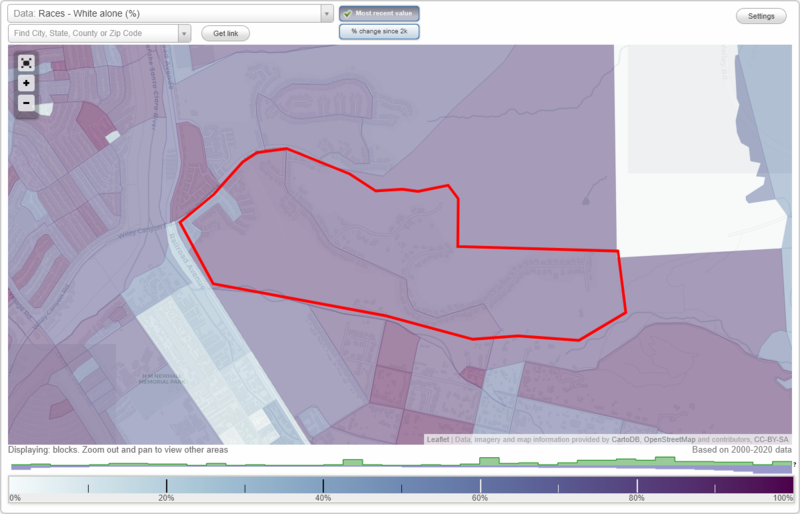
Area: 0.652 square miles
Population: 384
Population density:
| Circle J: | 589 people per square mile |
| Santa Clarita: | 4,628 people per square mile |

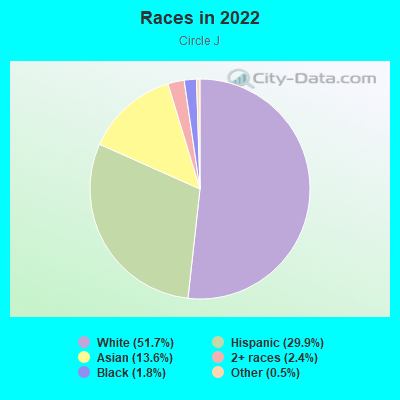
- 19751.7%White
- 11429.9%Hispanic or Latino
- 5213.6%Asian
- 92.4%Two or more races
- 71.8%Black
- 20.5%Some other race
Median household income in 2022:
| Circle J: | $135,941 |
| Santa Clarita: | $111,236 |
Distribution of median household income
![Distribution of median household income]()
- 1$10,000 to $19,999
- 10$20,000 to $29,999
- 4$30,000 to $39,999
- 1$40,000 to $49,999
- 3$50,000 to $59,999
- 3$60,000 to $74,999
- 16$75,000 to $99,999
- 9$100,000 to $124,999
- 19$125,000 to $149,999
- 29$150,000 to $199,999
- 30$200,000 or more

Distribution of owner-occupied house/condo value
![Distribution of owner-occupied house/condo value]()
- 7$100,000 to $149,999
- 18$300,000 to $399,999
- 5$400,000 to $499,999
- 54$500,000 to $749,999
- 15$750,000 to $999,999
- 49$1,000,000 or more

Distribution of rent paid by renters
![Distribution of rent paid by renters]()
- 20$1,250 to $1,499
- 8$1,500 to $1,999
- 38$2,000 or more

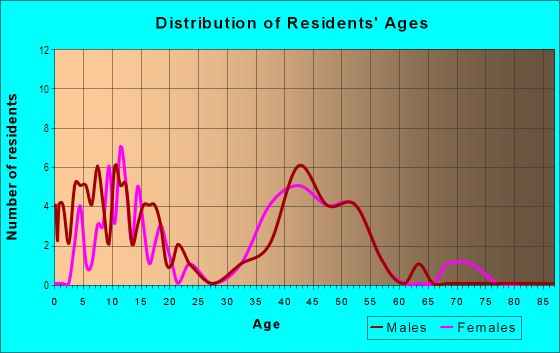
| Males: | 181 |
| Females: | 203 |
Males:
| This neighborhood: | 36.6 years |
| Whole city: | 37.6 years |
| This neighborhood: | 32.0 years |
| Whole city: | 37.6 years |
Average household size:
| Circle J: | 3.3 people |
| Santa Clarita: | 3.0 people |
Percentage of family households:
| Circle J: | 49.3% |
| Santa Clarita: | 57.1% |
| Here: | 68.2% |
| Santa Clarita: | 58.7% |
Percentage of married-couple families with children (among all households):
| Circle J: | 30.4% |
| Santa Clarita: | 24.9% |
Percentage of single-mother households (among all households):
| Circle J: | 0.9% |
| Santa Clarita: | 5.2% |
Percentage of never married males 15 years old and over:
Percentage of never married females 15 years old and over:
| Circle J: | 10.5% |
| Santa Clarita: | 15.3% |
Percentage of never married females 15 years old and over:
| Circle J: | 16.9% |
| city: | 16.0% |
Percentage of people that speak English not well or not at all:
| Circle J: | 3.6% |
| Santa Clarita: | 4.5% |
Percentage of people born in this state:
Percentage of people born in another U.S. state:
Percentage of native residents but born outside the U.S.:
Percentage of foreign born residents:
| Here: | 59.6% |
| Santa Clarita: | 62.8% |
Percentage of people born in another U.S. state:
| Circle J: | 15.9% |
| Santa Clarita: | 15.2% |
Percentage of native residents but born outside the U.S.:
| Here: | 1.8% |
| city: | 1.3% |
Percentage of foreign born residents:
| Here: | 22.7% |
| Santa Clarita: | 20.7% |
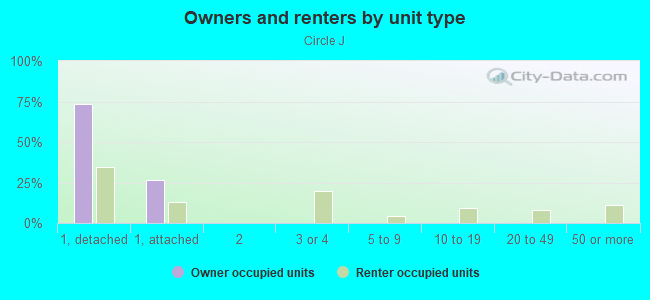
Owner-occupied
Renter-occupied


- Rooms in owner-occupied houses and condos in Circle J
- 01 room
- 02 rooms
- 03 rooms
- 44 rooms
- 155 rooms
- 216 rooms
- 157 rooms
- 58 rooms
- 119+ rooms
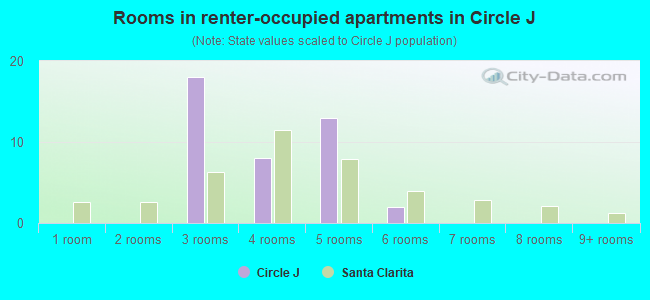
- Rooms in renter-occupied apartments in Circle J
- 01 room
- 02 rooms
- 183 rooms
- 84 rooms
- 135 rooms
- 26 rooms
- 07 rooms
- 08 rooms
- 09+ rooms
Owner-occupied
Renter-occupied
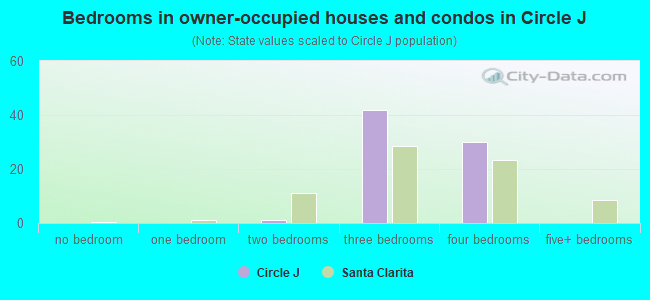
- Bedrooms in owner-occupied houses and condos in Circle J
- 0no bedroom
- 01 bedroom
- 12 bedrooms
- 423 bedrooms
- 304 bedrooms
- 05+ bedrooms
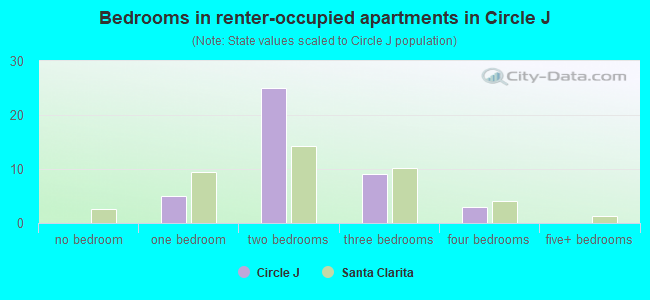
- Bedrooms in renter-occupied apartments in Circle J
- 0no bedroom
- 51 bedroom
- 252 bedrooms
- 93 bedrooms
- 34 bedrooms
- 05+ bedrooms
Average number of cars or other vehicles available in houses/condos:
Average number of cars or other vehicles available in apartments:
| This neighborhood: | 2.4 |
| Santa Clarita: | 2.3 |
Average number of cars or other vehicles available in apartments:
| Here: | 1.8 |
| city: | 1.9 |
Percentage of units with a mortgage:
| Circle J: | 77.4% |
| Santa Clarita: | 73.1% |
Housing prices:
- Average estimated value of detached houses in 2022 (45.8% of all units):
Circle J: $764,280 Santa Clarita: $861,132
- Average estimated value of townhouses or other attached units in 2022 (26.7% of all units):
This neighborhood: $534,204 city: $623,445
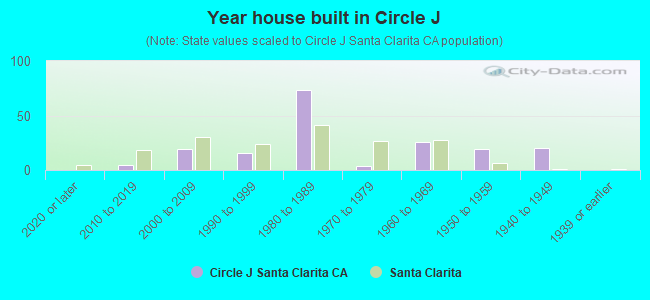
- Year house built in Circle J
- 02020 or later
- 52010 to 2019
- 192000 to 2009
- 161990 to 1999
- 731980 to 1989
- 41970 to 1979
- 261960 to 1969
- 191950 to 1959
- 201940 to 1949
- 01939 or earlier
City-data.com crime index for city in 2020 (higher means more crime):
| City: | 88.7 |
| U.S. average: | 219.5 |
Travel time to work (commute)
![Travel time to work (commute)]()
- 3Less than 5 minutes
- 65 to 9 minutes
- 710 to 14 minutes
- 2315 to 19 minutes
- 2020 to 24 minutes
- 1130 to 34 minutes
- 235 to 39 minutes
- 1040 to 44 minutes
- 3245 to 59 minutes
- 1660 to 89 minutes
- 490 or more minutes

Means of transportation to work
![Means of transportation to work]()
- 65.1%108Drove a car alone
- 9.6%16Carpooled
- 3.0%5Bus
- 12.1%20Walked
- 3.6%6Other means
- 16.3%27Worked at home

Time leaving home to go to work
![Time leaving home to go to work]()
- 1112:00 a.m. to 4:59 a.m.
- 95:00 a.m. to 5:29 a.m.
- 65:30 a.m. to 5:59 a.m.
- 86:00 a.m. to 6:29 a.m.
- 116:30 a.m. to 6:59 a.m.
- 127:00 a.m. to 7:29 a.m.
- 207:30 a.m. to 7:59 a.m.
- 128:00 a.m. to 8:29 a.m.
- 38:30 a.m. to 8:59 a.m.
- 139:00 a.m. to 9:59 a.m.
- 710:00 a.m. to 10:59 a.m.
- 812:00 p.m. to 3:59 p.m.
- 44:00 p.m. to 11:59 p.m.

Occupations of males:
- Percentage of males in management occupations (except farmers):
Here: 19.6% city: 14.9%
- Percentage of males in business and financial operations occupations:
Here: 5.1% city: 4.5%
- Percentage of males in computer and mathematical occupations:
Here: 7.0% city: 4.7%
- Percentage of males in architecture and engineering occupations:
Here: 8.3% city: 4.2%
- Percentage of males in legal occupations:
Here: 1.1% city: 0.7%
- Percentage of males in education, training, and library occupations:
Here: 5.8% city: 3.5%
- Percentage of males in arts, design, entertainment, sports, and media occupations:
Here: 3.0% city: 4.7%
- Percentage of males in healthcare practitioners and technical occupations:
Here: 3.4% city: 3.6%
- Percentage of males in service occupations:
Here: 7.6% city: 15.2%
- Percentage of males in sales and office occupations:
Here: 9.9% city: 16.4%
- Percentage of males in construction, extraction, and maintenance occupations:
Here: 3.0% city: 6.7%
- Percentage of males in production occupations:
Here: 4.4% city: 5.2%
- Percentage of males in transportation occupations:
Here: 12.5% city: 4.9%
- Percentage of males in material moving occupations:
Here: 1.4% city: 3.9%
Occupations of females:
- Percentage of females in management occupations (except farmers):
Here: 10.0% city: 11.3%
- Percentage of females in business and financial operations occupations:
Here: 8.3% city: 6.7%
- Percentage of females in computer and mathematical occupations:
Here: 4.6% city: 1.3%
- Percentage of females in community and social services occupations:
Here: 3.2% city: 1.9%
- Percentage of females in education, training, and library occupations:
Here: 6.7% city: 10.2%
- Percentage of females in healthcare practitioners and technical occupations:
Here: 16.9% city: 10.5%
- Percentage of females in service occupations:
Here: 19.0% city: 17.7%
- Percentage of females in sales and office occupations:
Here: 25.0% city: 28.5%
- Percentage of females in production occupations:
Here: 6.2% city: 2.7%
Percentage of people 16-64 in Armed Forces:
| Circle J: | 0.2% |
| Santa Clarita: | 0.1% |
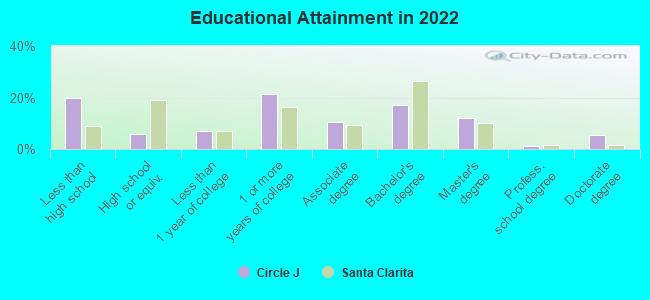
Education in this neighborhood (subdivision or community):
- Percentage of people 3 years and older in K-12 schools:
Circle J: 19.3% Santa Clarita: 17.8%
- Percentage of people 3 years and older in undergraduate colleges:
Circle J: 8.4% Santa Clarita: 5.9%
- Percentage of people 3 years and older in grad. or professional schools:
Circle J: 4.0% Santa Clarita: 1.1%
- Percentage of students K-12 enrolled in private schools:
Circle J: 15.1% Santa Clarita: 8.4%
Percentage of population below poverty level:
| Circle J: | 10.2% |
| Santa Clarita: | 7.5% |
Median year owner moved in (as recorded in 2022):
Median year renter moved in (as recorded in 2022):
| Circle J: | 2003 |
| Santa Clarita: | 2012 |
Median year renter moved in (as recorded in 2022):
| Circle J: | 2010 |
| Santa Clarita: | 2019 |
Percentage of married-couple families with both working:
| Circle J: | 71.6% |
| Santa Clarita: | 69.2% |
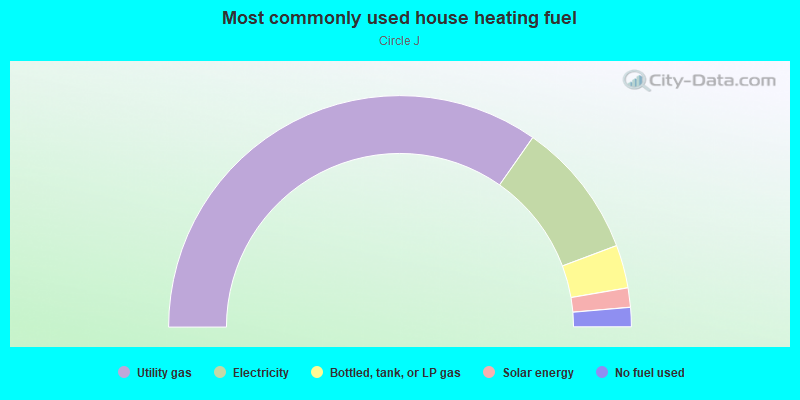
- 69.4%Utility gas
- 19.1%Electricity
- 6.0%Bottled, tank, or LP gas
- 2.7%Solar energy
- 2.7%No fuel used
Roads and streets:
Parvin Dr
Length: 0.94 miles
Directions: E-W, N-S, SE-NW, SW-NE
Address range: 21500 to 22099
Directions: E-W, N-S, SE-NW, SW-NE
Address range: 21500 to 22099
Circle J Ranch Rd
Length: 0.75 miles
Directions: E-W, N-S, SE-NW
Address range: 22200 to 22483
Directions: E-W, N-S, SE-NW
Address range: 22200 to 22483
Rolling Ridge Dr
Length: 0.56 miles
Directions: E-W, SE-NW, SW-NE
Address range: 22000 to 22299
Directions: E-W, SE-NW, SW-NE
Address range: 22000 to 22299
Barnhill Rd
Length: 0.23 miles
Directions: E-W, N-S, SW-NE
Address range: 25000 to 25199
Directions: E-W, N-S, SW-NE
Address range: 25000 to 25199
Clearview Ct
Length: 0.16 miles
Directions: N-S, SE-NW, SW-NE
Address range: 25300 to 25399
Directions: N-S, SE-NW, SW-NE
Address range: 25300 to 25399
Flower Field Ave
Length: 0.15 miles
Directions: E-W, SE-NW, SW-NE
Address range: 22700 to 22723
Directions: E-W, SE-NW, SW-NE
Address range: 22700 to 22723
Hacienda Ln
Length: 0.15 miles
Directions: E-W, SE-NW
Address range: 24911 to 24999
Directions: E-W, SE-NW
Address range: 24911 to 24999
Karie Ln
Length: 0.15 miles
Direction: N-S
Direction: N-S
Heather Vale St
Length: 0.14 miles
Direction: SE-NW
Address range: 25300 to 25330
Direction: SE-NW
Address range: 25300 to 25330
Rolling Green Way
Length: 0.12 miles
Directions: E-W, SE-NW, SW-NE
Address range: 25300 to 25324
Directions: E-W, SE-NW, SW-NE
Address range: 25300 to 25324
Oak Ridge Dr
Length: 0.11 miles
Directions: N-S, SE-NW
Address range: 22900 to 22977
Directions: N-S, SE-NW
Address range: 22900 to 22977
White Wing Way
Length: 0.10 miles
Directions: E-W, SW-NE
Address range: 22600 to 22610
Directions: E-W, SW-NE
Address range: 22600 to 22610
Jeniel Ct
Length: 0.09 miles
Directions: E-W, SE-NW
Address range: 22500 to 22599
Directions: E-W, SE-NW
Address range: 22500 to 22599
Little Ceder Way
Length: 0.08 miles
Direction: SW-NE
Address range: 22601 to 22616
Direction: SW-NE
Address range: 22601 to 22616
Vasquel Rocket
Length: 0.06 miles
Directions: E-W, SW-NE
Address range: 22600 to 22612
Directions: E-W, SW-NE
Address range: 22600 to 22612
Via Princessa
Length: 0.02 miles
Direction: SE-NW
Address range: 22400 to 22499
Direction: SE-NW
Address range: 22400 to 22499
Claibourne Ln
Length: 0.00 miles
Direction: SW-NE
Direction: SW-NE