Civic Center neighborhood in Oakland, California (CA), 94607, 94612 detailed profile
Settings
X

Business Search - 14 Million verified businesses
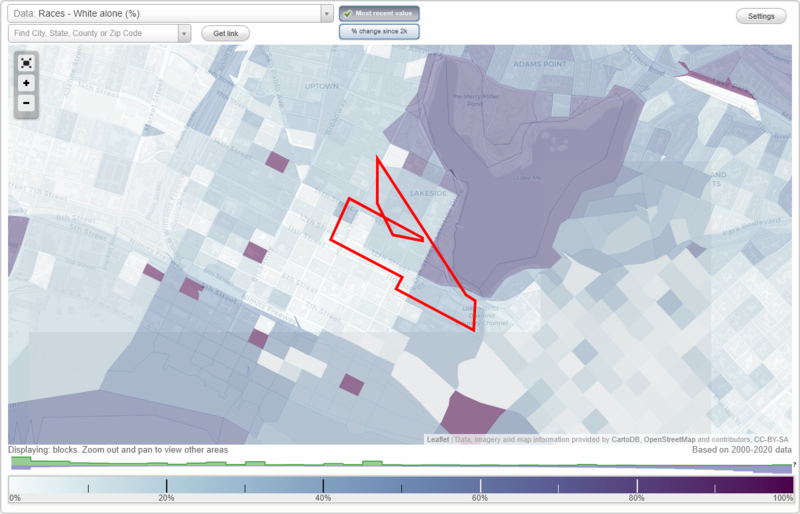
Area: 0.089 square miles
Population: 1,090
Population density:
| Civic Center: | 12,234 people per square mile |
| Oakland: | 7,680 people per square mile |

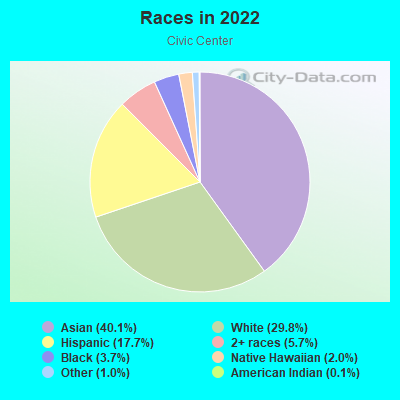
- 75968.8%Asian
- 13712.4%Black
- 908.2%White
- 373.4%Hispanic or Latino
- 333.0%Two or more races
- 232.1%Native Hawaiian and Other
Pacific Islander - 131.2%American Indian
- 121.1%Some other race
Distribution of median household income
![Distribution of median household income]()
- 99Less than $10,000
- 198$10,000 to $19,999
- 93$20,000 to $29,999
- 38$30,000 to $39,999
- 27$40,000 to $49,999
- 22$50,000 to $59,999
- 8$60,000 to $74,999
- 18$75,000 to $99,999
- 27$100,000 to $124,999
- 22$125,000 to $149,999
- 107$150,000 to $199,999
- 16$200,000 or more

Distribution of owner-occupied house/condo value
![Distribution of owner-occupied house/condo value]()
- 10Less than $50,000
- 22$250,000 to $299,999
- 29$300,000 to $399,999
- 89$400,000 to $499,999
- 261$500,000 to $749,999
- 12$750,000 to $999,999
- 11$1,000,000 or more

Distribution of rent paid by renters
![Distribution of rent paid by renters]()
- 20Less than $100
- 18$100 to $199
- 191$200 to $299
- 49$300 to $399
- 60$400 to $499
- 64$500 to $599
- 49$600 to $699
- 8$700 to $799
- 20$800 to $899
- 9$900 to $999
- 49$1,000 to $1,249
- 36$1,250 to $1,499
- 37$1,500 to $1,999
- 189$2,000 or more

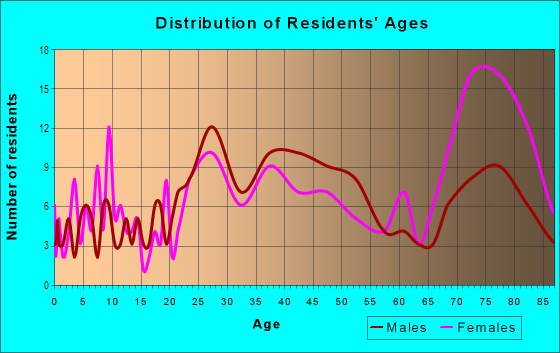
| Males: | 396 |
| Females: | 693 |
Males:
| This neighborhood: | 47.8 years |
| Whole city: | 38.3 years |
| This neighborhood: | 48.9 years |
| Whole city: | 39.1 years |
Average household size:
| Civic Center: | 1.6 people |
| Oakland: | 2.4 people |
Percentage of family households:
| Civic Center: | 21.7% |
| Oakland: | 37.1% |
| Here: | 29.9% |
| Oakland: | 34.9% |
Percentage of married-couple families with children (among all households):
| Civic Center: | 46.0% |
| Oakland: | 28.3% |
Percentage of single-mother households (among all households):
| Civic Center: | 65.5% |
| Oakland: | 9.9% |
Percentage of never married males 15 years old and over:
Percentage of never married females 15 years old and over:
| Civic Center: | 11.2% |
| Oakland: | 24.6% |
Percentage of never married females 15 years old and over:
| Civic Center: | 17.4% |
| city: | 21.9% |
Percentage of people that speak English not well or not at all:
| Civic Center: | 43.8% |
| Oakland: | 10.6% |
Percentage of people born in this state:
Percentage of people born in another U.S. state:
Percentage of native residents but born outside the U.S.:
Percentage of foreign born residents:
| Here: | 18.2% |
| Oakland: | 49.9% |
Percentage of people born in another U.S. state:
| Civic Center: | 9.6% |
| Oakland: | 22.3% |
Percentage of native residents but born outside the U.S.:
| Here: | 2.1% |
| city: | 1.6% |
Percentage of foreign born residents:
| Here: | 70.0% |
| Oakland: | 26.2% |
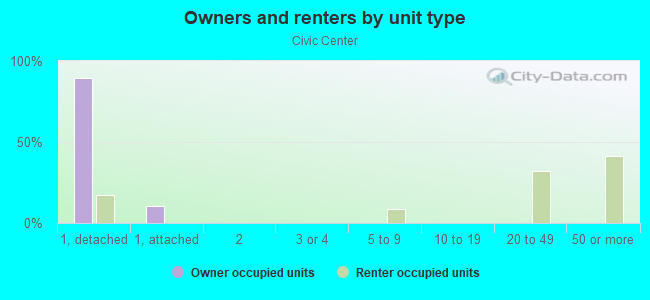
Owner-occupied
Renter-occupied

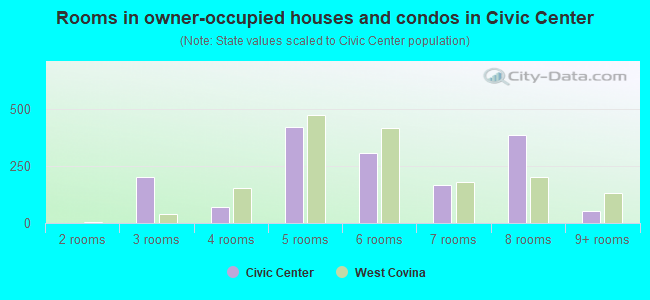
- Rooms in owner-occupied houses and condos in Civic Center
- 661 room
- 702 rooms
- 1033 rooms
- 1274 rooms
- 115 rooms
- 266 rooms
- 107 rooms
- 08 rooms
- 09+ rooms
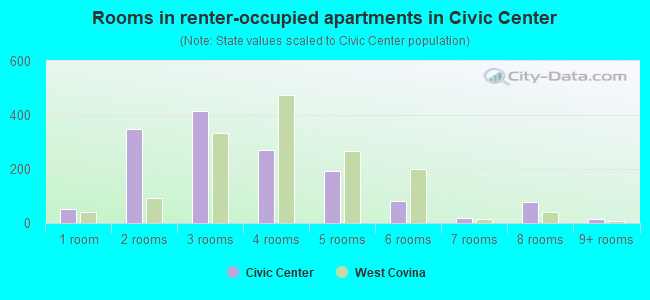
- Rooms in renter-occupied apartments in Civic Center
- 2101 room
- 1492 rooms
- 883 rooms
- 1164 rooms
- 45 rooms
- 286 rooms
- 237 rooms
- 08 rooms
- 179+ rooms
Owner-occupied
Renter-occupied
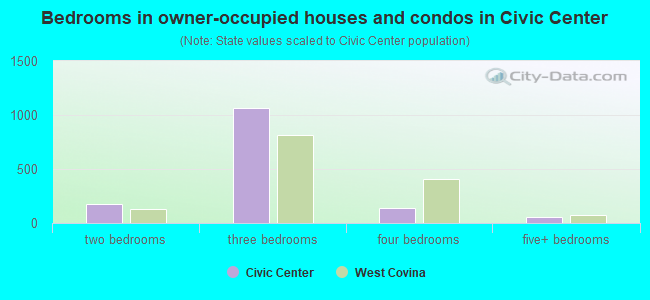
- Bedrooms in owner-occupied houses and condos in Civic Center
- 66no bedroom
- 1691 bedroom
- 112 bedrooms
- 133 bedrooms
- 104 bedrooms
- 05+ bedrooms
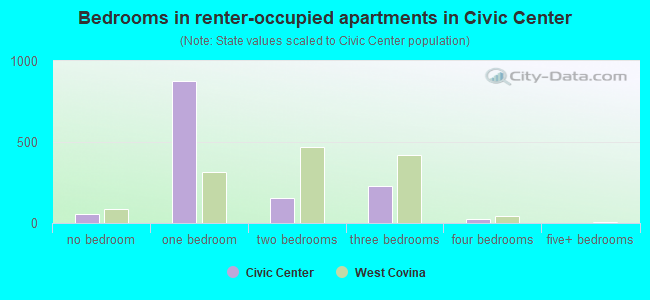
- Bedrooms in renter-occupied apartments in Civic Center
- 221no bedroom
- 2221 bedroom
- 1112 bedrooms
- 203 bedrooms
- 04 bedrooms
- 175+ bedrooms
Average number of cars or other vehicles available in houses/condos:
Average number of cars or other vehicles available in apartments:
| This neighborhood: | |
| Oakland: |
Average number of cars or other vehicles available in apartments:
| Here: | 0.5 |
| city: | 1.1 |
Percentage of units with a mortgage:
| Civic Center: | 94.6% |
| Oakland: | 71.2% |
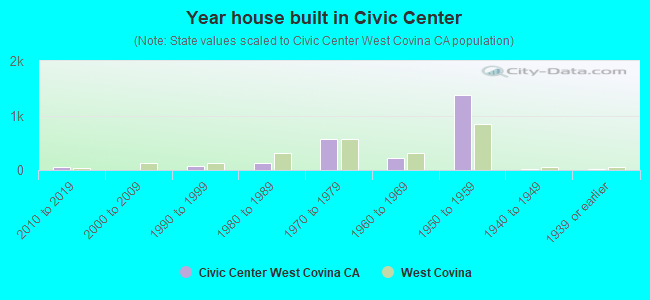
- Year house built in Civic Center
- 922020 or later
- 822010 to 2019
- 1032000 to 2009
- 1091990 to 1999
- 141980 to 1989
- 801970 to 1979
- 201960 to 1969
- 181950 to 1959
- 91940 to 1949
- 2391939 or earlier
City-data.com crime index for city in 2020 (higher means more crime):
| City: | 691.6 |
| U.S. average: | 219.5 |
Travel time to work (commute)
![Travel time to work (commute)]()
- 8Less than 5 minutes
- 665 to 9 minutes
- 7510 to 14 minutes
- 11115 to 19 minutes
- 9520 to 24 minutes
- 7725 to 29 minutes
- 22930 to 34 minutes
- 835 to 39 minutes
- 3540 to 44 minutes
- 5345 to 59 minutes
- 2160 to 89 minutes
- 1090 or more minutes

Means of transportation to work
![Means of transportation to work]()
- 25.7%120Drove a car alone
- 10.5%49Carpooled
- 4.9%23Bus
- 28.7%134Subway or elevated rail
- 6.9%32Long-distance train or commuter rail
- 4.7%22Light rail, streetcar or trolley
- 1.9%9Ferryboat
- 3.6%17Taxi
- 9.2%43Bicycle
- 16.3%76Walked
- 3.9%18Other means
- 16.9%79Worked at home

Time leaving home to go to work
![Time leaving home to go to work]()
- 412:00 a.m. to 4:59 a.m.
- 245:00 a.m. to 5:29 a.m.
- 125:30 a.m. to 5:59 a.m.
- 396:00 a.m. to 6:29 a.m.
- 106:30 a.m. to 6:59 a.m.
- 677:00 a.m. to 7:29 a.m.
- 637:30 a.m. to 7:59 a.m.
- 1398:00 a.m. to 8:29 a.m.
- 2178:30 a.m. to 8:59 a.m.
- 1449:00 a.m. to 9:59 a.m.
- 14510:00 a.m. to 10:59 a.m.
- 1411:00 a.m. to 11:59 a.m.
- 1712:00 p.m. to 3:59 p.m.
- 234:00 p.m. to 11:59 p.m.

Occupations of males:
- Percentage of males in management occupations (except farmers):
Here: 38.4% city: 13.5%
- Percentage of males in computer and mathematical occupations:
Here: 1.4% city: 7.3%
- Percentage of males in architecture and engineering occupations:
Here: 16.9% city: 3.8%
- Percentage of males in education, training, and library occupations:
Here: 4.2% city: 4.6%
- Percentage of males in healthcare practitioners and technical occupations:
Here: 1.1% city: 2.8%
- Percentage of males in service occupations:
Here: 29.6% city: 12.9%
- Percentage of males in sales and office occupations:
Here: 1.7% city: 13.4%
- Percentage of males in material moving occupations:
Here: 5.4% city: 4.5%
Occupations of females:
- Percentage of females in management occupations (except farmers):
Here: 5.7% city: 15.1%
- Percentage of females in business and financial operations occupations:
Here: 23.5% city: 8.2%
- Percentage of females in computer and mathematical occupations:
Here: 6.1% city: 3.0%
- Percentage of females in architecture and engineering occupations:
Here: 3.3% city: 1.6%
- Percentage of females in community and social services occupations:
Here: 6.1% city: 3.7%
- Percentage of females in healthcare practitioners and technical occupations:
Here: 10.9% city: 6.7%
- Percentage of females in service occupations:
Here: 32.8% city: 17.8%
- Percentage of females in sales and office occupations:
Here: 7.9% city: 20.0%
- Percentage of females in production occupations:
Here: 5.3% city: 2.4%
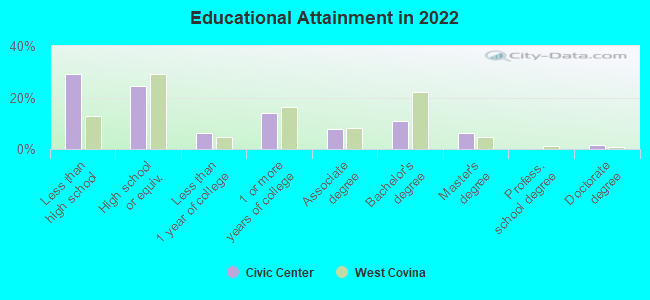
Education in this neighborhood (subdivision or community):
- Percentage of people 3 years and older in K-12 schools:
Civic Center: 8.1% Oakland: 13.0%
- Percentage of people 3 years and older in undergraduate colleges:
Civic Center: 5.9% Oakland: 4.3%
- Percentage of people 3 years and older in grad. or professional schools:
Civic Center: 11.0% Oakland: 1.8%
- Percentage of students K-12 enrolled in private schools:
Civic Center: 19.3% Oakland: 15.8%
Percentage of population below poverty level:
| Civic Center: | 30.0% |
| Oakland: | 13.9% |
Median year renter moved in (as recorded in 2022):
| Civic Center: | 2012 |
| Oakland: | 2018 |
Percentage of married-couple families with both working:
| Civic Center: | 288.3% |
| Oakland: | 73.2% |
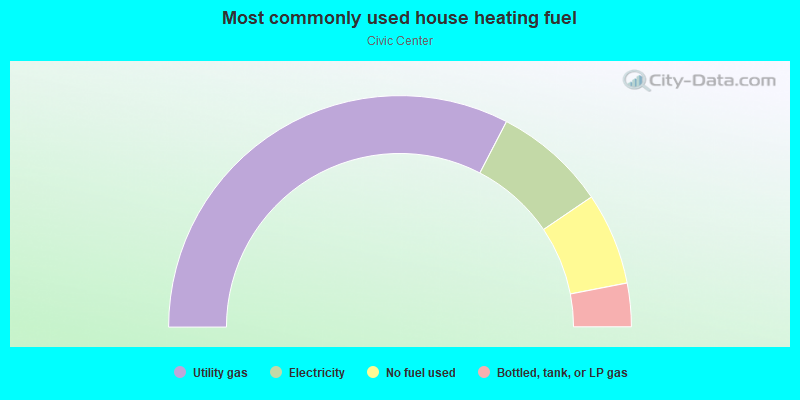
- 54.8%Electricity
- 28.1%Utility gas
- 7.4%Bottled, tank, or LP gas
- 3.8%Other fuel
- 3.0%No fuel used
- 2.8%Coal or coke
Roads and streets:
13th St
Length: 0.62 miles
Directions: E-W, SE-NW
Address range: 1 to 299
Directions: E-W, SE-NW
Address range: 1 to 299
12th St
Length: 0.60 miles
Direction: E-W
Address range: 1 to 299
Direction: E-W
Address range: 1 to 299
14th St
Length: 0.59 miles
Directions: E-W, N-S, SE-NW
Address range: 1 to 299
Directions: E-W, N-S, SE-NW
Address range: 1 to 299
11th St
Length: 0.29 miles
Directions: E-W, SW-NE
Address range: 1 to 99
Directions: E-W, SW-NE
Address range: 1 to 99
Oak St
Length: 0.18 miles
Directions: N-S, SW-NE
Address range: 1100 to 1399
Directions: N-S, SW-NE
Address range: 1100 to 1399
14th
Length: 0.17 miles
Directions: E-W, SE-NW
Directions: E-W, SE-NW
Harrison St
Length: 0.12 miles
Direction: SW-NE
Address range: 1200 to 1399
Direction: SW-NE
Address range: 1200 to 1399
Madison St
Length: 0.12 miles
Direction: SW-NE
Address range: 1200 to 1399
Direction: SW-NE
Address range: 1200 to 1399
Jackson St
Length: 0.11 miles
Direction: SW-NE
Address range: 1200 to 1399
Direction: SW-NE
Address range: 1200 to 1399
Alice St
Length: 0.11 miles
Direction: SW-NE
Address range: 1301 to 1399
Direction: SW-NE
Address range: 1301 to 1399
Fallon St
Length: 0.05 miles
Direction: SW-NE
Address range: 1200 to 1299
Direction: SW-NE
Address range: 1200 to 1299