Civic Center neighborhood in Warrenville, Illinois (IL), 60555 detailed profile
Settings
X

Business Search - 14 Million verified businesses
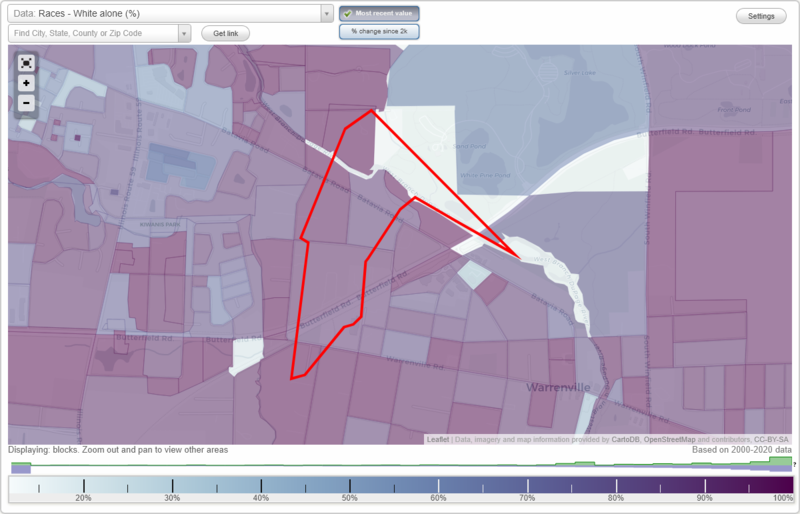
Area: 0.238 square miles
Population: 289
Population density:
| Civic Center: | 1,216 people per square mile |
| Warrenville: | 2,536 people per square mile |

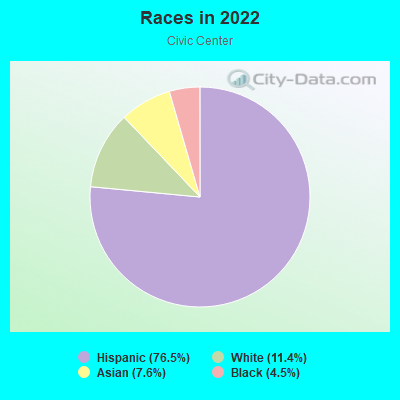
- 22176.5%Hispanic or Latino
- 3311.4%White
- 227.6%Asian
- 134.5%Black
Median household income in 2022:
| Civic Center: | $67,201 |
| Warrenville: | $95,919 |
Distribution of median household income
![Distribution of median household income]()
- 2Less than $10,000
- 4$10,000 to $19,999
- 18$20,000 to $29,999
- 11$30,000 to $39,999
- 27$40,000 to $49,999
- 5$50,000 to $59,999
- 5$60,000 to $74,999
- 9$75,000 to $99,999
- 7$100,000 to $124,999
- 11$125,000 to $149,999
- 4$150,000 to $199,999
- 6$200,000 or more

Distribution of owner-occupied house/condo value
![Distribution of owner-occupied house/condo value]()
- 1Less than $50,000
- 5$100,000 to $149,999
- 17$150,000 to $199,999
- 10$200,000 to $249,999
- 1$250,000 to $299,999
- 3$300,000 to $399,999
- 5$400,000 to $499,999
- 4$500,000 to $749,999
- 2$750,000 to $999,999
- 2$1,000,000 or more

Distribution of rent paid by renters
![Distribution of rent paid by renters]()
- 2$300 to $399
- 3$900 to $999
- 17$1,000 to $1,249
- 55$1,250 to $1,499
- 2$1,500 to $1,999
- 2$2,000 or more

Median rent in 2022:
| Civic Center: | $1,321 |
| Warrenville: | $1,515 |
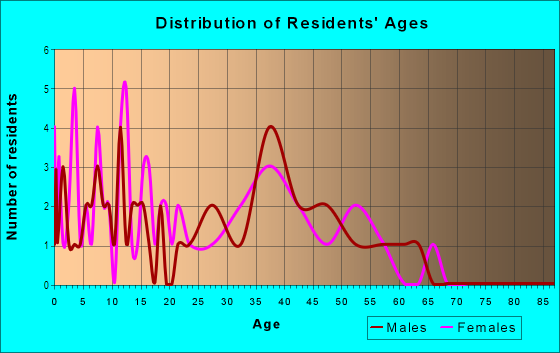
| Males: | 149 |
| Females: | 140 |
Males:
| This neighborhood: | 35.9 years |
| Whole city: | 38.2 years |
| This neighborhood: | 43.2 years |
| Whole city: | 38.7 years |
Average household size:
| Civic Center: | 2.8 people |
| Warrenville: | 2.5 people |
Percentage of family households:
| Civic Center: | 86.5% |
| Warrenville: | 44.4% |
| Here: | 47.4% |
| Warrenville: | 48.2% |
Percentage of married-couple families with children (among all households):
| Civic Center: | 12.4% |
| Warrenville: | 28.4% |
Percentage of single-mother households (among all households):
| Civic Center: | 16.0% |
| Warrenville: | 10.3% |
Percentage of never married males 15 years old and over:
Percentage of never married females 15 years old and over:
| Civic Center: | 20.5% |
| Warrenville: | 18.6% |
Percentage of never married females 15 years old and over:
| Civic Center: | 13.6% |
| city: | 16.8% |
Percentage of people that speak English not well or not at all:
| Civic Center: | 11.8% |
| Warrenville: | 4.0% |
Percentage of people born in this state:
Percentage of people born in another U.S. state:
Percentage of native residents but born outside the U.S.:
Percentage of foreign born residents:
| Here: | 57.1% |
| Warrenville: | 66.7% |
Percentage of people born in another U.S. state:
| Civic Center: | 16.8% |
| Warrenville: | 16.5% |
Percentage of native residents but born outside the U.S.:
| Here: | 0.0% |
| city: | 1.1% |
Percentage of foreign born residents:
| Here: | 26.0% |
| Warrenville: | 15.8% |

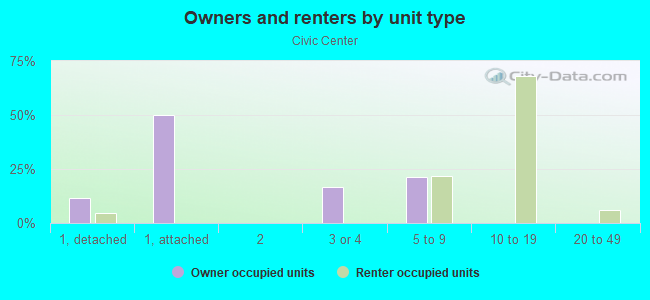
Owner-occupied
Renter-occupied

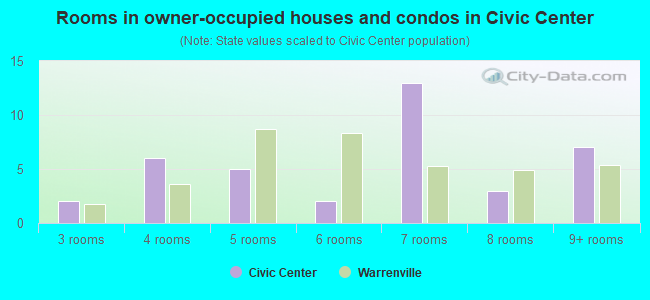
- Rooms in owner-occupied houses and condos in Civic Center
- 01 room
- 02 rooms
- 23 rooms
- 64 rooms
- 55 rooms
- 26 rooms
- 137 rooms
- 38 rooms
- 79+ rooms
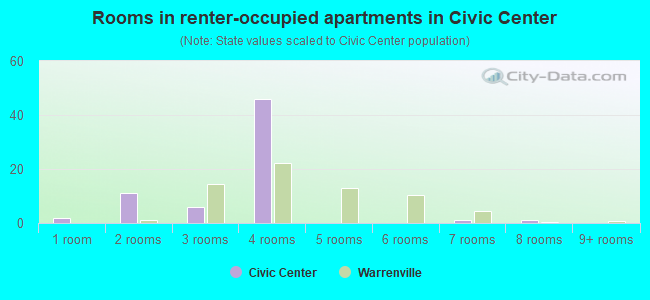
- Rooms in renter-occupied apartments in Civic Center
- 21 room
- 112 rooms
- 63 rooms
- 464 rooms
- 05 rooms
- 06 rooms
- 17 rooms
- 18 rooms
- 09+ rooms
Owner-occupied
Renter-occupied
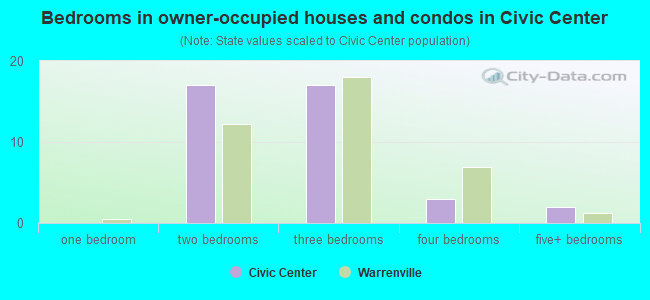
- Bedrooms in owner-occupied houses and condos in Civic Center
- 0no bedroom
- 01 bedroom
- 172 bedrooms
- 173 bedrooms
- 34 bedrooms
- 25+ bedrooms
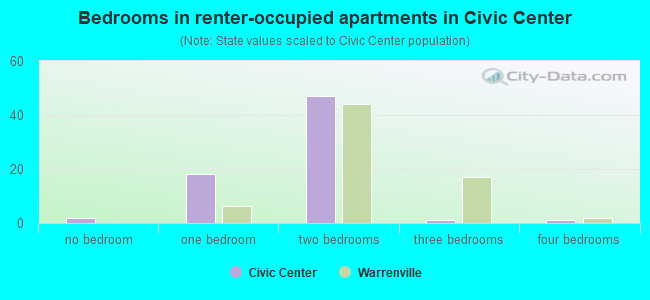
- Bedrooms in renter-occupied apartments in Civic Center
- 2no bedroom
- 181 bedroom
- 472 bedrooms
- 13 bedrooms
- 14 bedrooms
- 05+ bedrooms
Average number of cars or other vehicles available in houses/condos:
Average number of cars or other vehicles available in apartments:
| This neighborhood: | 2.1 |
| Warrenville: | 2.0 |
Average number of cars or other vehicles available in apartments:
| Here: | 1.7 |
| city: | 1.7 |
Percentage of units with a mortgage:
| Civic Center: | 47.1% |
| Warrenville: | 71.3% |
Housing prices:
- Average estimated value of detached houses in 2022 (4.4% of all units):
Civic Center: $522,078 Warrenville: $342,709
- Average estimated value of townhouses or other attached units in 2022 (20.0% of all units):
This neighborhood: $159,819 city: $232,940
- Average estimated '22 value of housing units in 3-to-4-unit structures (6.7% of all units):
Civic Center: $159,168 city: $149,902
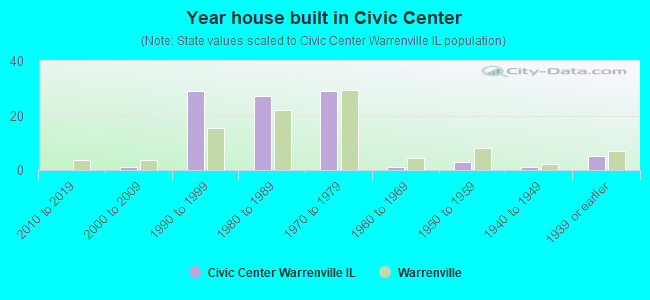
- Year house built in Civic Center
- 02020 or later
- 02010 to 2019
- 12000 to 2009
- 291990 to 1999
- 271980 to 1989
- 291970 to 1979
- 11960 to 1969
- 31950 to 1959
- 11940 to 1949
- 51939 or earlier
City-data.com crime index for city in 2020 (higher means more crime):
| City: | 76.5 |
| U.S. average: | 219.5 |
Travel time to work (commute)
![Travel time to work (commute)]()
- 125 to 9 minutes
- 1210 to 14 minutes
- 1615 to 19 minutes
- 1320 to 24 minutes
- 325 to 29 minutes
- 1530 to 34 minutes
- 135 to 39 minutes
- 140 to 44 minutes
- 1545 to 59 minutes
- 860 to 89 minutes
- 190 or more minutes

Means of transportation to work
![Means of transportation to work]()
- 71.1%126Drove a car alone
- 26.0%46Carpooled
- 2.3%4Worked at home

Time leaving home to go to work
![Time leaving home to go to work]()
- 312:00 a.m. to 4:59 a.m.
- 75:30 a.m. to 5:59 a.m.
- 56:00 a.m. to 6:29 a.m.
- 106:30 a.m. to 6:59 a.m.
- 187:00 a.m. to 7:29 a.m.
- 127:30 a.m. to 7:59 a.m.
- 88:00 a.m. to 8:29 a.m.
- 58:30 a.m. to 8:59 a.m.
- 59:00 a.m. to 9:59 a.m.
- 310:00 a.m. to 10:59 a.m.
- 111:00 a.m. to 11:59 a.m.
- 912:00 p.m. to 3:59 p.m.
- 14:00 p.m. to 11:59 p.m.

Occupations of males:
- Percentage of males in computer and mathematical occupations:
Here: 1.7% city: 4.8%
- Percentage of males in education, training, and library occupations:
Here: 2.0% city: 3.3%
- Percentage of males in service occupations:
Here: 53.3% city: 13.7%
- Percentage of males in sales and office occupations:
Here: 3.3% city: 12.3%
- Percentage of males in farming, fishing, and forestry occupations:
Here: 1.6% city: 1.7%
- Percentage of males in construction, extraction, and maintenance occupations:
Here: 9.7% city: 7.9%
- Percentage of males in production occupations:
Here: 7.3% city: 7.2%
- Percentage of males in transportation occupations:
Here: 4.0% city: 4.3%
- Percentage of males in material moving occupations:
Here: 19.0% city: 6.7%
Occupations of females:
- Percentage of females in education, training, and library occupations:
Here: 14.1% city: 9.2%
- Percentage of females in service occupations:
Here: 43.7% city: 19.9%
- Percentage of females in sales and office occupations:
Here: 9.5% city: 25.8%
- Percentage of females in production occupations:
Here: 12.1% city: 4.1%
- Percentage of females in material moving occupations:
Here: 19.1% city: 3.7%
Education in this neighborhood (subdivision or community):
- Percentage of people 3 years and older in K-12 schools:
Civic Center: 37.5% Warrenville: 17.1%
- Percentage of people 3 years and older in undergraduate colleges:
Civic Center: 1.4% Warrenville: 5.0%
- Percentage of people 3 years and older in grad. or professional schools:
Civic Center: 4.2% Warrenville: 1.4%
- Percentage of students K-12 enrolled in private schools:
Civic Center: 0.9% Warrenville: 8.1%
Percentage of population below poverty level:
| Civic Center: | 12.8% |
| Warrenville: | 8.6% |
Median year owner moved in (as recorded in 2022):
Median year renter moved in (as recorded in 2022):
| Civic Center: | 2006 |
| Warrenville: | 2008 |
Median year renter moved in (as recorded in 2022):
| Civic Center: | 2016 |
| Warrenville: | 2018 |
Percentage of married-couple families with both working:
| Civic Center: | 89.2% |
| Warrenville: | 73.3% |
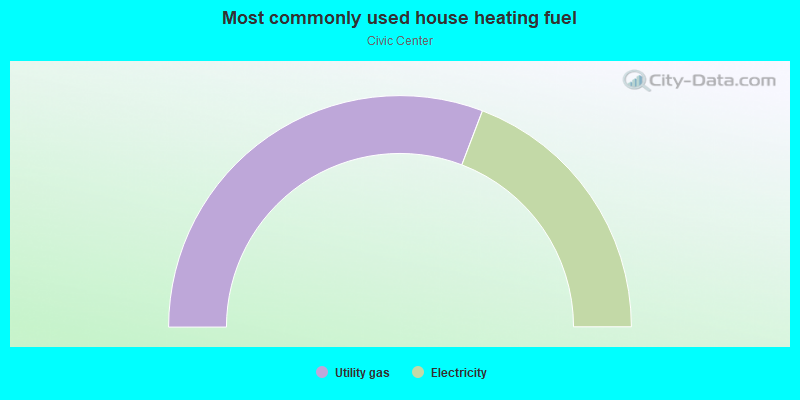
- 61.6%Utility gas
- 38.4%Electricity
Highways in this neighborhood:
Butterfield Rd (State Rte 56)
Length: 0.89 miles
Directions: E-W, SW-NE
Directions: E-W, SW-NE
Roads and streets:
Rockwell St
Length: 0.47 miles
Directions: N-S, SE-NW, SW-NE
Address range: 35301 to 35399
Directions: N-S, SE-NW, SW-NE
Address range: 35301 to 35399
Main St
Length: 0.45 miles
Direction: E-W
Direction: E-W
Batavia Rd
Length: 0.43 miles
Directions: E-W, SE-NW
Directions: E-W, SE-NW
Warrenville Rd (Aurora Rd)
Length: 0.38 miles
Direction: E-W
Direction: E-W
Ray St
Length: 0.35 miles
Direction: E-W
Direction: E-W
Manning Ave
Length: 0.33 miles
Directions: N-S, SW-NE
Directions: N-S, SW-NE
Stafford Pl
Length: 0.29 miles
Directions: E-W, SW-NE
Directions: E-W, SW-NE
Williams Rd
Length: 0.19 miles
Directions: E-W, N-S, SE-NW
Address range: 35101 to 35354
Directions: E-W, N-S, SE-NW
Address range: 35101 to 35354
Curtis Ave
Length: 0.18 miles
Direction: N-S
Direction: N-S
Calumet Ave E
Length: 0.17 miles
Direction: E-W
Direction: E-W
Mignin Dr
Length: 0.15 miles
Direction: N-S
Direction: N-S
Warren Ave
Length: 0.14 miles
Direction: SE-NW
Direction: SE-NW
Tracy Pl
Length: 0.10 miles
Direction: SW-NE
Direction: SW-NE
Riverview Dr
Length: 0.10 miles
Direction: SE-NW
Direction: SE-NW
Mount St
Length: 0.05 miles
Direction: E-W
Direction: E-W